1 Laboratory for Assessment and Research in Cardiorespiratory Performance, Physical Therapy Department, Universidade Federal de Minas
Gerais (UFMG), Belo Horizonte, MG, Brazil
2 Pulmonary Physical Therapy Research Laboratory (LFIP), Physical Therapy Department, Universidade Estadual de Londrina (UEL), Londrina,
PR, Brazil
3 Health Sciences Research Center, Universidade Norte do Paraná (UNOPAR), Londrina, PR, Brazil
4 Cardiopulmonary Physiology and Physical Therapy Laboratory, Physical Therapy Department, Universidade Federal de Pernambuco (UFPE),
Recife, PE, Brazil
5 Graduate Program in Rehabilitation Sciences, Universidade Federal de Ciências da Saúde de Porto Alegre (UFCSPA), Porto Alegre, RS, Brazil
Received: 11/22/2012 Revised: 04/29/2013 Accepted: 06/07/2013 a r t i c l e
Reference equations for the six-minute walk
distance based on a Brazilian multicenter study
Raquel R. Britto1, Vanessa S. Probst2,3,
Armele F. Dornelas de Andrade4, Giane A. R. Samora1,
Nidia A. Hernandes2,3, Patrícia E. M. Marinho4,
Marlus Karsten5, Fabio Pitta2, Veronica F. Parreira1
ABSTRACT | Background: It is important to include large sample sizes and different factors that inluence the
six-minute walking distance (6MWD) in order to propose reference equations for the six-six-minute walking test (6MWT).
Objective: To evaluate the inluence of anthropometric, demographic, and physiologic variables on the 6MWD of healthy subjects from different regions of Brazil to establish a reference equation for the Brazilian population. Method:
In a multicenter study, 617 healthy subjects performed two 6MWTs and had their weight, height, and body mass index (BMI) measured, as well as their physiologic responses to the test. Delta heart rate (∆HR), perceived effort, and peripheral oxygen saturation were calculated by the difference between the respective values at the end of the test minus the baseline value. Results: Walking distance averaged 586±106m, 54m greater in male compared to female subjects (p<0.001). No differences were observed among the 6MWD from different regions. The quadratic regression analysis considering only anthropometric and demographic data explained 46% of the variability in the 6MWT (p<0.001) and derived the equation: 6MWDpred=890.46–(6.11×age)+(0.0345×age2)+(48.87×gender)–(4.87×BMI). A second model
of stepwise multiple regression including ∆HR explained 62% of the variability (p<0.0001) and derived the equation: 6MWDpred=356.658–(2.303×age)+(36.648×gender)+(1.704×height)+(1.365×∆HR). Conclusion: The equations proposed in this study, especially the second one, seem adequate to accurately predict the 6MWD for Brazilians.
Keywords: walking; exercise test; reference values; regression analysis; rehabilitation.
HOW TO CITE THIS ARTICLE
Britto RR, Probst VS, Dornelas de Andrade AF, Samora GAR, Hernandes NA, Marinho PEM et al. Reference equations for the six-minute walk distance based on a Brazilian multicenter study. Braz J Phys Ther. 2013 Nov-Dec; 17(6):556-563. http://dx.doi. org/10.1590/S1413-35552012005000122
Introduction
The ability to walk a distance is an easy and inexpensive way to assess physical capacity in health and illness. Among the ield tests proposed in the literature, the 6-minute walk test (6MWT) has been widely used to assess the functional exercise capacity of patients with limiting conditions such as cardiopulmonary diseases1. The test is simple, safe and provides a global and integrated response of all systems involved during exercise based on the distance walked in a level corridor during 6 minutes (6MWD)1,2. The 6MWT has a submaximal
design2 and, because most activities of daily living
are performed at submaximal levels, it is a good reflection of the functional exercise level for daily physical activities1,3. The distance covered
during the test has been used to assess response to therapeutic interventions (pharmacological and non-pharmacological)4 to detect exertional desaturation and need of long-term oxygen therapy5 and to predict morbimortality in cardiopulmonary diseases6-8.
considered in future studies were identiied11,12,16,18. Firstly, it is essential that new studies be performed with larger sample sizes11,16,18. Secondly, since the
age range is limited in some of the studies2,13,17, not all equations are applicable to young people. Finally, although the interference of physiologic variables (e.g., heart rate) in the 6MWD has been suggested and considered important12,13,18, few studies have considered these variables in reference equations.
Given that Brazil is a large country with different climates and diverse socioeconomic and cultural conditions, a multicenter study that can provide samples from different regions of the country is vital to establishing a more representative reference equation for the 6MWT18. Therefore, taking into consideration the importance of the 6MWT in clinical and research settings, by circumventing some of the current limitations, we aimed to study the inluence of anthropometric, demographic, and physiologic variables on the 6MWT of a large, multicenter sample of healthy Brazilian subjects and to establish an equation for predicting reference values of the 6MWT for the Brazilian population.
Method
Subjects
In the present multicenter study, although a sample size of 328 subjects was calculated to consider four variables in the regression model, 629 healthy subjects from four centers located in the Northeastern (1), Southeastern (2), and Southern (1) regions of Brazil were included. They were recruited from the local community and among students and employees of four universities, as well as their relatives. All of them had their anthropometric and demographic characteristics assessed and performed two 6MWTs. Data were collected from July 2008 to July 2011. The study was approved by the Research Ethics Committee of Universidade Federal de Minas Gerais (UFMG), Belo Horizonte, MG, Brazil (ETIC approval number 390-04). All participants gave written informed consent.
The inclusion criteria were: subjects of both genders aged 18 years or more; ability to understand and perform all procedures proposed; absence of any severe and/or unstable disease which could limit exercise tolerance, such as chronic obstructive pulmonary disease, asthma, cystic ibrosis, interstitial lung disease, angina, myocardial infarction, congestive heart failure, stroke, transient ischemic attack, peripheral vascular disease, and arthritis19. Subjects were excluded if they had a body mass index (BMI) under 18kg.m–2 and above
40kg.m–2 or if they could not perform two 6MWTs for any reason.
6-minute walk test
In all centers, subjects performed two 6MWTs according to the ATS standardized protocol1 with, at least, 30 min of rest between them. The test was performed in a 30-m corridor, and the subjects were instructed to keep walking for 6 minutes. The best walked distance was considered for analysis. The tests were applied by a physical therapist or previously trained physical therapy student, and both 6MWTs were applied by the same assessor. Blood pressure, heart rate (HR), peripheral oxygen saturation (SpO2), and perceived dyspnea and leg fatigue (modiied Borg scale)20 were assessed before and immediately after the tests. During the tests, HR and SpO2 were continuously veriied and standardized phrases of encouragement were spoken to the participants every minute1(ATS, 2002). The predicted maximal HR (HRmax) was derived from the formula HRmax=220–age21. The delta of HR (∆HR), perceived effort (∆Borg), and SpO2 (∆SpO2) were calculated by the difference between the respective value at the end of the test minus the baseline value.
Anthropometric and demographic data and health status
A questionnaire was applied in order to investigate the health status of the participants. Height (cm) and body weight (Kg) were measured, and the BMI was calculated.
Statistical analysis
best independent coeficient of determination (R2)
and statistical signiicance as p<0.05. The irst model included only demographic and anthropometric variables as independent variables (age, gender, weight, height, and BMI). In a stepwise multiple linear regression model, the assumptions of normality of the residuals score were not met, so a quadratic regression model (Equation 1) was used. The second model, a stepwise multiple linear regression model, included the same independent variables used in the irst model in addition to physiologic variables (SpO2, HRmax % predicted, ∆HR) and the normality of the residuals score was met (Equation 2). Since equation 2 showed a much higher coeficient of determination (see results), further analysis focused on this specific equation. In order to verify the reliability of Equation 2, it was applied a posteriori
analysis in a different group of healthy subjects, composed of 58 individuals selected according to the same inclusion criteria in the different centers. In addition, Equation 2 was cross-validated against prediction equations existing in the literature in this group, considering only the subjects with the same age range of each study. The level of statistical signiicance was considered as p<0.05.
Results
From the 629 healthy subjects selected, 12 (2%) were excluded and 617 were included in the inal analysis. The subjects were aged 19 to 79 years and 52% were women. Table 1 shows descriptive data on
characteristics of the studied subjects and outcome parameters of the best 6MWT. The participants were distributed by age range as follows: 19-29 years (n=155); 30-39 years (n=66); 40-49 years (n=77); 50-59 years (n=83); 60-69 years (n=110), and 70-79 years (n=126). According to the BMI classiication of body composition (kg/m2), 47.1% were normal (18.5
to 24.9), 37.9% were overweight (25.0 to 29.9), and 14.9% were obese (30.0 to 39.9).
Comparison between regions
Table 2 shows that, despite the differences in anthropometric parameters observed among the 3 different regions, the 6MWD was similar.
6MWT determinants and reference equations
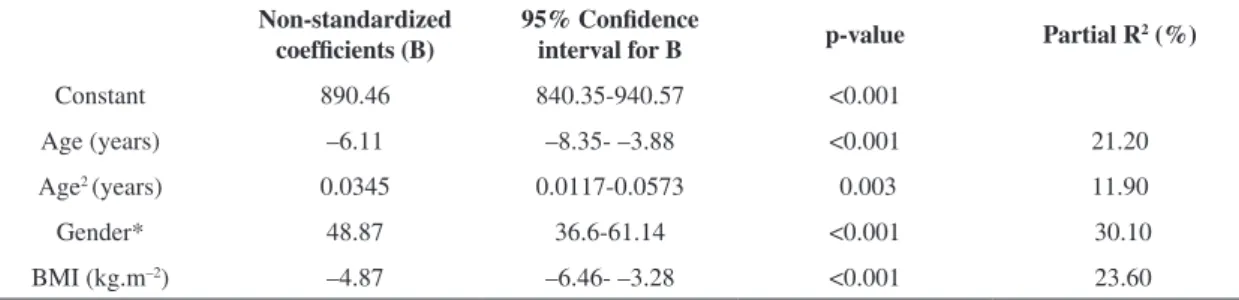
There were signiicant correlations between the walked distance and age (r=0.55, p<0.0001), height (r=0.48, p<0.0001), BMI (r=0.40, p<0.0001), and ∆HR (r=0.43, p<0.0001). A model of quadratic regression analysis showed that age, gender, and BMI explained 46% of the variability in the 6MWT (R2=0.46, p<0.0001; Table 3). The derived
equation (Equation 1) for the 6MWT based on this analysis considering only anthropometric and demographic data was:
6MWDpred=890.46–(6.11×age)+(0.0345×age2)+
(48.87×gender)–(4.87×BMI)
(where male gender = 1 and female gender=0).
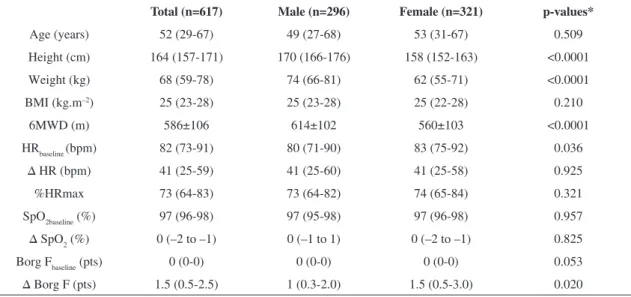
Table 1. Characteristics of the subjects and outcome parameters of the best 6MWT.
Total (n=617) Male (n=296) Female (n=321) p-values*
Age (years) 52 (29-67) 49 (27-68) 53 (31-67) 0.509 Height (cm) 164 (157-171) 170 (166-176) 158 (152-163) <0.0001
Weight (kg) 68 (59-78) 74 (66-81) 62 (55-71) <0.0001
BMI (kg.m–2) 25 (23-28) 25 (23-28) 25 (22-28) 0.210
6MWD (m) 586±106 614±102 560±103 <0.0001
HRbaseline (bpm) 82 (73-91) 80 (71-90) 83 (75-92) 0.036
∆ HR (bpm) 41 (25-59) 41 (25-60) 41 (25-58) 0.925 %HRmax 73 (64-83) 73 (64-82) 74 (65-84) 0.321
SpO2baseline (%) 97 (96-98) 97 (95-98) 97 (96-98) 0.957
∆ SpO2 (%) 0 (–2 to –1) 0 (–1 to 1) 0 (–2 to –1) 0.825 Borg Fbaseline (pts) 0 (0-0) 0 (0-0) 0 (0-0) 0.053 ∆ Borg F (pts) 1.5 (0.5-2.5) 1 (0.3-2.0) 1.5 (0.5-3.0) 0.020
Data are expressed as median (interquartile range 25%-75%) except for the 6MWD (mean and SD). BMI: body mass index; 6MWT: 6-minute
walk test; HR: heart rate, %HRmax: % of the maximal predicted heart rate; SpO2: peripheral oxygen saturation; Borg F: perceived leg fatigue
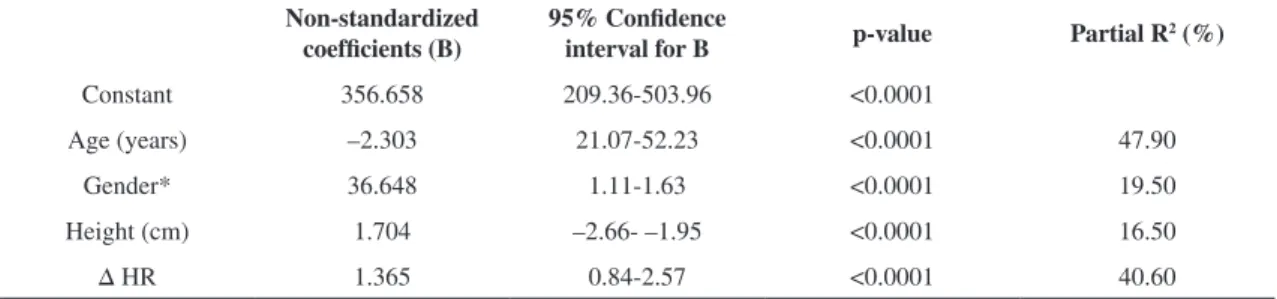
The second model of stepwise multiple regression showed that age, gender, height, and ∆HR explained 62% (R2=0.616, p<0.0001) of the variability in the
6MWT (Table 4). The derived equation (Equation 2) for the distance walked in the 6MWT was:
6MWDpred=356.658–(2.303×age)+(36.648×gender)+ (1.704×height)+(1.365×∆HR)
(where male gender=1 and female gender=0).
Reliability of equation 2 and comparison with other reference equations
The characteristics of the other group composed of 58 healthy subjects (23 male and 35 female) included in the a posteriori analysis were: age 52±15 years
and BMI 26±4 kg/m2. When equation 2 was applied
in this group, there was no difference between the actual and the predicted 6MWD (565 m vs. 582 m, p=0.11, respectively) with a signiicant correlation between them (r=0.76, p<0.0001).
When previous reference equations published in the literature were applied in the a posteriori analysis,
positive and signiicant correlations with the walked distance by the 58 subjects were observed (Table 5). The comparison indicated differences in four of them2,10,11,17.
Discussion
This study presented new equations to predict the distance covered during the 6MWT in Brazilian subjects and showed that approximately 62% of the variance was explained by gender, age, height, and the change in heart rate (∆HR) during the test. When no physiologic variables were entered into the logistic analysis, approximately 47% of the variance was explained by the combination of gender, age, age2, and BMI.
The present study has two strong methodological characteristics. Firstly, to the best of our knowledge, this is the study with the largest sample to propose a reference equation for the 6MWT in this population. Secondly, this study had a multicenter design and was therefore the irst to have a sample composed of subjects from three regions of the country.
The sample was well distributed according to age, considering the classiication of the American College of Sports Medicine22, with 221 (35.8%)
young (<39yr), 200 (32.4%) middle-aged (40-64yr), and 196 (31.8%) elderly (65-79yr) subjects. The number of overweight and obese subjects (levels I and II) is similar to the one identified in the Brazilian population23. Thus, the sample relects the characteristics and variations as they exist in the real
Table 2. Anthropometric characteristics and 6MWD values from the three regions.
Southeast (n=194) South (n=271) Northeast (n=152) p value#
Age (years) 47.00 (33.0-67.00) 58.00* (37.00-69.00) 35.50*† (22.00-57.00) <0.001 Height (cm) 166.00 (158.75-172.00) 167.00 (157.00-174.00) 160.50*† (154.25-165.75) <0.001
Weight (kg) 69.95 (62.00-79.28) 71.00 (63.00-79.20) 59.90*† (55.00-68.81) <0.001
BMI (kg.m-2) 25.48 (23.08-28.13) 25.59 (23.39-27.97) 23.46*† (21.01-27.23) <0.001
6MWD (m) 570.00 (515.75-642.00) 581.00 (512.00-658.00) 598.00*† (477.13-664.50) 0.457
Data are expressed as median (interquartile range 25%-75%). #Kruskal-Wallis Test. *p<0.01 compared to Southeast; † p<0.01 compared to
South. Post hoc Mann-Whitney test. 6MWD= six minute walking distance.
Table 3. Quadratic regression with the 6MWD as dependent variable considering only demographic variables (Equation 1).
Non-standardized coefficients (B)
95% Confidence
interval for B p-value Partial R
2 (%)
Constant 890.46 840.35-940.57 <0.001
Age (years) –6.11 –8.35- –3.88 <0.001 21.20
Age2 (years) 0.0345 0.0117-0.0573 0.003 11.90
Gender* 48.87 36.6-61.14 <0.001 30.10 BMI (kg.m–2) –4.87 –6.46- –3.28 <0.001 23.60
Standard error of the estimate=77.2 m. BMI=body mass index; The derived equation for the 6MWD predicted based on the quadratic regression
analysis was: 6MWDpred=890.46–(6.11×age)+(0.0345×age2)+(48.87×gender)-(4.87×BMI); *Male gender=1 and female gender=0. 95% CI
population, increasing the external validity. Previous studies have reported the inluence of age11,20,24 and BMI on the 6MWD11,16,24.
The results indicated differences between the anthropometric characteristics of subjects from different regions. However, it was not suficient to produce differences in walking distance when the three regions were compared. Region-to-region difference occurred when comparing the Northeast to the other two regions, although this difference
was probably due to the younger age of this speciic subgroup. Taking into consideration the absence of differences (Table 4), this indicates the possibility of generalizing the 6MWD reference equations for all Brazilian regions, at least in studies where a large age-range is considered15,16.
The influence of the relative intensity of the test represented by the ∆HR was identiied as an important variable with 41% of partial correlation in Equation 2. The study by Chetta et al.13 mentioned
Table 4. Multiple linear stepwise regression analysis with the 6MWD as dependent variable considering demographic variables and delta heart rate (Equation 2).
Non-standardized coefficients (B)
95% Confidence
interval for B p-value Partial R
2 (%)
Constant 356.658 209.36-503.96 <0.0001
Age (years) –2.303 21.07-52.23 <0.0001 47.90 Gender* 36.648 1.11-1.63 <0.0001 19.50 Height (cm) 1.704 –2.66- –1.95 <0.0001 16.50 ∆ HR 1.365 0.84-2.57 <0.0001 40.60
Standard error of the estimate =64.3 m. The derived equation for the 6MWD based on the regression analysis was: 6MWDpred=356.658–
(2.303×age)+(36.648×gender)+(1.704×height)+(1.365×∆HR). *Male gender=1 and female gender=0.
Table 5. Comparison and correlation between the actual walked distance in the a posteriori group (n=58) (median 565 meters) and the
predicted distance by other previously published equations.
Equation/age range (years)
Number of pairs with similar age
Predicted distance (m)
Spearman Correlation (rho; p-value)
Enright and Sherrill9
40-80
Male (n=117) 18 555 (411-654) 0.63; 0.005 Female (n=173) 31 518 (367-642) 0.39; 0.028 Troosters et al. 2
50-85 (n=31) 35 606 (431-747)* 0.57; <0.0001 Gibbons et al.10
20-80 (n=79) 58 667 (558-803)* 0.63; <0.0001
Chetta et al.13
20-50 (n=102) 25 597 (530-680) 0.53; 0.006 Camarri et al.11
55-75 (n=22) 21 661 (601-746)* 0.58; 0.006
Iwama et al.16
13-84 (n=134) 58 550 (477-643) 0.59; <0.0001 Dourado et al.17
≥40 (n=90) 49 598 (464-688)* 0.48; <0.0001
Soares and Pereira15
20-80 (n=132) 58 550 (398-661) 0.71; <0.0001
Data expressed as median (minimum-maximum). *p<0.0001 compared with the walked distance of the 58 individuals=565 m (352-870).
the importance of considering the heart rate during the 6MWT, however this variable was not included in the reference equation proposed by those authors. Poh et al.12 considered the % of predicted HRmax in the equation as well as age, height, and weight and explained 78% of the variance of the 6MWD, despite the small sample size (n=35). The authors considered that the use of the % of predicted HRmax in the equation may be limited when measuring the 6MWD in subjects with diseases or medications which have an inluence on HRmax. However, the use of the change in HR during the test (∆HR) could, at least in part, counteract this limitation. This may happen since these diseases and medications interfere not only in the HR at the end of the test but also in the resting HR, and therefore their inluence on this speciic outcome (∆HR) may be counterbalanced and reduced.
A recent international multicenter study evaluated the geographic variations of the 6MWD in a cohort of healthy adults and suggested that the resulting distance could be inluenced by factors such as the speed of habitual walking and other aspects related to lifestyle such as the motivation of the subject and/ or the assessor25. These aspects were not evaluated in the present study, however they could inluence the ∆HR. As the 6MWT is self-paced, the use of the ∆HR considers the freedom of the subjects to choose the speed, despite the standardized instructions and encouragement. Furthermore, the inluence of encouragement on the subject’s performance has been discussed since 1984 by Guyatt et al.26, and the
ATS Guidelines (2002)1 consider it an important determinant of the distance covered in the 6MWT. Nevertheless, motivation involves two aspects: extrinsic and intrinsic motivation27. Standardizing motivation phrases is a way to control the extrinsic factor, which produces different responses in subjects depending on their intrinsic motivation. The ∆HR could indicate how the subjects respond to the extrinsic motivation during the 6MWT. This self-determination theory has been used to evaluate the response of changes in exercise training behavior26
but has not been evaluated in self-regulated exercise tests. All of these factors help to explain, at least in part, the positive role of including ∆HR in the prediction of the 6MWD’s normal values. Recently, the use of rest HR was considered to predict maximal oxygen consumption based on the 6MWT28.
Equation 1, which considered only anthropometric and demographic variables, explained almost half of the variance in the 6MWT. This showed that age, gender, and BMI are important to predict the 6MWD in agreement with the vast majority of the studies
designed to propose reference equations for this test. It is, therefore, an option to be used in case it is not possible to obtain the ∆HR and use Equation 2.
The comparison with other studies allowed us to identify that the equations proposed by Troosters et al.2, Gibbons et al.10, Camarri et al.11, and Dourado et al.17 predicted 6MWD with a
statistical difference in comparison to the distance observed in the present study. These discrepancies could be related to differences in the test protocol, encouragement, and different aspects of motivation, as previously discussed. Sample size2,3,10,17, combined
with different characteristics of each population2,3,10, could also contribute to this discrepancy. The equation proposed by Iwama et al.16 for the Brazilian population, based on the same age range and a sample of 134 subjects, explained only 30% of the variation in the 6MWD. Dourado et al.17 also found similar results, explaining 54.3% of the 6MWD variance in a model based on the age, weight, height, and gender of 90 healthy adults, not including young subjects. Based on 132 volunteers (also 20-80 years of age) better distributed using the adjusted quadratic model, Soares and Pereira15 proposed a model based on height, age, and BMI and explained 55% of the variance in the 6MWD.
Despite a larger sample, our irst equation, based only on anthropometric and demographic data, explained 46% of the variance. This relatively low coeficient of determination can be partially explained by the difference in anthropometric variables between different regions included in the study, without difference between 6MWD values. On the other hand, Equation 2 (including HR) explained 62% of the variance in the 6MWD, well above the previous equations. Despite the fact that this physiological variable is a result of the work performed in the test, it can contribute to the understanding of the expected performance for individuals with different anthropometric characteristics and, particularly, in different age ranges. Thus, at present, Equation 2 seems to stand out as superior (i.e. has fewer limitations) for accurately predicting the 6MWD for Brazilians.
The 6MWT is frequently used in physical therapy routine. The ATS recommends the assessment of HR during the test. In this way, the use of Equation 2 could help determine whether changes in the 6MWD are also related to intrinsic motivation, which is an open ield of investigation in regard to self-paced tests.
by these models, future studies could explore the contribution of other behavioral and/or physiologic factors. The repeatability of the 6MWT with the same subject in a sequence of days could contribute to evaluate the inluence of HR and intrinsic motivation behavior on 6MWD variation. It would be also interesting to assess the subjects’ level of physical activity. This information could be evaluated as an independent variable and/or used to better identify the subjects’ HR response.
Limitation
Although this was a multicenter study, the sample was not randomized. However, we evaluated volunteers from different centers, which can, at least in part, guarantee the diversiication of the sample.
Conclusion
In summary, the present study showed that the distance covered during six minutes can be better explained and predicted when considering the HR changes during the test in addition to the anthropometric parameters. Furthermore, we have proposed two new reference equations, one of them including the heart rate changes during the test. These equations, especially the second, seem to be adequate to accurately predict the 6MWD for Brazilians.
Acknowledgments
The authors would like to thank the undergraduate students who helped with data collection and Conselho Nacional de Desenvolvimento Científico e Tecnológico-CNPq, Brazil (process 77137/2008-3)
and Fundação de Amparo a Pesquisa do Estado de
Minas Gerais-FAPEMIG, Brazil (PPM00072-09) for
their inancial support.
References
1. ATS Committee on Proiciency Standards for Clinical Pulmonary Function Laboratories. ATS statement: guidelines for the six-minute walk test. Am J Respir Crit Care Med. 2002;166(1):111-7. PMid:12091180. http:// dx.doi.org/10.1164/ajrccm.166.1.at1102
2. Troosters T, Gosselink R, Decramer Ml. Six minute walking distance in healthy elderly subjects. Eur Respir J. 1999;14(2):270-4. PMid:10515400. http://dx.doi. org/10.1034/j.1399-3003.1999.14b06.x
3. Simões LA, Dias JM, Marinho KC, Pinto CL, Britto RR. Relationship between functional capacity assessed by walking test and respiratory and lower limb muscle function in community-dwelling elders. Rev Bras
Fisioter. 2010;14(1):24-30. PMid:20414558. http://dx.doi. org/10.1590/S1413-35552010000100005
4. Puhan MA, Mador MJ, Held U, Goldstein R, Guyatt GH, Schünemann HJ. Interpretation of treatment changes in 6-minute walk distance in patients with COPD. Eur Respir J. 2008;32(3):637-43. PMid:18550610. http://dx.doi. org/10.1183/09031936.00140507
5. Poulain M, Durand F, Palomba B, Ceugniet F, Desplan J, Varray A, et al. 6-minute walk testing is more sensitive than maximal incremental cycle testing for detecting oxygen desaturation in patients with COPD. Chest. 2003;123(5):1401-7. PMid:12740254. http://dx.doi. org/10.1378/chest.123.5.1401
6. Pinto-Plata VM, Cote C, Cabral H, Taylor J, Celli BR. The 6-min walk distance: change over time and value as a predictor of survival in severe COPD. Eur Respir J. 2004;23(1):28-33. PMid:14738227. http://dx.doi.org/10. 1183/09031936.03.00034603
7. Cote CG, Casanova C, Marín JM, Lopez MV, Pinto-Plata V, De Oca MM, et al. Validation and comparison of reference equations for the 6-min walk distance test. Eur Respir J. 2008;31(3):571-8. PMid:17989117. http://dx.doi. org/10.1183/09031936.00104507
8. Cote CG, Pinto-Plata V, Kasprzyk K, Dordelly LJ, Celli BR. The 6-min walk distance, peak oxygen uptake, and mortality in COPD. Chest. 2007;132(6):1778-85. PMid:17925409. http://dx.doi.org/10.1378/chest.07-2050 9. Enright PL, Sherrill DL. Reference equations for the
six-minute walk in healthy adults. Am J Respir Crit Care Med. 1998;158(5):1384-7. PMid:9817683. http://dx.doi. org/10.1164/ajrccm.158.5.9710086
10. Gibbons WJ, Fruchter N, Sloan S, Levy RD. Reference values for a multiple repetition 6-minute walk test in healthy adults older than 20 years. J Cardiopulm Rehabil. 2001;21(2):87-93. PMid:11314289. http://dx.doi. org/10.1097/00008483-200103000-00005
11. Camarri B, Eastwood PR, Cecins NM, Thompson PJ, Jenkins S. Six minute walk distance in healthy subjects aged 55-75 years. Respir Med. 2006;100(4):658-65. PMid:16229997. http://dx.doi.org/10.1016/j. rmed.2005.08.003
12. Poh H, Eastwood PR, Cecins NM, Ho KT, Jenkins SC. Six-minute walk distance in healthy Singaporean adults cannot be predicted using reference equations derived f r o m C a u c a s i a n p o p u l a t i o n s . R e s p i r o l o g y . 2006;11(2):211-6. PMid:16548908. http://dx.doi. org/10.1111/j.1440-1843.2006.00820.x
13. Chetta A, Zanini A, Pisi G, Aiello M, Tzani P, Neri M, et al. Reference values for the 6-min walk test in healthy subjects 20-50 years old. Respir Med. 2006;100(9):1573-8. PMid:16466676. http://dx.doi. org/10.1016/j.rmed.2006.01.001
14. Alameri H, Al-Majed S, Al-Howaikan A. Six-min walk test in a healthy adult Arab population. Respir Med. 2009;103(7):1041-6. PMid:19230640. http://dx.doi. org/10.1016/j.rmed.2009.01.012
16. Iwama AM, Andrade GN, Shima P, Tanni SE, Godoy I, Dourado VZ. The six-minute walk test and body weight-walk distance product in healthy Brazilian subjects. Braz J Med Biol Res. 2009;42(11):1080-5. PMid:19802464. http://dx.doi.org/10.1590/S0100-879X2009005000032 17. Dourado VZ, Vidotto MC, Guerra RL. Reference
equations for the performance of healthy adults on ield walking tests. J Bras Pneumol. 2011;37(5):607-14. PMid:22042392. http://dx.doi.org/10.1590/ S1806-37132011000500007
18. Dourado VZ. Reference equations for the 6-minute walk test in healthy individuals. Arq Bras Cardiol. 2011;96:e128-38. http://dx.doi.org/10.1590/S0066-782X2011005000024 19. Enright PL. The six-minute walk test. Respir Care.
2003;48(8):783-5. PMid:12890299.
20. Borg GA. Psychophysical bases of perceived exertion. Med Sci Sports Exerc. 1982;14(5):377-81. PMid:7154893. http://dx.doi.org/10.1249/00005768-198205000-00012 21. Karvonen MJ, Kentala E, Mustala O. The effects of
training on heart rate: a longitudinal study. Ann Méd Exper Fenn. 1957;35(3):307-15.
22. American College of Sports Medicine Position Stand. Position Stand on The Recommended Quantity and Quality of Exercise for Developing and Maintaining Cardiorespiratory and Muscular Fitness, and Flexibility in Adults. Med Sci Sports Exerc. 1998;30(6):975-91. PMid:9624661. http://dx.doi. org/10.1097/00005768-199806000-00032
23. Instituto Brasileiro de Geograia e Estatística. Sala de Imprensa. Available from: http://saladeimprensa.ibge. gov.br/noticias?view=noticia&id=1&busca=1%idnoti ca=1699.
24. Pires SR, Oliveira AC, Parreira VF, Britto RR. Six-minute walk test at different ages and body mass index. Rev Bras Fisioter. 2007;11(2):147-51.
25. Casanova C, Celli BR, Barria P, Casas A, Cote C, De Torres JP, et al. The 6-min walk distance in healthy subjects: reference standards from seven countries. Eur Respir J. 2011;37(1):150-6. PMid:20525717. http://dx.doi. org/10.1183/09031936.00194909
26. Guyatt GH, Pugsley SO, Sullivan MJ, Thompson PJ, Berman L, Jones NL, et al. Effect of encouragement on walking test performance. Thorax. 1984;39(11):818-22. PMid:6505988 PMCid:PMC459930. http://dx.doi. org/10.1136/thx.39.11.818
27. Markland D, Tobin V. A modiication to the behavioural regulation in exercise questionnaire to include an assessment of amotivation. J Sport Exerc Psychol. 2004;26(2):191-6.
28. Burr JF, Bredin SS, Faktor MD, Warburton DE. The 6-minute walk test as a predictor of objectively measured aerobic itness in healthy working-aged adults. Phys Sportsmed. 2011;39(2):133-9. PMid:21673494. http:// dx.doi.org/10.3810/psm.2011.05.1904
Correspondence
Raquel R. Britto