Quim. Nova, Vol. 27, No. 2, 193-195, 2004
Artigo
*e-mail: [email protected]
QUANTITATIVE ANALYSIS OF PHENOL AND ALKYLPHENOLS IN BRAZILIAN COAL TAR
Elina Bastos Caramão
Instituto de Química, Universidade Federal do Rio Grande do Sul, Av. Bento Gonçalves, 9.500, 91501-970 Porto Alegre - RS Irajá do Nascimento Filho*
Departamento de Química, Universidade Regional Integrada do Alto Uruguai e das Missões, Av. Sete de Setembro, 1621, 99700-000 Erechim - RS
Recebido em 13/1/03; aceito em 29/10/03
The main purpose of this work is the identification and quantification of phenolic compounds in coal tar samples from a ceramics factory in Cocal (SC), Brazil. The samples were subjected to preparative scale liquid chromatography, using Amberlyst A-27TM ion-exchange resin as stationary phase. The fractions obtained were classified as “acids” and “BN” (bases and neutrals). The identification and quantification of phenols, in the acid fraction, was made by gas chromatography coupled to mass spectrometry (GC/MS). Nearly twenty-five phenols were identified in the samples and nine of them were also quantified. The results showed that coal tar has large quantities of phenolic compounds of industrial interest.
Keywords: coal tar; phenols; GC/MS.
INTRODUCTION
Coal is used in industries as a natural source of energy, mainly in gasification processes. An important by-product of the thermal treatment of this matrix is coal tar, considered today as an environmental by pollutant material1. On the other hand, substances that have wide application in the chemical and pharmacological industries can be found in this matrix2. Phenol and substituted phenolic compounds are widely used in the production of polymers, drugs, dyes, explosives, pesticides, stabilizers and antioxidants3,4.
However, when phenolic compounds are discharged into the environment they can represent a serious hazard, mainly by the contamination of superficial and underground waters. Thus, at trace levels they can cause prejudice to the majority of the aquatic organisms and can induce bioaccumulation in the food chain4-6. Phenolic compounds are also pointed out as important co-carcinogenic substances3,7. They can considerably increase the effects of a secondary carcinogen (a substance that does not form cancerous tumors at the introduction point but in remote points and, sometimes, in specific organs).
The importance of co-carcinogenic properties of phenolic compounds is higher than that normally assigned to them, since some kinds of human cancer, due the exposition to certain materials, can results from small quantities of primary carcinogens (which promote animal cancers at the application point) and relatively higher quantities of co-carcinogens3.
The presence of phenolic compounds in the environment is preoccupying not only due to the knowledge of their dangerous facets but (maybe mainly) from some indications that these compounds can be genotoxic and there is a lack of enough data to discard with security, this possibility3.
Thus, the investigation of components of coal tar that can promote hazardous effects to human health and to the environment and, on the other side, the social and economic advantages that result from
industrial utilization of these compounds, where a decrease the costs of medical treatment, for example, must be carefully considered.
Coal is an alternative energy source that will assume a future key position with the decrease of oil production. The southern region of Brazil is an important coal producer and consumer, mainly in thermoeletric power plants. In spite of this, there is a lack of Brazilian work focusing on the phenolic composition of coal tar and its utilization as feedstock for other industries. In this work phenols were extracted by ion-exchange liquid chromatography and quantified by GC/MSD using the internal standard method.
EXPERIMENTAL PART
Coal tar samples were obtained from the ceramic industry Eliane (Cocal-SC/Brazil). Reagents and solvents utilized in this work were of p.a. grade, purchased from Merck S.A. The following standards (Sigma-Aldrich) were used: phenol, o-cresol, p-cresol, m-cresol, 2-ethylphenol, 2,5-dim2-ethylphenol, 4-2-ethylphenol, 2,3-dim2-ethylphenol, 3,4-dimethylphenol. 4-n-propylphenol was used as internal standard. Resin treatment
10 g of Amberlyst A-27TM resin (Sigma-Aldrich) were mixed with 50 mL of a mixture of NH4OH and methanol diluted in methanol (1+9, v/v). This mixture was stirred for 3 min and, after a few minutes at rest, the resin was washed in a sinterined glass funeel with the following solvents: methanol (25 mL), water (until pH 7), acetone (25 mL) and n-hexane (25 mL).
Sample fractionation
194 Caramão e Nascimento Filho Quim. Nova
of formic acid/diethyl ether (1+6 v/v). The acidic fraction was dried with anhydrous sodium sulfate and its volume was reduced to 1 mL under a gentle steam of ultra-pure nitrogen. The acid fraction was derivatized with bis-trimethylsilylacetamide (BSA)8to improve the chromatographic performance of the phenolic compounds9-12. The extraction procedures were made in triplicate and each acid fraction was injected three times (resulting 9 injections) in the GC/MS system (SCAN mode). These injections were made for specify the single ions for the quantitative analisys (SIM mode).
Quantitative analysis
Individual stock solutions were made with each standard phenolic compound at 1,000 mg L-1 in dichloromethane. The standard compounds were at least 99% pure. A spike solution (also in dichloromethane) at 100 mg L-1 of all the standards was made from the stock solution. An aliquot of this spike solution was submitted to the extraction process and 1 µL of the extracts were injected in the GC/MS system, for recovery calculations. Real samples were not used for recovery tests. All the experiments were made in triplicate. The GC/MS analysis conditions are described in Table 1.
RESULTS
Figure 1 presents the Total Ion Current (TIC) chromatogram for the samples acid fraction. The identification of the numbered peaks is presented in the Table 2.
Twenty-three phenols were tentatively identified, as their trimethylsilyl derivatives; nine of then had their identities confirmed by co-injection of standards.
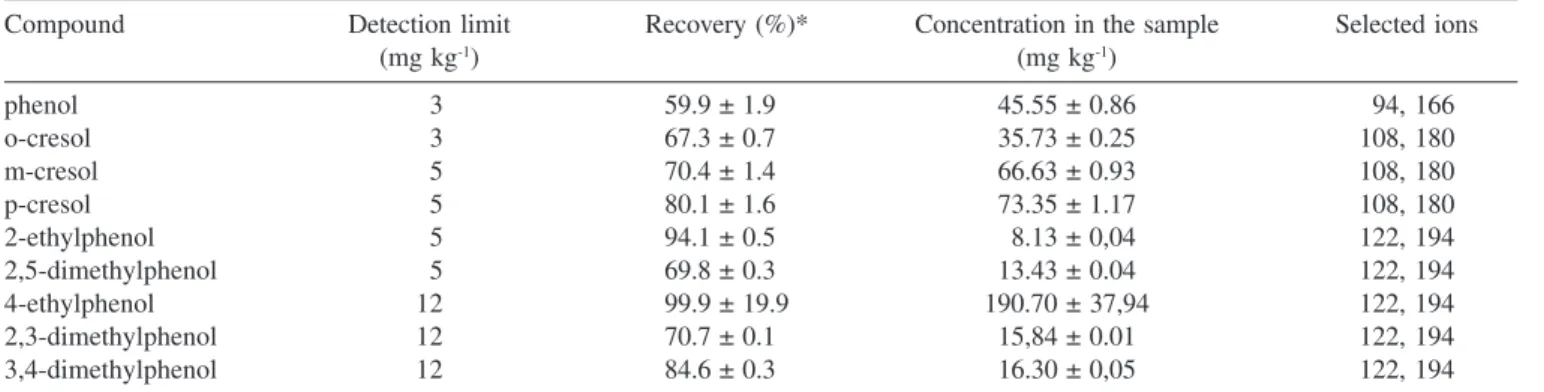
The recoveries of phenols ranged from 59.9% for phenol to 99.9 % for 4-ethylphenol, while the detection limit varied from 3 to 12
mg kg-1 (Table 3). The low recovery of phenol can be explained by its high volatility.
The amount of phenols in the samples varies from 8.13 mg kg-1 for 2-ethylphenol to 190.70 mg kg-1 for 4-ethylphenol (Table 3).
Table 1. GC/MSD analysis conditions
Parameter Condition
temperature program 70oC – 1 oC/min – 100 oC
Injection mode Splitless
Column head pressure 12 psi
Column HP-5 (30 m x 0.20 mm i.d. x 0.11 mm
film thickness)
Equipment GC/MS HP – 5988 A
Ionization mode Electronic impact at 70 eV
Carrier gas Helium
Flow rate 1mL/min
Table 3. Quantification results of phenolic compounds in the sample
Compound Detection limit Recovery (%)* Concentration in the sample Selected ions
(mg kg-1) (mg kg-1)
phenol 03 59.9 ± 1.90 45.55 ± 0.86 094, 166
o-cresol 03 67.3 ± 0.70 35.73 ± 0.25 108, 180
m-cresol 05 70.4 ± 1.40 66.63 ± 0.93 108, 180
p-cresol 05 80.1 ± 1.60 73.35 ± 1.17 108, 180
2-ethylphenol 05 94.1 ± 0.50 08.13 ± 0,04 122, 194
2,5-dimethylphenol 05 69.8 ± 0.30 13.43 ± 0.04 122, 194
4-ethylphenol 12 99.9 ± 19.9 190.70 ± 37,94 122, 194
2,3-dimethylphenol 12 70.7 ± 0.10 15,84 ± 0.01 122, 194
3,4-dimethylphenol 12 84.6 ± 0.30 16.30 ± 0,05 122, 194
* For the standard mixture at 100 mg L-1
Table 2. Identification of the numberedpeaks in the GC/MSD (SCAN mode) chromatogram
# Peak Compound Identification method
1 phenol MS, standard
2 o-cresol MS, standard
3 m-cresol MS, standard
4 p-cresol MS, standard
5 2-ethylphenol MS, standard
6 2,5-dimethylphenol MS, standard
7 2,6-dimethylphenol MS
8 4-ethylphenol MS, standard
9 2,3-dimethylphenol MS, standard
10 3,4-dimethylphenol MS, standard
11,12,13,14 C2-phenol MS
15,16 C3-phenol MS
17,18 C4-phenol MS
19 1-naftol MS
20 2-naftol MS
21,22,23 C1-naftol MS
195 Quantitative Analysis of Phenol and Alkylphenols in Brazilian Coal Tar
Vol. 27, No. 2
CONCLUSIONS
The results of the quantitative analysis demonstrate that the methodology adopted is simple and adequate for enrichment of phenolic compounds in this kind of sample.
The quantities of phenols compounds found in the samples justify their extraction for utilization as feedstock for the drug, paint, dye and other chemical industries, mainly with respect to phenol, the cresol isomers and 4-ethylphenol, that are the predominant phenols in the samples.
The extraction of these compounds from coal tar samples, in the future, will permit a decrease in feedstock material importation, resulting in a redution in manufactured product costs as well in environmental preservation.
ACKNOWLEDGMENT
The authors thank to Dr. M. Di Luccio for relevant suggestions and to CAPES, FAPERGS and CNPq for financial support.
REFERENCES
1. Oliveira, M. R. C.; Martins, J.; Quim. Nova2003, 26, 5. 2. Rossato, S. S.; Freire, R. S.; Duran, N.; Quim. Nova2001, 24, 77. 3. IPCS International Program of Chemical Safety- Environmental Health
Criteria 161, Phenol, published under the joint sponship of the United Nations Environment Program, The International Labor Organization, and The World Health Organization, Geneva, Switzerland, 1994.
4. Galceran, M. T.; Jáuregui, O.; Anal. Chim. Acta1995, 304, 75. 5. Buchholz,K. D.; Pawlliszyn,J.; Environ. Sci. Technol.1993, 27, 2844. 6. Heberer, T.; Stan, H. J.; Anal. Chim. Acta1997, 341, 21.
7. Helene, M. E. M.; Sobera, N. M. M.; Ciência e Cultura1979,31, 1243. 8. Rychnovsky, S. D.; Hoye, R. C.; J. Am. Chem. Soc.1994, 116, 1753. 9. Creaser, C. S.; Koupai-Abyasani, M. R.; Stephenson, R. G.; J. Chromatogr.
1989, 478, 415.
10. Freedman, R. W.; Croitoru, P. P.; Anal. Chem.1964,36, 1389.
11. Green, J. B.; Shirley,K. T. Y.; Vrana, R. P.; J. High Resolut. Chromatogr.
1989,478, 415.
12. Sweely, C. C.; Bentley, R.; Makita,M.; Wells, W. W.; J. Am. Chem. Soc.