Mangrove forests associated with salt flats: a case study from southeast
Brazil
No presente estudo, a variabilidade estrutural de uma
loresta de mangue associada a uma planície hipersalina
na Baía de Sepetiba (SE-Brasil) é analisada. A estrutura
vegetal e a salinidade da água intersticial foram medidas
em 32 parcelas estabelecidas ao longo de 3 transectos
localizados desde a margem do estuário até a transição
com a planície hipersalina. O desenvolvimento estrutural
foi altamente variável, com altura média variando entre
0,54 m e 7,96 m, diâmetro médio entre 1,58 cm e 9,46
cm e densidade de troncos entre 2.733 troncos vivos.ha
-1e 106.667 troncos vivos.ha
-1. A variabilidade da estrutura
vegetal respondeu ao gradiente de aumento da salinidade
da água intersticial à planície hipersalina, com a altura e
o diâmetro médios diminuindo e a densidade de troncos
aumentando no mesmo sentido. O seguinte padrão de
dominância de espécies foi observado:
Rhizophora mangle
nas proximidades da margem do estuário;
Laguncularia
racemosa
na transição com a planície hipersalina; e
Avicennia schauerianna
nas zonas intermediárias. O
entendimento das características estruturais das lorestas
de mangue e suas relações com estressores naturais (ex.
salinidade) contribuirá para a melhor compreensão da
dinâmica das espécies ao longo de planícies costeiras
associadas à planícies hipersalinas bem preservadas como
em Guaratiba.
A
bstrAct
Mario Luiz Gomes Soares
1*, Filipe de Oliveira Chaves
1, Gustavo Calderucio Duque Estrada
1,
Viviane Fernandez
21 Núcleo de Estudos em Manguezais, Faculdade de Oceanograia da UERJ
(R. São Francisco Xavier, 524, Maracanã, Rio de Janeiro - RJ, 20550-900)
2 Departamento de Análise Geoambiental da UFF
(Avenida Litorânea, s/n - Boa Viagem - Niterói RJ - 4° andar - CEP 24.030-346)
*Corresponding author: [email protected]
Descriptors:
Mangrove, Phytosociology, Salt Flats,
Ecological Gradients
In this study, forest structure variability of a
mangro-ve associated to a salt lat in Sepetiba Bay
(SE-Bra-zil) was assessed. Forest structure and interstitial
water salinity were measured in 32 plots established
along three transects ranging from the margin of the
estuary to the transition with the salt lat.
Structu-ral development was shown to be highly variable,
with mean height ranging from 0.54 m to 7.96 m,
mean diameter ranging from 1.58 cm to 9.46 cm and
trunk density ranging from 2,733 live trunks.ha
-1to
106,667 live trunks.ha
-1. Forest structure
variabili-ty responded to the gradient of increasing
intersti-tial water salinity towards the salt lat, with mean
height and diameter decreasing and trunks density
increasing progressively in the same direction. The
following pattern of species dominance was
obser-ved:
Rhizophora mangle near the estuary margin;
Laguncularia racemosa at the transition with the
salt lat; and Avicennia schaueriana on intermediate
zones. The assessment of structural characteristics
of mangrove forests and their relationships with
na-tural stressors (e.g., salinity) contribute to better
un-derstand the dynamics of the species along coastal
plains associated with preserved salt lats, such as
the one found in Guaratiba.
r
esumo
Descritores:
Manguezal, Fitossociologia, Planícies
hipersalinas, Gradientes ecológicos.
http://dx.doi.org/10.1590/S1679-87592017083006502
INTRODUCTION
Mangroves are coastal ecosystems located in intertidal zones of tropical and subtropical regions around the world. According to WALSH (1974), mangroves occur and are more developed in sites where the average minimum temperature of the coldest month of the year is higher than 20°C and the annual temperature range is lower than 5°C. They typically occur on muddy substrates protected from wave action and subjected to large tidal amplitudes.
Although these factors generally control the occurrence of mangroves worldwide, the structural and functional characteristics of each mangrove forest are regulated by an interaction of factors that act at the regional scale (“the energy signature”), as described by SCHAEFFER-NOVELLI et al. (1990) and TWILLEY (1995), and the local scale (e.g., factors associated with the frequency of tidal looding) (SOARES et al., 2003). SOARES et al. (2003) further observed that the structure of mangroves relects an overlay of characteristics associated with disturbances, namely: (1) type (chronic or acute); (2) spatial variability; (3) variable action over time; (4) variable frequency (recurrence); and (5) the system’s capacity to recover after disturbances. OLIVER; LARSON (1990), HUSTON (1996), and FRELICH (2002) have described the mosaic pattern of several plant communities. SMITH (1992), SOARES (1999), SOARES et al. (2003), and BERGER et al. (2008) addressed this mosaic structure more speciically for mangrove forests.
Because mangroves occur in intertidal zones, soil salinity is a key environmental factor controlling the structure, function and distribution of this ecosystem. Mangrove species are generally adapted to survive under high salinity conditions (WALSH, 1974; LUGO; SNEDAKER, 1974; CHAPMAN, 1976). CINTRON et al. (1978) have proposed the upper limit of tolerance for mangrove species as being 2.5 times higher than the average salinity of sea water (35), a level that would allow plants to extract fresh water from saline water.
Although mangrove species have morphological and physiological adaptations for occurring in saline soils, growth and survivorship decline with increasing salinity. BALL (1980) have shown that salinity acts on the inter- and intraspeciic competitive abilities of mangrove species and that salt stress limits growth and reproduction of plants. Extremely high salt concentrations in tropical salt lats are responsible for the absence of macrophytes (RIDD; SAM, 1996).
Some studies have characterized the structure of mangrove forests in the state of Rio de Janeiro (Southeast Brazil), such as Paraíba do Sul River (BERNINI; REZENDE, 2004), Guanabara Bay (SOARES et al., 2003; CAVALCANTI et al., 2009), Tijuca Lagoon (SOARES, 1999) and Sepetiba Bay (SILVA et al., 1991; ESTRADA et al., 2013), but adequate characterization of mangroves in some key regions is still lacking. This is the case of Guaratiba (located in Sepetiba Bay), one of the most important remnants of this ecosystem in the state of Rio de Janeiro. The same is true for mangrove forests associated with salt lats throughout the Brazilian coast.
To ill this gap, a case study from a well-preserved mangrove located in Sepetiba Bay is presented, describing the structural variability and its relationship with environmental gradients and, more speciically, the relationship between low structural development with environmental severity at the transition zone between the mangrove forest and the salt lat. Three hypotheses were deined in order to meet this objective: 1) Structural development of the mangrove forest decreases as the environmental severity towards the salt lat increases; 2) Relative dominance of species change in response to the increase in environmental severity; 3) Space is not optimally occupied in sites with extreme environmental severity for mangrove species.
MATERIAL AND METHODS
Study Area
The study area is located at the Sepetiba/Guaratiba coastal plain, on the west side of the city of Rio de Janeiro, SE-Brazil. According to Köppen’s classiication, the climate in this region’s coastal plain is Aw – tropical, hot and humid, with dry winters – and in its adjacent mountain slopes is Af, tropical, hot and humid, without dry seasons. The annual mean temperature is 23.5° C and the annual mean rainfall reaches 1,067 mm (ESTRADA et al., 2008). January and March are the wettest months and June and August the driest. The potential evapotranspiration in the region is higher from February to April and lower from June to September. The region is characterized by a micro-tidal regime. Groundwater from the Guaratiba Aquifer lows at shallow depths (1.5 m) from the adjacent higher lands to the coastal plain, reaching the estuarine system (VICENTE et al., 2010).
Guaratiba Mountain. They integrate a system of islands, rivers and channels that constitute the Guaratiba Biological Reserve (Figure 1A, B). Three typical mangrove species occur on the site: Avicennia schaueriana Stapf & Leechm. ex Moldenke, Laguncularia racemosa (L.) C.F. Gaertn.,
and Rhizophora mangle L. The most inner parts of the
intertidal zone are only reached by spring tides, leading to the formation of salt lats: high-intertidal sites occurring in arid or seasonally dry regions (evapotranspiration higher than precipitation) and subjected to low tidal looding, driving hypersaline conditions in the soil (HUTCHINGS; SAENGER, 1987). There is a continuum of features in Guaratiba that belong to the mangrove ecosystem, as described by HUTCHINGS; SAENGER (1987): (a) mud lats in the zones below mean sea level; (b) mangrove forests in the zones above mean sea level and below the highest neap tides level; and (c) salt lats, located in areas above the zone reached by the highest neap tides and up to the average high spring tides level. The mangrove forests of Guaratiba occupy an area of 20.9 km2 and the
salt lats 7.4 km2. Previous studies describing the forest
structure of the Guaratiba mangroves were undertaken by DANSEREAU (1947) and ESTRADA et al. (2013). The former was strictly descriptive and only provided general distribution diagrams of mangrove species, while the later analyzed the structural properties in order to test suitability of the concept of physiographic types.
Sampling Design
The present study was developed in the mangroves occurring in the Piracão River, one of the three rivers that low onto the Guaratiba coastal plain (Figure 1A, B). In the middle stretch of this river, 32 plots were established. They were positioned along three transects (A, B, and C), from the margin of the river to the interface between the mangrove forest and the salt lat. Plots inside the transects were distributed as follows: 8 at transect A, 10 at B e 14 at C.
CINTRON; SCHAEFFER-NOVELLI (1984) pro-vided a general overview of the method used to charac-terize the structure of mangrove forests. To sample a re-presentative number of individuals (trees), plots ranging from 15 to 150 m2, depending on the forest density, were
delimited at each sampling site. In addition, homogenei-ty of structural characteristics (species composition and structural development of individuals) was also taken into consideration. At each plot, all individuals were identiied to the species level, had their height and trunk diameter
measured, and were classiied according to the condition of their trunks (live or dead). Trunk diameter was mea-sured at 1.30 m from the ground and denoted by D130 (BROKAW; THOMPSON, 2000). However, in plot A7, located at the transition zone between the forest and the salt lat, the trees were shorter and shrubby, and hence the diameter was measured at the trunk base.
Once ield data had been collected, mean height, mean
D130, basal area, relative basal area dominance and density
of trunks were calculated. Basal area (g, in m2.ha-1) was
calculated by the formula g = 0.00007854*(D130)². Mean
D130 represents the diameter (in cm) of the tree with the
mean basal area. Note that this parameter difers from the arithmetic mean of D130’s. Mean D130was calculated by applying live basal area data to the formula:
= [(g)*12732.39/n]1/2, where n = the number of trunks per
hectare and g = basal area.
Using the Statistica 6.0® package, a cluster analysis (UPGMA) was applied to the data to analyze the relationships between the structural parameters of forests and the position along the tidal gradient. The parameters adopted for these analyses were mean D130and
the mean height. A second cluster was run using the relative contribution (%) of each species’ live basal area. A regression analysis was run to assess the relationship between trunk density and mean height.
Based on the position of each plot along the transects and on a micro-topographic assessment previously presented by ESTRADA et al. (2013) for the mangroves of Guaratiba, the sampling plots were classiied in terms of physiographic types, using the approach proposed by the same authors: fringe forests (sites at the low intertidal zone, with high tidal looding frequency); basin forests (sites at the intermediate intertidal zone, with intermediate tidal looding frequency); and transition forests (sites at the transition of the forest and the salt lat, at the high intertidal zone and presenting very low tidal looding frequency). Plots grouped as physiographic types were compared for trunk density, mean height and mean D130 using ANOVA and Tukey post-hoc test (p < 0.05).
refractometer model A366ATC (American Optical), with maximum range of 160 and accuracy of 1 unit.
Diferences in the salinity of interstitial water between the eight sites were assessed by the Kruskal-Wallis test.
RESULTS
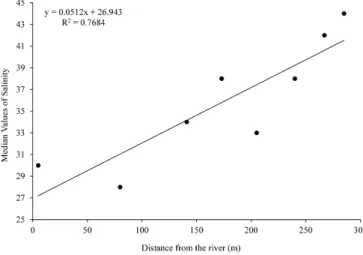
Mean salinity ranged from 28 at point two to 44 at point eight. There were signiicant diferences in interstitial salinity among sites (KW = 280.35; p < 0.01). Salinity of the interstitial water increased landward and was correlated with the distance from the river (p < 0.05; R2
= 0.768; Figure 2). In the present study, points one to six were regularly looded by neap tides and points seven and eight were looded only during spring tides. The duration of looding was greater at sites closer to the river. Higher
salinity at point eight is probably due to the combined efect of lower frequency of tidal looding and evaporation of standing water. On the other hand, lower salinity at point two is explained by higher frequency of tidal looding.
The distribution of mangrove species along the transects reveals a pattern of zonation, inferred from the relative contribution of each species to the basal area (Tables 1, 2, and 3). This pattern is characterized by a general tendency toward dominance of R. mangle near the margin of the Piracão River, A. schaueriana between the margin and the salt lat, and L. racemosa closer to the salt lat. However, some exceptions to this pattern occurred in transect A, such as the co-dominance of A. schaueriana
and R. mangle at plot one, and the dominance of A. schaueriana at plot eight.
Figure 2. Regression analysis relating interstitial water salinity and distance from Piracão River.
The structural development of the three transects showed high variability. Mean height ranged from 0.54 ± 0.46 to 7.96 ± 1.73 m and mean D130 from 1.58 to 9.46 cm (Tables 1, 2, and 3). Trunk density also relected this high variability, ranging from 2,733 to 106,667 live trunks.ha-1.
When each transect is analyzed individually, a tendency of decreasing structural development is evident from the margin of the Piracão River to the transition zone, at the interface between the mangrove forest and the salt lat. Hence, as mean height and D130decrease, trunk density increases progressively (Tables 1, 2, and 3).
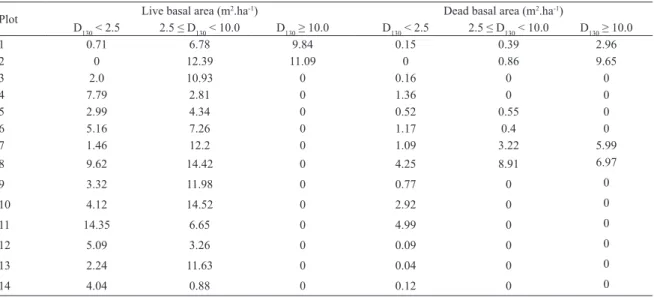
The tendency of structural development decrease towards the transition zone was also conirmed by changes in basal area. The distribution of basal area by D130 classes (Tables 4, 5, and 6) revealed that trunks above 10 cm are concentrated at sites closer to the river and are replaced by intermediate and smaller classes toward the transition zone.
The regression between trunk density and mean height for these forests showed an inverse relationship (Figure 3A; R2 = 0.69; p < 0.05). It means that density
decreases and size increases as forest development takes place. However, there was also a group of plots with low mean height (0.54 ± 0.46 to 1.58 ± 0.98 m) and low trunk density (12,667 to 45,714 live trunks.ha-1): A5, A6, A7,
A8, B10, C12, C13, and C14. These plots are located at the transition with the salt lat. When these plots were excluded from the analysis, this relationship became even stronger (Figure 3B; R2 = 0.81; p < 0.05).
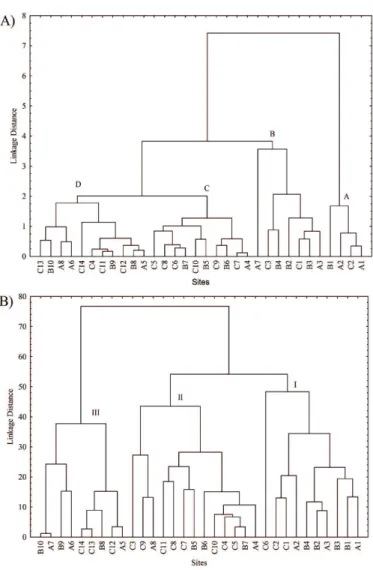
A cluster analysis considering mean D130 and height revealed four groups (Figure 4A). Group (A) represents
sampling sites located close to the margin of the Piracão River, where tidal looding frequency is higher. These sites showed higher structural development, mean
D130above 7.0 cm, and mean height above 7.0 m. These
sites are dominated by R. mangle, with a considerable contribution of A. schaueriana and the presence of few L. racemosa individuals (Tables 1, 2, and 3). Group (B) represents sampling sites near the Piracão River, with
D130between 4.5 and 7.0 cm and a mean height lower
than 7.0 m. Hence, plots in Group (B) show intermediate structural development. These forests are dominated by A. schaueriana but have considerable contribution of R. mangle (Tables 1, 2, and 3). Groups (C) and (D) represent forests with lower structural development, with mean D130 lower than 4.5 cm (Tables 1, 2, and 3). Plots in Group (C) are located at intermediate distance between the Piracão River and the salt lat. Although they present low mean
D130, mean height is above 2.0 m, as opposed to plots
in Group (D), located closer to the salt lat, where mean height is below 2.0 m (Tables 1, 2, and 3). Both groups are dominated by L. racemosa and/or A. schaueriana. However, Group (C) shows the occurrence of few R. mangle trees in some plots. As presented earlier by the
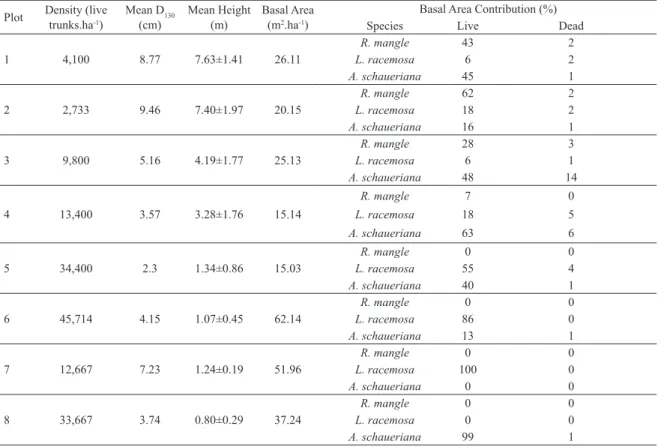
Table 1. Structural parameters of transect A.
Plot Density (live trunks.ha-1) Mean D(cm)130 Mean Height (m) Basal Area (m2.ha-1)
Basal Area Contribution (%)
Species Live Dead
1 4,100 8.77 7.63±1.41 26.11
R. mangle 43 2
L. racemosa 6 2
A. schaueriana 45 1
2 2,733 9.46 7.40±1.97 20.15
R. mangle 62 2
L. racemosa 18 2
A. schaueriana 16 1
3 9,800 5.16 4.19±1.77 25.13
R. mangle 28 3
L. racemosa 6 1
A. schaueriana 48 14
4 13,400 3.57 3.28±1.76 15.14
R. mangle 7 0
L. racemosa 18 5
A. schaueriana 63 6
5 34,400 2.3 1.34±0.86 15.03
R. mangle 0 0
L. racemosa 55 4
A. schaueriana 40 1
6 45,714 4.15 1.07±0.45 62.14
R. mangle 0 0
L. racemosa 86 0
A. schaueriana 13 1
7 12,667 7.23 1.24±0.19 51.96
R. mangle 0 0
L. racemosa 100 0
A. schaueriana 0 0
8 33,667 3.74 0.80±0.29 37.24
R. mangle 0 0
L. racemosa 0 0
A. schaueriana 99 1
Cluster analysis considering species contribution to live basal area (Figure 4B) followed the same general pattern obtained in the structural development analysis. Group (I) includes plots with more than 20% of R. mangle. These plots are all included in Groups (A) and (B). Group (II) constitutes forests dominated by A. schaueriana and
is almost identical to Group (C). Finally, Group (III) is characterized by forests with contribution of L. racemosa higher than 55%, no R. mangle individuals, and is
equivalent to Group (D).
Considering the criteria described in the methods section, plots were grouped as physiographic types as follows: Fringe forests –A1, A2, B1, B2, B3, C1 and C2; Basin Forests – A3, A4, B4, B5, C3, C4, C5, C6, C7, C8, C9 and C10; Transition Forests – A5, A6, A7, A8, B6, B7, B8, B9, B10, C11, C12, C13 and C14. The results conirm signiicant diferences for all the parameters: Trunk density (F = 44.98; p < 0.01); Mean D130 (F = 313.85; p < 0.01); and Mean height (F = 499.58; p < 0.01).Tukey test conirmed signiicant diferences between fringe and transition forests for all parameters. However, this was the only signiicant diference for trunk density (p = 0.001), while for mean D130 only basin versus transition had no
diference (p < 0.721). Mean height was signiicantly diferent in all cases (p < 0.01).
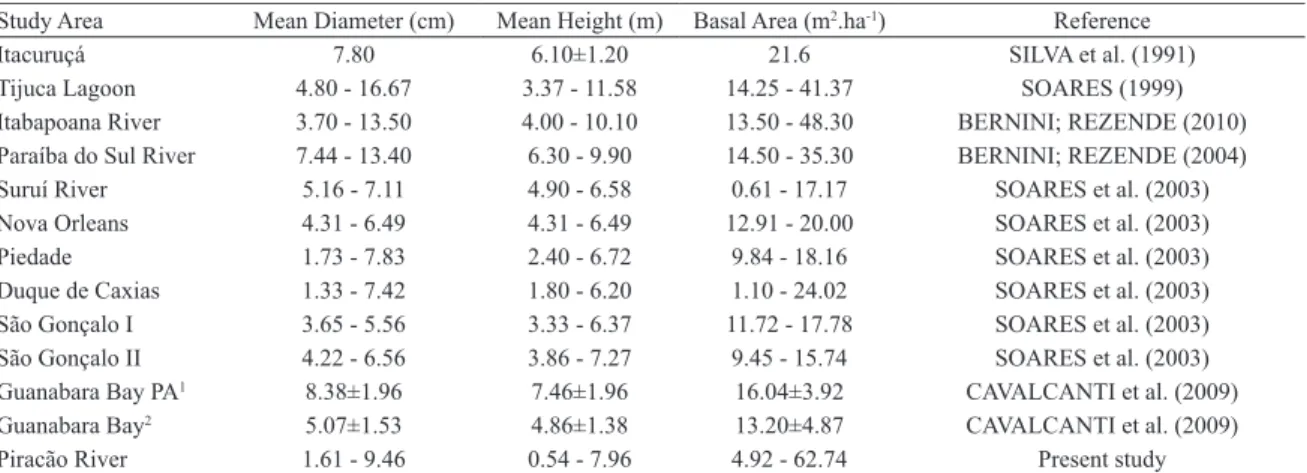
Table 7 compares the results of the present study to the ones presented previously to other mangroves from the state of Rio de Janeiro, which are located in a narrow latitudinal range, between 21°18’ and 23°23’S, and in the same coastal segment (Schaefer-Novelli et al., 2000). In terms of mean D130and height, mangrove forests in the Piracão River vary from low to intermediate structural development compared to other mangroves in the state. Basal area is within range found for other forests in this regions. The exceptions are sampling plots 6 and 7 of transect A and plot 8 of transect C, where basal area is much larger.
DISCUSSION
The pattern of species distribution observed in Guaratiba is typical of mangrove forests located in south and southeast Brazil (SCHAEFFER-NOVELLI et
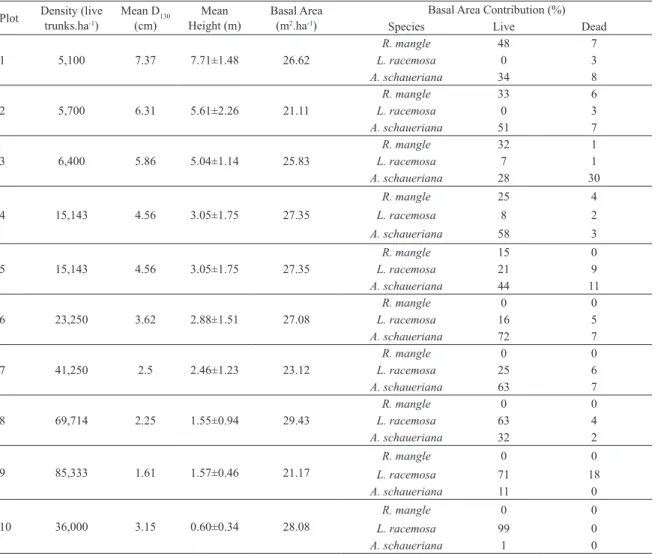
Table 2. Structural parameters of transect B.
Plot Density (live trunks.ha-1) Mean D(cm)130 Height (m)Mean Basal Area (m2.ha-1)
Basal Area Contribution (%)
Species Live Dead
1 5,100 7.37 7.71±1.48 26.62
R. mangle 48 7
L. racemosa 0 3
A. schaueriana 34 8
2 5,700 6.31 5.61±2.26 21.11
R. mangle 33 6
L. racemosa 0 3
A. schaueriana 51 7
3 6,400 5.86 5.04±1.14 25.83
R. mangle 32 1
L. racemosa 7 1
A. schaueriana 28 30
4 15,143 4.56 3.05±1.75 27.35
R. mangle 25 4
L. racemosa 8 2
A. schaueriana 58 3
5 15,143 4.56 3.05±1.75 27.35
R. mangle 15 0
L. racemosa 21 9
A. schaueriana 44 11
6 23,250 3.62 2.88±1.51 27.08
R. mangle 0 0
L. racemosa 16 5
A. schaueriana 72 7
7 41,250 2.5 2.46±1.23 23.12
R. mangle 0 0
L. racemosa 25 6
A. schaueriana 63 7
8 69,714 2.25 1.55±0.94 29.43
R. mangle 0 0
L. racemosa 63 4
A. schaueriana 32 2
9 85,333 1.61 1.57±0.46 21.17
R. mangle 0 0
L. racemosa 71 18
A. schaueriana 11 0
10 36,000 3.15 0.60±0.34 28.08
R. mangle 0 0
L. racemosa 99 0
A. schaueriana 1 0
racemosa, and A. germinans occur, and by
SCHAEFFER-NOVELLI et al. (1990), and SANTOS et al. (1997) for regions where mangrove forests are associated with salt lats. According to JIMENEZ; SAUTER (1991), the high salinity levels found in the most inner sites of the mangrove forests they have studied constrain the development of Rhizophora racemosa, in contrast to Avicennia bicolor which tolerates higher salinities. A similar relationship has been described by LARA; COHEN (2006) and PIOU et al. (2006) for Rhizophora mangle and Avicennia germinans.
The interstitial salinity increases with increasing distance from the river, contradicting the pattern reported previously by JOSHI; GHOSE (2003). The initial low salinities can be explained by the higher frequency and duration of tidal looding after point one. Low frequency and duration of tidal looding, in a seasonally dry climate such as in the Guaratiba region, are probably the driving factors for the observed high salinity in the landward
areas of the intertidal zone. This pattern is responsible for the formation and maintenance of salt lats associated with mangrove forests, as previously described by HUTCHINGS; SAENGER (1987). Results of the direct-gradient analysis show that diferent mangrove species have diferent distributions along the salinity gradient. A.schaueriana and L. racemosa are found in wide ranges
of soil salinity, whereas R. mangle is restricted to lower salinity levels.
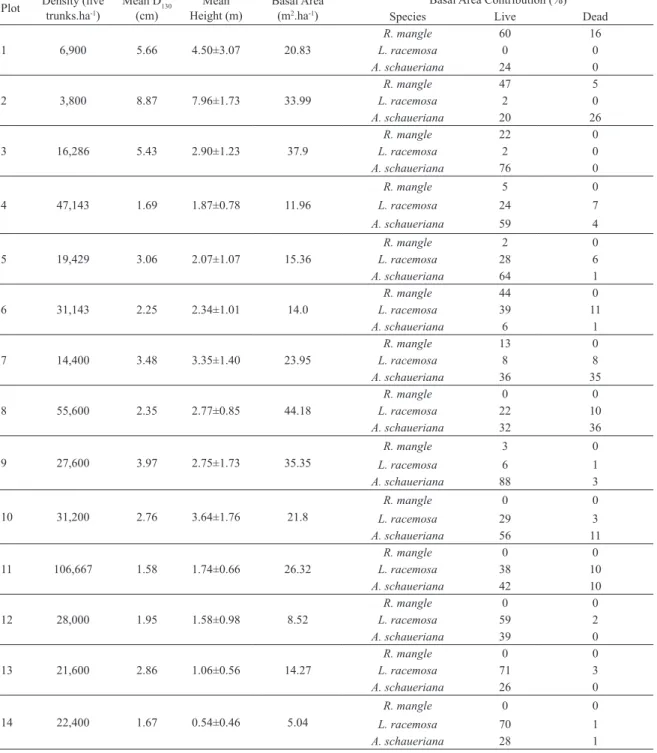
Table 3. Structural parameters of transect C.
Plot Density (live trunks.ha-1) Mean D(cm)130 Height (m)Mean Basal Area (m2.ha-1)
Basal Area Contribution (%)
Species Live Dead
1 6,900 5.66 4.50±3.07 20.83
R. mangle 60 16
L. racemosa 0 0
A. schaueriana 24 0
2 3,800 8.87 7.96±1.73 33.99
R. mangle 47 5
L. racemosa 2 0
A. schaueriana 20 26
3 16,286 5.43 2.90±1.23 37.9
R. mangle 22 0
L. racemosa 2 0
A. schaueriana 76 0
4 47,143 1.69 1.87±0.78 11.96
R. mangle 5 0
L. racemosa 24 7
A. schaueriana 59 4
5 19,429 3.06 2.07±1.07 15.36
R. mangle 2 0
L. racemosa 28 6
A. schaueriana 64 1
6 31,143 2.25 2.34±1.01 14.0
R. mangle 44 0
L. racemosa 39 11
A. schaueriana 6 1
7 14,400 3.48 3.35±1.40 23.95
R. mangle 13 0
L. racemosa 8 8
A. schaueriana 36 35
8 55,600 2.35 2.77±0.85 44.18
R. mangle 0 0
L. racemosa 22 10
A. schaueriana 32 36
9 27,600 3.97 2.75±1.73 35.35
R. mangle 3 0
L. racemosa 6 1
A. schaueriana 88 3
10 31,200 2.76 3.64±1.76 21.8
R. mangle 0 0
L. racemosa 29 3
A. schaueriana 56 11
11 106,667 1.58 1.74±0.66 26.32
R. mangle 0 0
L. racemosa 38 10
A. schaueriana 42 10
12 28,000 1.95 1.58±0.98 8.52
R. mangle 0 0
L. racemosa 59 2
A. schaueriana 39 0
13 21,600 2.86 1.06±0.56 14.27
R. mangle 0 0
L. racemosa 71 3
A. schaueriana 26 0
14 22,400 1.67 0.54±0.46 5.04
R. mangle 0 0
L. racemosa 70 1
A. schaueriana 28 1
al., 1998; FELLER et al., 2003; LOVELOCK et al., 2007), which and are also regulated by tidal looding.
The progressive decrease of structural development towards the transition zone between the forest and the salt lat observed in Guaratiba has also been reported previously for other dry or seasonally dry regions (BALL, 1980; SCHAEFFER-NOVELLI et al., 1990;
CINTRON-MOLERO, 1993; SANTOS et al., 1997). However, such a structural decrease may also occur where the mangrove forest is associated with a terrestrial ecosystem (DAHDOUGH-GUEBAS, 2004; LARA-DOMÍNGUEZ et al., 2005; KRAUSS et al., 2006).
Table 4. Basal area, live and dead, by D130 class (cm) on transect A.
Plot Live basal area (m2.ha-1) Dead basal area (m2.ha-1)
D130 < 2.5 2.5 ≤ D130 < 10.0 D130 ≥ 10.0 D130 < 2.5 2.5 ≤ D130 < 10.0 D130 ≥ 10.0
1 0 9.86 14.88 0 1.37 0
2 0.05 6.46 12.72 0.04 0.88 0
3 0.75 9.77 9.98 0.39 1.58 2.65
4 1.57 8.23 3.65 0.72 0.98 0
5 4.76 8.58 0.95 0.48 0.26 0
6 4.23 57.5 0 0.17 0.23 0
7 0 51.96 0 0 0 0
8 3.6 26.27 7.13 0 0.24 0
Table 5. Basal area. live and dead. by D130 classes (cm) at transect B.
Plot Live basal area (m2.ha-1) Dead basal area (m2.ha-1)
D130 < 2.5 2.5 ≤ D130 < 10.0 D130 ≥ 10.0 D130 < 2.5 2.5 ≤ D130 < 10.0 D130 ≥ 10.0
1 0 13.76 7.98 0 3.04 1.84
2 0.32 8.86 8.61 0.12 3.19 0
3 0.12 10.17 6.97 0.15 1.16 7.26
4 2.02 10.37 12.37 0.75 1.84 0
5 2.8 8.78 0 1.64 1.16 0
6 3.49 10.18 10.28 1.5 1.62 0
7 6.17 11.44 2.64 2.03 0.83 0
8 9.98 17.79 0 1.52 0.15 0
9 14.09 3.32 0 3.37 0.38 0
10 1.58 26.51 0 0 0 0
Table 6. Basal area. live and dead. by D130 class (cm) on transect C.
Plot Live basal area (m2.ha-1) Dead basal area (m2.ha-1)
D130 < 2.5 2.5 ≤ D130 < 10.0 D130 ≥ 10.0 D130 < 2.5 2.5 ≤ D130 < 10.0 D130 ≥ 10.0
1 0.71 6.78 9.84 0.15 0.39 2.96
2 0 12.39 11.09 0 0.86 9.65
3 2.0 10.93 0 0.16 0 0
4 7.79 2.81 0 1.36 0 0
5 2.99 4.34 0 0.52 0.55 0
6 5.16 7.26 0 1.17 0.4 0
7 1.46 12.2 0 1.09 3.22 5.99
8 9.62 14.42 0 4.25 8.91 6.97
9 3.32 11.98 0 0.77 0 0
10 4.12 14.52 0 2.92 0 0
11 14.35 6.65 0 4.99 0 0
12 5.09 3.26 0 0.09 0 0
13 2.24 11.63 0 0.04 0 0
14 4.04 0.88 0 0.12 0 0
frequency (KRAUSS et al., 2008), leading to gradients of salinity (SAM; RIDD, 1998; ELLISON et al., 2000), nutrients concentration and availability (NICKERSON; THIBODEAU, 1985; EWEL et al., 1998) and concentration of H2S (FELLER et al., 2003; LOVELOCK et al., 2007).
As a result, the space tends to be sparsely occupied by
Figure 3. Regression analysis relating density and mean height (A) including all plots studied and (B) excluding plots located at the transition between mangrove forests and the salt lat (A5, A6, A7, A8, B10, C12, C13 and C14).
that in ecosystems under stress, organisms become smaller in size and resource utilization becomes less eicient, such as the case of space in the present study.
The occurrence of a zone with reduced mean height and trunk density at the transition between mangroves and salt lats has been reported by SOARES et al. (2008) in NE-Brazil, where only individuals of A. schaueriana were found and had a dead basal area of 45%. Landward from this zone, 99% of the individuals were dead. GORDON (1993) has previously shown that shrub-like forests, characterized by low structural development and density, occur at transition zones between mangroves and salt lats. These indings have been reinforced by MEDINA et
al. (2001) as well, who have described the occurrence of shrub-like, sparse forests of A. germinansin sites where salinity levels were higher than 60.
BALL (1980) observed that zones with low tidal looding frequency are subjected to extreme conditions, such as substrate dehydration and wide variability
in salinity levels, as opposed to areas with high tidal frequency, and more stable environmental conditions. Discussing the same topic, JIMENEZ (1990) showed that high rates of mortality of low-size classes associated with environmental severity (water stress) leads to low density of trees.
Figure 4. Cluster analysis (UPGMA) of sites studied (A) considering mean D130 and
mean height and (B) considering live basal area contribution (%) of each species.
but also low height and basal area, exactly as plots A5, A6, A7, A8, B10, C12, C13 and C14, at the transition zone, do. As described earlier, by excluding these plots from the analysis, the efects of maturation of the selected forests could be demonstrated without the “noise” from the variability inserted by stress (Figure 3B; R2 = 0.87; p
< 0.05).
With some few exceptions, plots classiied as fringe forests were deined as Groups A and B in the cluster analysis, while plots classiied as basin and transition forests were deined as Groups C and D, respectively. This pattern highlights the relationship between structural development and tidal looding frequency, which is in agreement with the indings of previous studies, such as CINTRON et al. (1978); SCHAEFFER-NOVELLI et al. (1990); JIMENEZ; SAUTER (1991); EWEL et al. (1998);
FELLER et al. (2003); DAHDOUH-GUEBAS et al. (2004); LARA-DOMÍNGUEZ et al. (2005); KRAUSS et al. (2006); LARA; COHEN (2006) and ESTRADA et al. (2013). The mangrove forests of Guaratiba, located in a protected area (Biological Reserve of Guaratiba), undergo little human interference. Consequently, the low structural development found at some sites relects the inluence of natural factors associated with environmental severity caused by low frequency of tidal looding at the interface between mangrove forests and the salt lat. In contrast, mangrove forests with low structural development in the Guanabara Bay (Table 7), for example, are under strong human pressure (SOARES et al., 2003; CAVALCANTI et al., 2009).
Table 7. Structural parameters for other mangrove forests in Rio de Janeiro state, between 21°18’ and 23°23’S. Study Area Mean Diameter (cm) Mean Height (m) Basal Area (m2.ha-1) Reference
Itacuruçá 7.80 6.10±1.20 21.6 SILVA et al. (1991)
Tijuca Lagoon 4.80 - 16.67 3.37 - 11.58 14.25 - 41.37 SOARES (1999)
Itabapoana River 3.70 - 13.50 4.00 - 10.10 13.50 - 48.30 BERNINI; REZENDE (2010) Paraíba do Sul River 7.44 - 13.40 6.30 - 9.90 14.50 - 35.30 BERNINI; REZENDE (2004)
Suruí River 5.16 - 7.11 4.90 - 6.58 0.61 - 17.17 SOARES et al. (2003)
Nova Orleans 4.31 - 6.49 4.31 - 6.49 12.91 - 20.00 SOARES et al. (2003)
Piedade 1.73 - 7.83 2.40 - 6.72 9.84 - 18.16 SOARES et al. (2003)
Duque de Caxias 1.33 - 7.42 1.80 - 6.20 1.10 - 24.02 SOARES et al. (2003) São Gonçalo I 3.65 - 5.56 3.33 - 6.37 11.72 - 17.78 SOARES et al. (2003) São Gonçalo II 4.22 - 6.56 3.86 - 7.27 9.45 - 15.74 SOARES et al. (2003) Guanabara Bay PA1 8.38±1.96 7.46±1.96 16.04±3.92 CAVALCANTI et al. (2009)
Guanabara Bay2 5.07±1.53 4.86±1.38 13.20±4.87 CAVALCANTI et al. (2009)
Piracão River 1.61 - 9.46 0.54 - 7.96 4.92 - 62.74 Present study
Footnotes: 1. Parameters calculated from 43 plots located in two Protected Areas; 2. Parameters calculated from 30 plots.
their live basal areas relect the degree of conservation. Forests in degraded areas, such as those described by SOARES et
al. (2003) for Guanabara Bay, contain less than 20.0 m2.ha-1
of basal area. On the other hand, 72% of the forests studied in Guaratiba have more than 20.0 m2.ha-1 of basal area, and
about 22% of them have more than 30.0 m2.ha-1.
In summary, the analysis of the forest structure in the selected region allowed us to describe the structural variability of a mangrove forest associated to a gradient of tidal looding frequency. Along this gradient, soil environmental severity increases and reaches maximum levels in the salt lat, where no mangrove plant occur. On one end of this gradient, the forest is well developed and dominated by R. mangle; whereas on the other end the forest is characterized by low structural development and dominated by A. schaueriana
and L. racemosa. This pattern is similar to other mangroves
from dry or seasonally dry regions where a gradient of tidal frequency toward the transition zone is observed. Low structure development found at the transition between the forest and the salt lat is probably determined by natural stressors, such as hypersalinity, nutrient depletion, and high H2S concentration. These stressors are associated with low
tidal frequency, and must not be confused with anthropogenic disturbances that lead to similar structural characteristics.
ACKNOWLEDGEMENTS
The authors thank Fundação Carlos Chagas Filho de Amparo à Pesquisa do Estado do Rio de Janeiro (FAPERJ), for the inancial support, Empresa Brasileira de Pesquisa Agropecuária (Embrapa), for the logistical support, and Instituto Estadual do Ambiente (INEA-RJ) for granting the authorization to conduct the ield sampling.
REFERENCES
ARREOLA-LIZÁRRAGA, J. A.; FLORES-VERDUGO, F. J.; ORTEGA-RUBIO, A. Structure and litterfall of an arid man-grove stand on the Gulf of California, Mexico. Aquat. Bot., v.
79, n. 2, p. 137-143, 2004.
BALL, M. C. Patterns of secondary succession in a mangrove forest of southern Florida. Oecologia, v. 44, n. 2, p. 226-235, 1980.
BERGER, U.; RIVERA-MONROY, V. H.; DOYLE, T. W.; DAHDOUH-GUEBAS, F.; DUKE, N. C.; FONTALVO--HERAZO, M. L.; HILDENBRANDT, H.; KOEDAM, N.; MEHLIG, U.; PIOU, C.; TWILLEY, R. R. Advances and li-mitations of individual-based models to analyze and predict dynamics of mangrove forests: A review. Aquat. Bot., v. 89,
n. 2, p. 260-274, 2008.
BERNINI, E.; REZENDE, C. E. Vegetation structure of the man-grove forest at the estuary Paraíba do Sul river, Rio de Janei-ro, Brazil. Acta Bot. Bras., v. 18, n. 3, p. 491-502, 2004.
BERNINI, E.; REZENDE, C. E. Structural variation in mangrove forests of the estuary of the River Itabapoana, ES-RJ. Biote-mas, v. 23, n. 1, p. 49-60, 2010.
BROKAW, N.; THOMPSON, J. The H for DBH. For. Ecol. Ma-nage., v. 129, n. 1/3, p. 89-91, 2000.
CAVALCANTI, V. F.; SOARES, M. L. G.; ESTRADA, G. C. D.; CHAVES, F. O. Evaluating mangrove conservation through the analysis of Forest structure data. J. Coast. Res., v. 56, p.
390-394, 2009.
CHAPMAN, V.J. Mangrove biogeography. In: WALSH, G.E; SNEDAKER, S. C.; TEAS, H.J. (Eds.). International sym-posium on biology and management of mangroves. Honolulu,
Hawaii. p. 3-22, 1976.
CINTRON, G.; LUGO, A. E.; POOL, D. J.; MORRIS, G. Man-groves of arid environments in Puerto Rico and adjacent is-lands. Biotropica, v. 10, n. 2, p. 110-121, 1978.
CINTRON, G.; SCHAEFFER-NOVELLI, Y. Methods for stu-dying mangrove structure. In: SNEDAKER, S. C.; SNE-DAKER, J. G. (Eds.). The mangrove ecosystem: Research
Methods.Bungay: UNESCO, 1984. 251 p.
DAHDOUGH-GUEBAS, F.; DE BONDT, R.; ABEYSINGHE, P. D. Comparative study of the disjunct zonation pattern of the grey mangrove Avicennia marina (forsk.) vierh. in Gazi Bay
(Kenya). Bull. Mar. Sci., v. 74, n. 2, p. 237-252, 2004.
DANSEREAU, P. Zonation et succession sur la restinga de Rio de Janeiro. - I. Halosère. Rev. Can. Montr., v. 6, n. 3, p.
448-477, 1947.
ELLISON, A. M.; MUKHERJEE, B. B.; KARIM, A. Testing patterns of zonation in mangroves: scale dependence and en-vironmental correlates in the Sundarbans of Bangladesh. J. Ecol., v. 88, n. 5, p. 813-824, 2000.
ESTRADA, G. C. D.; CALLADO, C. H.; SOARES, M. L. G.; LISI, C. S. Annual growth rings in the mangrove Laguncula-ria racemosa (Combretaceae). Trees, v. 22, n. 5, p. 663-670,
2008;
ESTRADA, G. C. D.; SOARES, M. L. G.; CHAVES, F. O.; CA-VALCANTI, V. F. Analysis of the structural variability of mangrove forests through the physiographic types approach.
Aquat. Bot., v. 111, p. 135-143, 2013.
EWEL, K. C.; BOURGEOIS, J. A.; COLE, T. G. Variation in environmental characteristics and vegetation in high-rainfall mangrove forests, Kosrae, Micronesia. Glob. Ecol. Biogeogr. Lett., v. 7, n. 1, p. 49-56, 1998.
FELLER, I. C.; MCKEE, K. L.; WHIGHAM, D. F.; O’NEILL, J. P. Nitrogen vs. phosphorus limitation across an ecotonal gradient in a mangrove forest. Biogeochemistry, v. 62, n. 2,
p. 145-175, 2003.
FRELICH, L. E. Forest Dynamics and Disturbances Regimes: Studies from Temperate Evergreen-Deciduous Forests.
Cam-bridge: Cambridge University Press, 2002. 266 p.
GORDON, D. M. Diurnal water relations and the salt content of two contrasting mangroves growing in hypersaline soils in tropical-arid Australia. In: LIETH, H.; AL MASOOM, A. (Eds.). Towards the rational use of high salinity tolerant plants. Zurich: Kluwer Academic Publishers, 1993. p.
193-216.
HUSTON, M. A. Biological Diversity – The Coexistence of Spe-cies on Changing Landscapes. Cambridge: Cambridge
Uni-versity Press, 1996. 704 p.
HUTCHINGS, P. A.; SAENGER, P. Ecology of Mangroves.
Bris-bane: University of Queensland Press, 1987. 388 p. JIMÉNEZ, J. A. The structure and function of dry weather
man-groves on the Paciic coast of Central America, with emphasis on Avicennia bicolor forests. Estuaries, v. 13, n. 2, p.
182-192, 1990.
JIMÉNEZ, J. A; SAUTER, K. Structure and dynamics of man-grove forests along a looding gradient. Estuaries, v. 14, n.
1, p. 49-56, 1991.
JOSHI, H.; GHOSE, M. Forest structure and species distribution along soil salinity and pH gradient in mangrove swamps of the Sundarbans. Trop. Ecol., v. 44, n. 2, p. 197-206, 2003.
KRAUSS, K. W.; KEELAND, B. D.; ALLEN, J. A.; EWEL, K. C.; JOHNSON, D. J. Efects of season, rainfall, and hydro-geomorphic setting on mangrove tree growth in Micronesia.
Biotropica, v. 39, n. 2, p. 161-170, 2007.
KRAUSS, K. W.; LOVELOCK, C. E.; MCKEE, K. L.; LÓPEZ--HOFFMAN, L.; EWE, S. M. L.; SOUSA, W. P. Environ-mental drivers in mangrove establishment and early develo-pment: a review. Aquat. Bot., v. 89, n. 2, p. 105-127, 2008.
LARA, R. J.; COHEN, M. C. L. Sediment porewater salinity, looding frequency and mangrove vegetation height in Bra-gança, North Brazil: an ecohydrology-based empirical model.
Wetl. Ecol. Manag., v. 14, n. 4, p. 349-358, 2006.
LARA-DOMÍNGUEZ, A. L.; DAY JR, J. W.; ZAPATA, G. V. Structure of a unique inland mangrove forest assemblage in fossil lagoons on the Caribbean Coast of Mexico. Wetl. Ecol. Manag., v. 13, p. 111-122, 2005.
LOVELOCK, C. E.; FELLER, I. C.; ELLIS, J.; SCHWARZ, A. M.; HANCOCK, N.; NICHOLS, P.; SORRELL, B. Man-grove growth in New Zealand estuaries: the role of nutrient enrichment at sites with contrasting rates of sedimentation.
Oecologia, v. 153, n. 3, p. 633-641, 2007.
LUGO, A.E.; SNEDAKER, S.C. The ecology of mangroves. Ann. Rev. Ecol. Syst., v. 5, p. 39-64, 1974.
MEDINA, E.; GIARRIZZO, T.; MENEZES, M. P.; CARVA-LHO, M. L.; CARVACARVA-LHO, E. A.; PERES, A.; SILVA, A. B.; VIILHENA, R.; REISE, A.; BRAGA, C. Mangal communi-ties of the Salgado Paraense: ecological heterogeneity along the Bragança peninsula assessed through soil and leaf analy-ses. Amazoniana, v. 16, n. 3/4, p. 397-416, 2001.
NICKERSON, N. H.; THIBODEAU, F. R. Association between pore water sulide concentrations and the distribution of man-groves. Biogeochemistry, v. 1, n. 2, p. 183-192, 1985.
ODUM, E. P. Trends expected in stressed ecosystems. BioScien-ce, v. 35, n. 7, p. 419-422, 1985.
OLIVER, C. D.; LARSON, B. C. Forest Stand Dynamics. New
York: McGraw-Hill, 1990. 544 p.
PIOU, C.; FELLER, I. C.; BERGER, U.; CHI F. Zonation pat-terns of Belizean ofshore mangrove forests 41 years after a catastrophic hurricane. Biotropica, v. 38, n. 3, p. 365-374,
2006.
RIDD, P. V.; SAM, R. Proiling Groundwater Salt Concentrations in Mangrove Swamps and Tropical Salt Flats. Estuar. Coast. Shelf Sci., v. 43, n. 5, p. 627-635, 1996.
SAM, R.; RIDD, P. Spatial variations of groundwater salinity in a mangrove-salt lat system, Cocoa Creek, Australia. Mangr. Salt Mar., v. 2, n. 3, p. 121-132, 1998.
SANTOS, M. C. F. V.; ZIEMAN, J. C.; COHEN, R. R. H. Inter-preting the upper mid-littoral zonation patterns of mangroves in Maranhão (Brazil) in response to microtopography and hydrology. In: KJERFVE, B.; LACERDA, L. D.; DIOP, E. H. S. (Eds.). Mangrove Ecosystems Studies in Latin America and Africa. Paris: UNESCO, 1997. p. 127-144.
SCHAEFFER-NOVELLI, Y.; CINTRÓN-MOLERO, G.; ADAI-ME, R. R.; CAMARGO, T. M. Variability of mangrove ecosystems along the Brazilian coast. Estuaries, v. 13, n. 2,
p. 204-218, 1990.
SCHAEFFER-NOVELLI, Y.; CINTRÓN-MOLERO, G.; SOA-RES, M. L. G.; DE-ROSA, T. Brazilian mangroves. Aquat. Ecosyst. Health Manag., v. 3, n. 4, p. 561-570, 2000.
SHERMAN, R. E.; FAHEY, T. J.; BATTLES, J. J. Small-scale disturbance and regeneration dynamics in a neotropical man-grove forest. J. Ecol., v. 88, n. 1, p. 165-178, 2000.
SMITH, T. J. Forest structure. In: ROBERTSON, A. I.; ALONGI, D. M. (Eds.). Tropical mangrove ecosystems. Washington:
American Geophysical Union, 1992. p. 101-136.
SOARES, M. L. G. Structure and degree of perturbation of man-groves at Tijuca Lagoon, Rio de Janeiro, RJ, Brazil. Rev. Bras. Biol., v. 59, p. 503-51, 1999.
SOARES, M. L. G.; CHAVES, F. O.; CORRÊA, F. M.; SILVA JÚNIOR, C. M. G. Diversidade Estrutural de Bosques de Mangue e sua Relação com Distúrbios de Origem Antrópica: o caso da Baía de Guanabara (Rio de Janeiro). Anu. Inst. Geo-cienc. UFRJ, v. 26, p. 101-116, 2003.
SOARES, M. L. G.; CHAVES, F. O.; ESTRADA, G. C. D.; CA-VALCANTI, V. F.; PORTUGAL, A. M. M.; BARBOSA, B. Characterization of mangrove forests from the Caravelas Es-tuarine Complex (Bahia - Brazil). Bol. Tec. Cient. CEPENE Tamandaré,v. 16, n. 5, p. 23-41, 2008.
TOMLINSON, P. B. The Botany of Mangroves. Cambridge:
Cambridge University Press, 1986. 419 p.
TWILLEY, R. R. Properties of mangrove ecosystems related to the energy signature of coastal environments. In: HALL, C. (Ed.). Maximum Power. Boulder: University of Colorado
Press, 1995. p. 43-61.
VICENTE, J. F.; CARVALHO, M. G.; BARBOSA, G. R. Avalia-ção Hidrogeológica das Regiões Administrativas de Campo Grande e Guaratiba / RJ. In: Anais do XVI Congresso Brasi-leiro de Águas Subterrâneas, São Luis - MA, 2010.
WALSH, G. E. Mangroves: a review. In: REIMOLD, R. J; QUEEN, W. H. (Eds.). Ecology of halophytes. New York: