Article
Printed in Brazil - ©2015 Sociedade Brasileira de Química0103 - 5053 $6.00+0.00A
*e-mail: [email protected]
Monitoring of Pesticide Residues in Surface and Subsurface Waters, Sediments, and
Fish in Center-Pivot Irrigation Areas
Aderbal A. Rocha,a,b Sérgio H. Monteiro,*,c Graziela C. R. M. Andrade,b Franz Z. Vilcab and Valdemar L. Tornisielob
aInstituto Federal de São Paulo, Campus Capivari, Avenida Doutor Ênio Pires de Camargo, 2971,
13360-000 Capivari-SP, Brazil
bCentro de Energia Nuclear na Agricultura, Laboratório de Ecotoxicologia,
Avenida Centenário, 303, 13416-903 Piracicaba-SP, Brazil
cInstituto Biológico, Av. Conselheiro Rodrigues Alves, 1252,
Vila Mariana, 04014-002 São Paulo-SP, Brazil
In this study, the monitoring of pesticide residues, which show potential for environmental contamination, in center-pivot irrigated areas in the Brazilian cerrado, was performed. The pesticides monitored were acephate, atrazine, azoxystrobin, buprofezin, carbofuran, cyproconazole, chlorpyrifos, difenoconazole, diuron, imidacloprid, malathion, methamidophos, metolachlor, metribuzin, monocrotophos, monuron, thiamethoxam, and triazophos. Surface water samples were collected upstream and downstream of Tijunqueiro dam. The subsurface water in piezometric wells was drilled in the surroundings of the irrigated area; fish and sediment were collected in the dam. The technique of solid phase extraction (SPE) was used for the extraction of water samples, the matrix solid phase dispersion (MSPD) for the sediment samples and QuEChERS (quick, easy, cheap, effective, rugged and safe) for the fish samples. The multiresidue methods used were accurate and precise for most pesticides monitored by liquid chromatography-tandem mass spectrometry (LC-MS/MS). Atrazine was detected in two of the subsurface water samples.
Keywords: multiresidue method, solid phase extraction, matrix solid phase dispersion, QuEChERS, LC-MS/MS
Introduction
Increasing crop production in agriculture has been easier by the use of effective chemical agents, such as insecticides, fungicides, acaricide and herbicides. However, it is critical that they must be used properly to preserve not only the quality of the final product, but also the finite natural resources that sustain production, especially soil and water.
Irrigation application and crop water use can be improved by scheduling the irrigation of crops using physical and agronomic principles. The irrigation management strategy using these principles may be automatically implemented using a control system, which is known as center pivot. Its main advantages are reducing hand labor, ability to obtain higher yields, high uniformity of water distribution and ease of automation.1
The human and ecological system exposure to contaminants is related to their distribution between the various compartments of the environment (atmosphere, soils, surface, subsurface and groundwater and oceans), to their transport between the compartments, and to their fate in each compartment, which includes their availability for uptake and bioaccumulation by organisms. Human exposure may occur by drinking freshwater and eating fish and other seafoods.2
Within the water compartment, it is particularly important to consider the sediment phase because of many contaminants and their largely hydrophobic nature; they are known to associate strongly with natural sediments and dissolved organic matter.2
Many studies have reported the monitoring of pesticides in water,3 sediment,4 and fish5 using different
extraction (SPE),6 matrix solid-phase dispersion (MSPD)7
and QuEChERS (quick, easy, cheap, effective, rugged and safe).8,9
The monitoring of microbasin in Brazilian cerrado is still unusual, but it is crucial to the current and future water supply.10 The goals of the present study were the
development and validation of methods to determine pesticide residues in surface and subsurface water, sediments and fish muscle, and also to monitor pesticides in center-pivot irrigated areas in the Brazilian cerrado, which show potential for environmental contamination.
Experimental
Study area
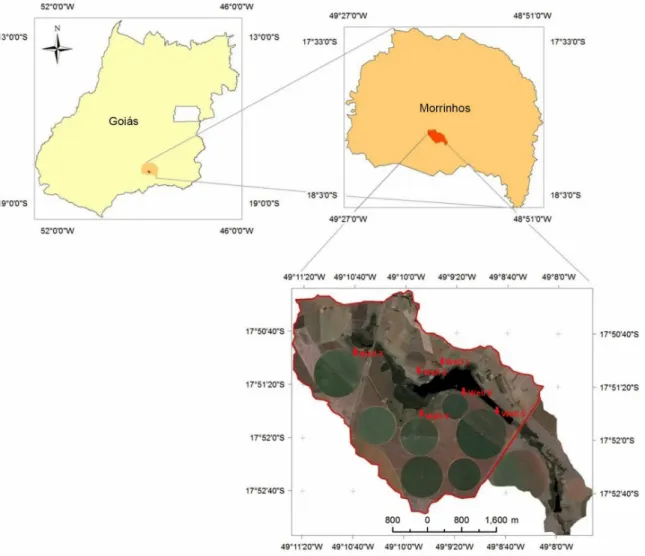
The study area, located in the southern region of the state of Goiás in the city of Morrinhos, Brazil, is an important area where there is intensive cultivation of annual crops irrigated through center pivot (Figure 1).11
Sampling
Samples of surface water, subsurface water, sediment and fish were collected in Tijunqueiro microbasin, which has a dam that supplies water to eight pivots around it, making a total of 28 surface water samples, 70 subsurface water samples, 28 sediment samples and 42 fish samples.
Surface water
Samples were collected monthly between February 2009 and January 2010, and quarterly between January 2010 and September 2010 to account for the major variations in the water chemical characteristics, which are linked to the seasonal rainfall pattern.
The water was sampled along a vertical profile in the upstream and downstream of the dam at a depth of approximately 2 m.
Subsurface water
The collection of samples from the subsurface water
was made in piezometric wells (monitoring wells) drilled around the irrigated area, totaling 6 wells (Figure 1).11
The collection was done on the same dates as the surface water sampling.
The 6 monitoring wells were drilled with a manual auger in a depth from 3 to 4 m, following the ABNT NBR 13.895 norm.12 The wells were dry at the samplings’ time,
well 1 and 2 in August, September and October 2009, June and September 2010, and well 4 in September and October 2009, June and September 2010.
Sediment
The sediment was collected using a Petersen dredge. Approximately 300 g of sediment was placed in glass amber bottles that were previously washed with acetone, heated to 280 °C and silanized. The sediment samples were collected quarterly at 2 points, one near the upstream and another near the downstream in the period between March 2009 and September 2010, and on the same dates as the surface water sampling.
Fish
Samples of three species of fish primary consumers are tilapia (Tilapia cf. rendalli) and tetra (Astyanax sp.), and the secondary consumer is traira (Hoplias malabaricus) were collected quarterly in the period between March 2009 and September 2010. Duplicates of fish were selected and packed individually in plastic bags with eugenol, stored in a Styrofoam box with ice, and transported to the laboratory on the same day. At the laboratory, the fish were anesthetized with benzocaine 0.2 mg mL-1 and killed by medullary
sectioning; then, the muscle with the peel was chopped and crushed with dry ice using a blender with a glass cup, and stored at −18 °C until the moment of extraction.
Reagents and materials
The analytical standards of pesticides were purchased from ChemService (West Chester, PA, USA), ranging from 97% to 99.5% of purity. Acetonitrile and methanol degree HPLC/Spectro were purchased from the Tedia Company Inc. (Fairfield, OH, USA), and formic acid 88% and glacial acetic acid 99.5% from J. T. Baker (Phillipsburg, NJ, USA). A Milli-Q Direct-Q 3UV ultrapure water system from Millipore (Bedford, MA, USA) was used throughout the study to obtain the HPLC-grade water.
The QuEChERS kits (DisQuE product), which consisted of 50 mL tubes containing 6 g anhydrous MgSO4 plus 1.5 g
anhydrous NaOAc (tube 1) and 2 mL tubes containing 150 mg anhydrous MgSO4 plus 50 mg PSA sorbent
(tube 2), were purchased from Waters (Milford, MA, USA).
Stock standard solutions of individual compounds (1000 µg mL-1) were prepared in acetonitrile and stored at
−18 °C in amber bottles for 6 months. A multicompound working standard solution (10 µg mL-1) was prepared
using appropriate dilution of the stock standard solutions with water:acetonitrile (80:20), stored under refrigeration (T < 5 °C) and renewed weekly.
Instrumentation
The liquid chromatography-tandem mass spectrometry (LC-MS/MS) system (Agilent, Wilmington, DE, USA) equipped with a Chromatograph 1200 binary pump, an automatic sampler G1367C and a mass spectrometer 6430 Triple Quadruple was used to determine and quantify the pesticide residues.
Sample processing and analyses
Water
The solid-phase extraction (SPE) cartridge used was Sep-Pak C18 with 500 mg sorbent per cartridges from Waters (Milford, MA, USA); the cartridges were conditioned with 10 mL of methanol, followed by 10 mL of water. An aliquot of 200 mL of solution was passed through the cartridge with a flow rate of 1.5 mL min-1 and
then washed with 10 mL of water. After that, the cartridges were dried out for one hour. Subsequently, the pesticides were eluted with 10 mL of methanol. The methanol was evaporated to dryness under a gentle stream of nitrogen using the TurboVap (LV Caliper, LifeSciences). The residue was redissolved in 10 mL of water and acetonitrile (80:20), and the redissolved solution was transferred into a vial for analysis by LC-MS/MS.
Sediment
coupled with a small vacuum pump. The pesticides were then extracted using 10 mL of methanol and 5 mL of ethyl acetate, and the eluate was collected in a glass graduated conical tube and evaporated to dryness under a gentle stream of nitrogen using the TurboVap. The residue was in 10 mL of water:acetonitrile (80:20), and the solution was transferred to a vial for analysis by LC-MS/MS.
Fish
The QuEChERS method13 was used for the sample
preparation of fish samples. Five grams of fish was transferred to a polypropylene tube of 50 mL (tube 1). Afterwards, 15 mL of acetonitrile acidified with 1% (v/v) of acetic acid was added, and the samples were manually shaken vigorously for 1 min. Next, the extract was centrifuged at 6900 g for 5 min in a Hitachi CF16RXII centrifuge (Himac, Tokyo, Japan). After that, an aliquot of 1 mL of the supernatant was transferred to a polypropylene tube of 2 mL (tube 2). The extract was shaken manually for 30 s and centrifuged for 5 min at 6900 g. In the end, 100 µL of the supernatant was transferred to a vial and became filled with 900 µL of mobile phase. Before injection in the LC-MS/MS system, the sample was filtered in a 0.20 µm Teflon filter (Whatman, Florham Park, NJ, USA) into a vial for analysis by LC-MS/MS.
Chemical characterization of water samples
One liter of the surface and subsurface water samples was filtered with cellulose membrane filters of 0.45 µm. After filtration, the samples were analyzed by ion chromatography (IC), using a Dionex ICS-90 system (Sunnyvale, CA, USA). In the analysis, identification and quantification of ions present in the samples were performed with the use of analytical curves previously prepared at concentrations of 1, 5 and 10 mg L-1.
The standards were prepared from stock solutions (100 mg L-1) of each chemical species of interest using
low conductivity water (HPLC-grade water). The analyzed ions were: chloride, nitrate, phosphate, sulfate, ammonium, magnesium, potassium, sodium and calcium. The alkalinity content was also determined, represented by the HCO3−, using the microtiter method Gran.14 The
pH, temperature, and conductivity were measured using Aquaread AP 5000 AgSolv.
Physical characterization of sediment samples
The sediment samples were dried at a low temperature using a lyophilizer Liotop L101, and then passed through a 2 mm sieve. The textural composition (sand, silt and clay) of the samples was determined according to the method described by Raij et al. (1987).15
LC-MS/MS conditions
The separations were carried out using an Agilent Eclipse plus C18 column (100 × 2.0 mm, 3.5 µm particle size). The mobile phases were as follows: A-0.1% formic acid and 5 mmol L-1 ammonium formate in water and B-0.1% formic
acid and 5 mmol L-1 ammonium formate in acetonitrile. The
gradient program started at 20% B until 4 min, with linear gradient at 80% B until 6 min, and then remained constant for 1.4 min. After that, the linear gradient was at 100% B until 8 min, and then remained constant for 3 min. After running for 11 min, the re-equilibrium time (post time) was 3 min using 20% B. The flow remained constant at 0.6 mL min-1,
and the injection volume was 10 µL.
The ESI parameters in the positive ionization mode were as follows: gas flow 10 L min-1, nebulizer pressure 40 psi,
gas temperature 300 ºC, and capillary voltage of 3500 V. Nitrogen 99.99% was used as a nebulizer and 99.9999% as a collision gas. For data acquisition, the software Agilent Mass Hunter was used. For the detection in the MS/MS, the SRM (selected reaction monitoring) mode was used.
The most intense transition was used as a quantifying ion, and the second most intense transition was used as a qualifying ion for the confirmation of the analysis.
Validation of the analytical procedure
The evaluated accuracy through the recoveries essay of pesticides was identified using the water, sediment and fish samples spiked with the analytes at three concentration levels: 20, 60 and 100 ng mL-1 for water and 20, 60 and
100 ng g-1 for sediment and fish. The samples were analyzed
in quintuplicate.
The linearity of the method was assessed using standard solutions in solvent and standard solutions in matrix extract; six concentrations between 10 and 100 ng mL-1
were injected in triplicate. Blanks were also prepared as a quality control tool, but they were not included in the regression analysis (blank values were not higher than 30% of the method quantitation limit, MQL). The results were analyzed using the linear regression method.
The matrix effects (ME) were studied using the evaluation of signal suppression or enhancement for each pesticide. The ME was determined, comparing the slope reasons of standards in the solvent and in the matrix according to the equation 1.16
matrix curve slope
ME(%) = 1 – × 100
solvent curve slope
(1)
expressed as the relative standard deviation (RSD) of replicate measurements.
The method detection limits (MDL) and method quantitation limits (MQL) were derived from the spiked samples and expressed as a concentration producing an S/N ratio of 3 and 10 respectively.
Results and Discussion
The follows sample preparation methods SPE, MSPD and QuEChERS were used to efficiently for the determination of pesticide residues in water, sediment, and fish, respectively, followed by LC-ESI-MS/MS analysis in SRM mode, which confirmed to be an useful tool for this purpose.
Parameters of mass spectrometr y and compound identification
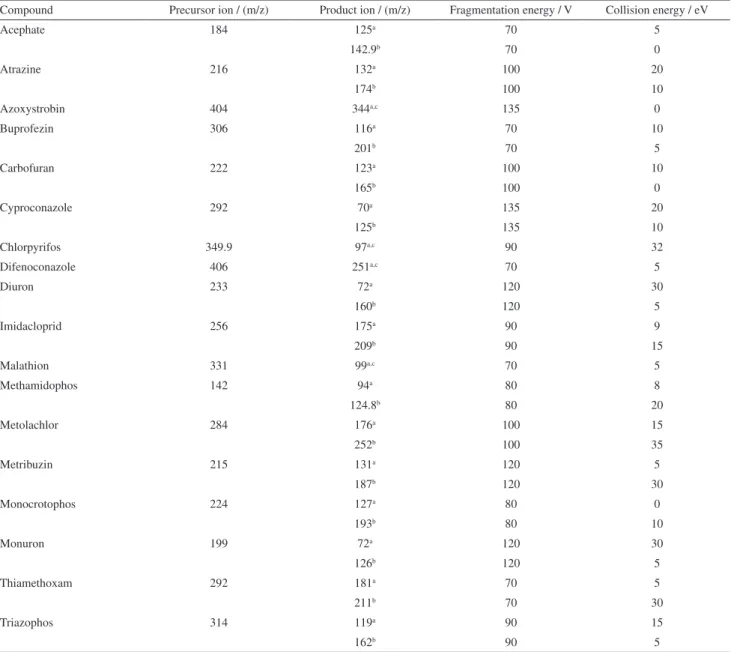
The monitored ions for each compound are in Table 1. The procedure used for the identification of pesticide residues included retention time and two SRM transitions. Chromatograms of the compounds with the transitions selected for the analysis are presented in Figure 2.
Validation of the LC-MS/MS method for water, sediment and fish samples
The analytical performance parameters are important for determining the method potential. Therefore, under
Table 1. Acquisition parameters for pesticide analysis in the SRM mode
Compound Precursor ion / (m/z) Product ion / (m/z) Fragmentation energy / V Collision energy / eV
Acephate 184 125a 70 5
142.9b 70 0
Atrazine 216 132a 100 20
174b 100 10
Azoxystrobin 404 344a,c 135 0
Buprofezin 306 116a 70 10
201b 70 5
Carbofuran 222 123a 100 10
165b 100 0
Cyproconazole 292 70a 135 20
125b 135 10
Chlorpyrifos 349.9 97a,c 90 32
Difenoconazole 406 251a,c 70 5
Diuron 233 72a 120 30
160b 120 5
Imidacloprid 256 175a 90 9
209b 90 15
Malathion 331 99a,c 70 5
Methamidophos 142 94a 80 8
124.8b 80 20
Metolachlor 284 176a 100 15
252b 100 35
Metribuzin 215 131a 120 5
187b 120 30
Monocrotophos 224 127a 80 0
193b 80 10
Monuron 199 72a 120 30
126b 120 5
Thiamethoxam 292 181a 70 5
211b 70 30
Triazophos 314 119a 90 15
162b 90 5
the optimal conditions determined previously, the matrix effects, linearity, accuracy, precision, MDL, MQL and repeatability of extraction methods were measured.
The results are shown in Table 2. Linearity with correlation coefficients greater than 0.99 for all pesticides was studied over the concentration range of 0.50-100 ng mL-1
in the 3 matrices.
It is well known that the matrix effects are one of the main drawbacks of LC-MS/MS methods, making quantification in samples problematic in some cases,17
and the dilution of samples can improve quantitative measurements by lowering the amount of matrix that is present during analysis.18,19 In this study, a dilution of
10 times of the extracts was sufficient to eliminate the
Figure 2. SRM Chromatogram of 18 pesticides in a blank water sample spiked at 100 ng g-1. 1: Acephate, 2: methamidophos, 3: monocrotophos, 4:
thiamethoxam, 5: imidacloprid, 6: monuron, 7: metribuzin, 8: carbofuran, 9: atrazine, 10: diuron, 11: cyproconazole, 12: azoxystrobin, 13: metolachlor, 14: malathion, 15: triazophos, 16: difenoconazole, 17: buprofezin, 18: chlorpyrifos.
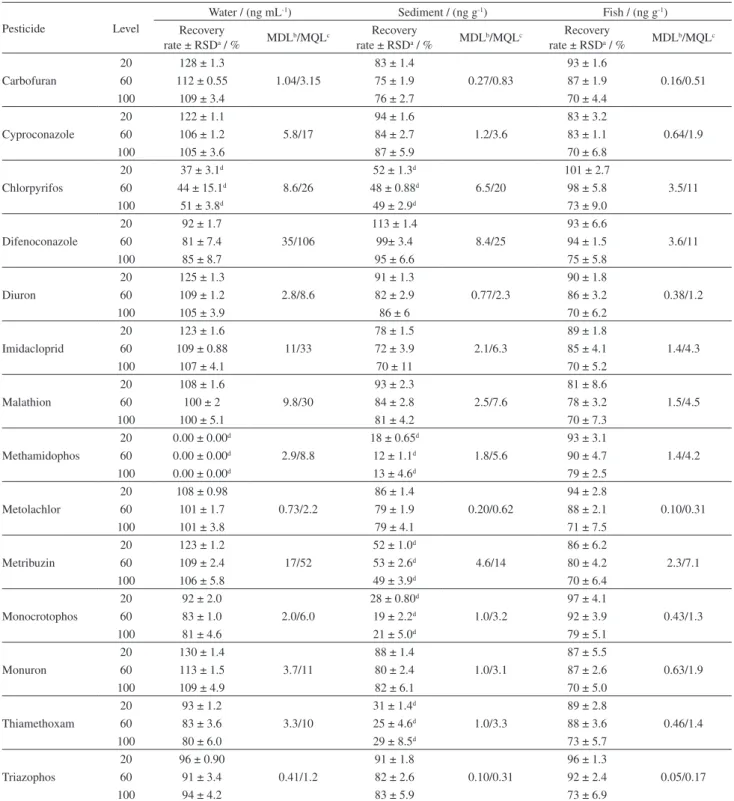
Table 2. Recovery rates, method detection limits (MDLs), and method quantitation limits (MQLs) of pesticides in spiked water, sediment, and fish samples analyzed using LC-MS/MS. Results are expressed as mean value ± relative standard deviation (RSD) (n = 5)
Pesticide Level
Water / (ng mL-1) Sediment / (ng g-1) Fish / (ng g-1)
Recovery
rate ± RSDa / % MDL
b/MQLc Recovery
rate ± RSDa / % MDL
b/MQLc Recovery
rate ± RSDa / % MDL b/MQLc
Acephate
20 0.00 ± 0.00d
1.9/5.8
29 ± 1.4d
1.2/3.6
90 ± 2.2
0.37/1.1
60 0.00 ± 0.00d 13 ± 1.9d 88 ± 4.7
100 0.00 ± 0.00d 15 ± 2. 7d 79 ± 3.3
Atrazine
20 127 ± 1.1
1.64/4.98
85 ± 1.4
0.45/1.37
94 ± 2.7
0.22/0.67
60 112 ± 1.3 78 ± 2.5 89 ± 2.2
100 109 ± 2.7 80 ± 4.5 73 ± 6.4
Azoxystrobin
20 130 ± 1.5
1.2/3.7
97 ± 1.2
5.0/7.2
91 ± 2.1
0.13/0.40
60 113 ± 0.54 78 ± 11 89 ± 2.8
100 97 ± 4.7 91 ± 5.7 70 ± 6.4
Buprofezin
20 60 ± 0.49
0.58/1.77
76 ± 0.53
0.23/0.72
95 ± 0.86
0.07/0.23
60 64 ± 7.7 69 ± 2.9 90 ± 1.1
matrix effect in the fish samples. The matrix components for all matrices involved were not significantly affected in the present study, because the signal change was less than 20% in the whole investigated concentration range.
The MDL and MQL obtained are stated in Table 2. The MDL ranged from 0.41 to 35 ng mL-1 for water,
0.10 to 8.4 ng g-1 for sediment, and 0.05 to 3.6 ng g-1 for
fish, and the MQL ranged from 1.2 to 106 ng mL-1 for
Pesticide Level
Water / (ng mL-1) Sediment / (ng g-1) Fish / (ng g-1)
Recovery
rate ± RSDa / % MDL
b/MQLc Recovery
rate ± RSDa / % MDL
b/MQLc Recovery
rate ± RSDa / % MDL b/MQLc
Carbofuran
20 128 ± 1.3
1.04/3.15
83 ± 1.4
0.27/0.83
93 ± 1.6
0.16/0.51
60 112 ± 0.55 75 ± 1.9 87 ± 1.9
100 109 ± 3.4 76 ± 2.7 70 ± 4.4
Cyproconazole
20 122 ± 1.1
5.8/17
94 ± 1.6
1.2/3.6
83 ± 3.2
0.64/1.9
60 106 ± 1.2 84 ± 2.7 83 ± 1.1
100 105 ± 3.6 87 ± 5.9 70 ± 6.8
Chlorpyrifos
20 37 ± 3.1d
8.6/26
52 ± 1.3d
6.5/20
101 ± 2.7
3.5/11
60 44 ± 15.1d 48 ± 0.88d 98 ± 5.8
100 51 ± 3.8d 49 ± 2.9d 73 ± 9.0
Difenoconazole
20 92 ± 1.7
35/106
113 ± 1.4
8.4/25
93 ± 6.6
3.6/11
60 81 ± 7.4 99± 3.4 94 ± 1.5
100 85 ± 8.7 95 ± 6.6 75 ± 5.8
Diuron
20 125 ± 1.3
2.8/8.6
91 ± 1.3
0.77/2.3
90 ± 1.8
0.38/1.2
60 109 ± 1.2 82 ± 2.9 86 ± 3.2
100 105 ± 3.9 86 ± 6 70 ± 6.2
Imidacloprid
20 123 ± 1.6
11/33
78 ± 1.5
2.1/6.3
89 ± 1.8
1.4/4.3
60 109 ± 0.88 72 ± 3.9 85 ± 4.1
100 107 ± 4.1 70 ± 11 70 ± 5.2
Malathion
20 108 ± 1.6
9.8/30
93 ± 2.3
2.5/7.6
81 ± 8.6
1.5/4.5
60 100 ± 2 84 ± 2.8 78 ± 3.2
100 100 ± 5.1 81 ± 4.2 70 ± 7.3
Methamidophos
20 0.00 ± 0.00d
2.9/8.8
18 ± 0.65d
1.8/5.6
93 ± 3.1
1.4/4.2
60 0.00 ± 0.00d 12 ± 1.1d 90 ± 4.7
100 0.00 ± 0.00d 13 ± 4.6d 79 ± 2.5
Metolachlor
20 108 ± 0.98
0.73/2.2
86 ± 1.4
0.20/0.62
94 ± 2.8
0.10/0.31
60 101 ± 1.7 79 ± 1.9 88 ± 2.1
100 101 ± 3.8 79 ± 4.1 71 ± 7.5
Metribuzin
20 123 ± 1.2
17/52
52 ± 1.0d
4.6/14
86 ± 6.2
2.3/7.1
60 109 ± 2.4 53 ± 2.6d 80 ± 4.2
100 106 ± 5.8 49 ± 3.9d 70 ± 6.4
Monocrotophos
20 92 ± 2.0
2.0/6.0
28 ± 0.80d
1.0/3.2
97 ± 4.1
0.43/1.3
60 83 ± 1.0 19 ± 2.2d 92 ± 3.9
100 81 ± 4.6 21 ± 5.0d 79 ± 5.1
Monuron
20 130 ± 1.4
3.7/11
88 ± 1.4
1.0/3.1
87 ± 5.5
0.63/1.9
60 113 ± 1.5 80 ± 2.4 87 ± 2.6
100 109 ± 4.9 82 ± 6.1 70 ± 5.0
Thiamethoxam
20 93 ± 1.2
3.3/10
31 ± 1.4d
1.0/3.3
89 ± 2.8
0.46/1.4
60 83 ± 3.6 25 ± 4.6d 88 ± 3.6
100 80 ± 6.0 29 ± 8.5d 73 ± 5.7
Triazophos
20 96 ± 0.90
0.41/1.2
91 ± 1.8
0.10/0.31
96 ± 1.3
0.05/0.17
60 91 ± 3.4 82 ± 2.6 92 ± 2.4
100 94 ± 4.2 83 ± 5.9 73 ± 6.9
aRelative standard deviation (RSD); bmethod detection limits (MDL); cmethod quantitation limit (MQL); dcompounds that were excluded of the quantifications
in the corresponding matrices.
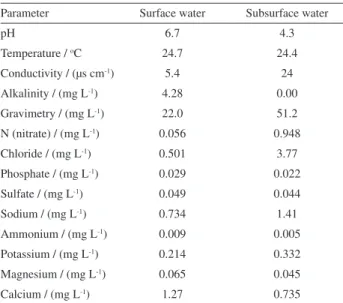
Table 3. Chemical characterization of surface and subsurface water samples of Tijunqueiro microbasin, Morrinhos, state of Goiás, Brazil
Parameter Surface water Subsurface water
pH 6.7 4.3
Temperature / oC 24.7 24.4
Conductivity / (µs cm-1) 5.4 24
Alkalinity / (mg L-1) 4.28 0.00
Gravimetry / (mg L-1) 22.0 51.2
N (nitrate) / (mg L-1) 0.056 0.948
Chloride / (mg L-1) 0.501 3.77
Phosphate / (mg L-1) 0.029 0.022
Sulfate / (mg L-1) 0.049 0.044
Sodium / (mg L-1) 0.734 1.41
Ammonium / (mg L-1) 0.009 0.005
Potassium / (mg L-1) 0.214 0.332
Magnesium / (mg L-1) 0.065 0.045
Calcium / (mg L-1) 1.27 0.735
Table 4. Results of particle size analysis of sediment samples, Tijunqueiro dam, Morrinhos, state of Goiás, Brazil
Sediment Sample Sand / (g kg-1) Silt / (g kg-1) Clay / (g kg-1)
Headboard 680 44 276
Downstream 700 24 276
water, 0.31 to 25 ng g-1 for sediment, and 0.17 to 11 ng g-1
for fish.
The results of accuracy and precision, which were evaluated through recovery tests of all the target compounds at different fortification levels, are presented in Table 2. The accuracy ranged from 70% to 130% for all the target compounds, except acephate, chlorpyrifos, and methamidophos for water and sediment, and metribuzin, monocrotophos and thiamethoxam for sediments. For this reason, these compounds were excluded from the quantifications in these matrices.
The method precision was observed for all the substances, it was assessed at three concentration levels. The relative standard deviation (RSD) of the quintuplicate experiment results is given in Table 2. The RSD was lower than 9% for all target pesticides.
Pesticide levels in water samples
The chemical characterization of surface and subsurface water samples collected in September 2009 is shown in Table 3.
Considering the levels of chloride, nitrate and conductivity, there are significant differences between the samples of surface and subsurface water; this difference may be associated with the application of nitrogen and potassium fertilizers in the cultivation of maize, adjacent to monitoring well number 4, the place where the subsurface water sample was collected in September 2009.
Tijunqueiro microbasin presents relatively flat relief and clayey soil with low susceptibility to erosion; thus, there
is less risk of contamination of surface waters by runoff water and drag of the soil particles (erosion).
No pesticides were detected in surface water samples during the monitoring period from February 2009 to September 2010. Already in the samples of subsurface water, atrazine residues were observed in two samples, but below the MQL, in a sample collected on March 2009 in the well 1 and another sample collected on September 2010 in the well 5.
The atrazine contamination in subsurface water samples is associated with its application in the maize cultivation in the region.20 Because of the direct application of
atrazine in crops, it is possible the occurrence of soil contamination and consequently, subsurface water sources due to its low vapor pressure, slow hydrolysis and moderate mobility in the soil.21,22
The atrazine has been listed by the United States Environmental Protection Agency (EPA) as a restricted use pesticide, because of its persistence in water and various adverse health effects on humans. In contrast to the United States, Europe has stricter regulations to atrazine use. In 1991, the European Union (EU) directive on pesticides curtailed the use of products suspected of harming human health, groundwater or the environment. Additionally, the order also established a 12-year review period for products already on the market, and concluded that the herbicide had the potential to contaminate groundwater levels exceeding the allowed 0.1 µg L-1 even during appropriate use. This
finding instigated a regulatory ban on atrazine that applies to all EU member states, which went into effect in 2005.23
Pesticide levels in sediment samples
The physical characterization of the sediment in Tijunqueiro microbasin is shown in Table 4, there is no significant difference between samples collected at the headboard and the downstream of the Tijunqueiro dam.
The local hydrology, topography and soil type are favorable to the leach of pesticides to subsurface water, because the site presents superficial groundwater (in the monitoring well number 5, the water level during rainy season was about 50 cm deep), flat terrain, and clayey soil with granular structure and good permeability. In addition, there is the possibility of contamination of waterways through runoff.
In the determination of pesticide residues in sediment samples, the results are below the MDL for all compounds monitored.
Pesticide levels in fish samples
Fish samples of tilapia (Tilapia cf. rendalli), tetra (Astyanax sp.), and traira (Hoplias malabaricus) collected from Tijunqueiro microbasin showed pesticide residues below the MDL for all compounds monitored.
The lipophilicity, expressed by the logarithm of octanol-water partition coefficient (pKow), constitutes a physicochemical property of important role in absorption, distribution, metabolism, and elimination characteristics of pesticides.24 Although there are pesticides with pKow
values > 4 at this work, pesticide residues were not found above the MDL in fish. This fact can be explained by low evidence of runoff water in the studied area, and another important factor is the large volume of water stored in the dam, which implies high dilution and dispersion of potential contaminants in the water of Tijunqueiro microbasin.
The potential for ecological risks of atrazine in fresh and estuarine waters has been extensively reviewed with respect to its potential effects in ecological systems, and these assessments concluded that atrazine did not present significantly acute or chronic ecological risks.25
Because of the dilution in these environments, exposures are likely to be very small and do not present a direct or indirect risk.26
It should be noted that the region of study has natural peat formation riparian zones, which present an accumulation of dead organic material that does not fully decompose because of waterlogged conditions, and this material is important for the management of the water quality.27 Studies have demonstrated the
effectiveness of riparian zones in the reduction of nitrates and phosphorous compounds and a number of pesticides in agricultural basins.28,29 This fact could explain the
contamination of the subsurface water, only because the molecules can be immobilized on peat or be degraded by microorganisms present30 before contamination of the
microbasin.
Conclusions
T h e L C - M S / M S m e t h o d s f o r s i m u l t a n e o u s determination of 18 pesticides of different classes in surface and subsurface water, sediments and muscle from three fish species was simple and fast, thus allowing high sample throughput. The methods demonstrated excellent performance parameters that allowed the determination of low levels of selected pesticides in all the samples.
The analyses of surface water, sediments, and fish from Tijunqueiro microbasin, located in the city of Morrinhos, state of Goiás, in the Brazilian cerrado, showed no pesticide contamination in the study area, because all pesticides were below the MQL method. On the other hand, atrazine residues in subsurface water samples were detected above the MDL. The atrazine contamination in subsurface water samples is associated with its application in the crops.
Acknowledgements
The authors thank the FAPESP (Fundação de Amparo a Pesquisa do Estado de São Paulo) (Project 2007/07337-0) for the financial support received and CNPq (Conselho Nacional de Desenvolvimento Científico e Tecnológico).
References
1. McCarthy, A. C.; Hancock, N. H.; Raine, S. R.; Comput. Electron. Agric. 2014, 101, 148.
2. Warren, N.; Allan, I. J.; Carter, J. E.; House, W. A.; Parker; A.;
Appl. Geochem.2003, 18, 159.
3. Tettenhorst, D. R.; Shoemaker, J. A.; Anal. Methods 2014, 6, 930.
4. Berlioz-Barbier, A.; Vauchez, A.; Wiest, L.; Baudot, R.; Vulliet, E.; Cren-Olive, C.; Anal. Bioanal. Chem.2014, 406, 1259.
5. Belenguer, V.; Martinez-Capel, F.; Masia, A.; Pico, Y.; J. Hazard. Mater. 2014, 265, 271.
6. Caldas, S. S.; Goncalves, F. F.; Primel, E. G.; Prestes, O. D.; Martins, M. L.; Zanella, R.; Quim. Nova 2011, 34, 1604. 7. Moreda-Pineiro, J.; Alonso-Rodriguez, E.;
Lopez-Mahia, P.; Muniategui-Lorenzo, S.; Prada-Rodriguez, D.; Romaris-Hortas, V.; Miguez-Framil, M.; Moreda-Pineiro, A.; Bermejo-Barrera, P.; TrAC, Trends Anal. Chem. 2009, 28, 110. 8. Sapozhnikova, Y.; J. Agric. Food Chem. 2014, 62, 3684. 9. Munaretto, J. S; Ferronato, G.; Ribeiro, L. C.; Martins, M. L.;
Adaime, M. B.; Zanella, R.; Talanta 2013, 116, 827. 10. Zeilhofer, P.; Lima, G. A.; Lima, E. B. R.; Santos, I. M.; Rev.
Pesq. Geocien.2008, 35, 23.
12. ABNT NBR 13.895: Construção de Poços de Monitoramento, ABNT: Rio de Janeiro, 1997.
13. Anastassiades, M.; Lehotay, S. J.; Stajnbaher, D.; Schenck, F. J.;
J. AOAC Int. 2003, 86, 412.
14. Birnhack, L.; Sabach, S.; Lahav, O.; Talanta 2012, 100, 12. 15. Raij, B.; Quaggio, J. A.; Cantarella, H.; Ferreira, M. E.; Lopes,
A. S.; Bataglia, O. C.; Análise Química do Solo para Fins de Fertilidade; Fundação Cargill: Campinas, 1987.
16. Kmellar, B.; Fodor, P.; Pareja, L.; Ferrer, C.; Martinez-Uroz, M. A.; Valverde, A.; Fernandez-Alba, A. R.; J. Chromatogr. A 2008, 1215, 37.
17. Marin, J. M.; Gracia-Lor, E.; Sancho, J. V.; Lopez, F. J.; Hernandez, F.; J. Chromatogr. A 2009, 1216, 1410.
18. Stahnke, H.; Kittlaus, S.; Kempe, G.; Alder, L.; Anal. Chem. 2012, 84, 1474.
19. Nanita, S. C.; Anal. Chem. 2013, 85, 11866.
20. Nascimento, J. A.; Levantamento Sistemático de Produção Agrícola: Município de Morrinhos-Goiás, Informações de 2010; IBGE - Agência Morrinhos: Goiás, 2011.
21. http://sitem.herts.ac.uk/aeru/iupac/Reports/43.htm, accessed in August 2015.
22. Sadler, E. J.; Sudduth, K. A.; Lerch, R. N.; Baffaut, C.; Kitchen, N. R.; Hydrol. Processes2014, 28, 210.
23. Cheremisinoff, N. P.; Rosenfeld, P.; Handbook of Pollution Prevention and Cleaner Production: Best Practices in the Agrochemical Industry; Elsevier: Amsterdam, 2010.
24. Castillo, M.; Carbonell, E.; González, C.; Miralles-Marco, A. In Pesticides - Recent Trends in Pesticide Residue Assay; Soundararajan, R. P.; InTech, Rijeka, Croatia, 2012, ch. 3. 25. Solomon, K. R.; Carr, J. A.; Du Preez, L. H.; Giesy, J. P.;
Kendall, R. J.; Smith, E. E.; Van der Kraak, G. J.; Crit. Rev. Toxicol. 2008, 38, 721.
26. Giddings, J. M.; Anderson, T. A.; Hall Jr, L. W.; Hosmer, A. J.; Kendall, R. J.; Richards, R. P.; Solomon, K. R.; Williams, W. M.;
Atrazine in North American Surface Waters: a Probabilistic Aquatic Ecological Risk Assessment; SETAC: North Carolina, 2005.
27. Food and Agriculture Organization of The United Nations (FAO); Nature and Management of Tropical Peat Soils, Rome, 1988.
28. Kovacic, D. A.; David M. B.; Gentry, L. E.; Starks, K. M.; Cooke, R. A.; J. Environ. Qual. 2000, 29, 1262.
29. Pinheiro, A.; Bertoldi, J.; Vibrans, A. C.; Kaufmann, V.; Deshayes, M.; Rev. Árvore2011, 35, 1245.
30. Romeh, A. A.; Hendawi, M. Y.; J. Agric. Sci. Technol. 2014,
16, 265.
Submitted: April 30, 2015 Published online: August 28, 2015