Brazilian Journal of Physics, vol. 35, no. 4B, December, 2005 1159
,
Dark Matter Profile in Clusters of Galaxies
Gast˜ao B. Lima Neto
Instituto de Astronomia, Geof´ısica e Ciˆencias Atmosf´ericas/USP Rua do Mat˜ao, 1226, 05508-090, S˜ao Paulo, Brazil
(Received on 5 November, 2005)
Using X-ray observation we have obtained the deprojected gas density and temperature profiles for a sample of cluster of galaxies. We show that cool-core clusters, which are expected to be the largest relaxed structures in the universe, have central steep mass density profiles, similar to the cold dark matter density profiles resulting from cosmological N-body simulation. We will present detailed results for two clusters, Abell 85 and 586.
I. INTRODUCTION
In a Universe where structures are formed hierarchically, as predicted by the ΛCDM scenario, larger objects are formed through merging and/or accretion of smaller systems and the most massive structures should be the latest to collapse and reach equilibrium. Today, massive clusters of galaxies are the upper limit of the mass function of (nearly) virialized struc-tures. This feature makes clusters well suited objects for the study of structure formation and the nature of dark matter, which is believed to play a major role in this process [e.g. 10, 26, 28].
Cluster of galaxies are composed of three main compo-nents:∼5% in mass is the optically luminous baryonic mat-ter in hundreds of bright galaxies (i.e.,L∼L∗, whereL∗≈
1010L⊙is the break of the luminosity function);∼15% is in the form of a bright X-ray inter-cluster gas; and the remaining ∼80% is in some non-baryonic dark matter.
Cluster masses can be estimated by several techniques, each one relying on different principles and simplifying hypothe-sis. Two techniques – the use of the virial theorem applied to the kinematics of the member galaxies and the observation of temperature and density of the X-ray emitting intra-cluster gas (ICM) – assume dynamical equilibrium. On the other hand, gravitational lensing, strong or weak, does not require such an assumption, but depending directly of the projected cluster mass, including fore- and back-ground mass along the line-of-sight [see the reviews by, e.g., 9, 15].
Consequently, the use of different techniques to measure mass distributions will likely give different mass estimates. This difference can be used as a probe of the dynamical his-tory of the cluster. Miralda-Escud´e & Babul [17] found a sys-tematic difference by a factor of∼2–3 between strong lens-ing and X-ray mass measurements, with the second method systematically producing smaller values. Allen [1] could interpret this discrepancy by comparing mass estimates for clusters with and without cooling flows. He found that, for cool-core clusters, X-ray and lensing mass estimates tend to agree, whereas for the latter the opposite happens. Then, he concluded that cool-core clusters are more dynamically evolved, while clusters without a cooler center have non-thermal process acting on them (shocks from cluster mergers, AGN activity, thermal conductivity, etc...) affecting the ICM.
Theoretical analysis andN-body cosmological simulations
of a cold dark matter dominated universe support the hierar-chical formation of structures. Analysis of the matter distri-bution on relaxed halos obtained in cosmological simulations show that the shape of the density profile seems to be steep, with a cuspy center – how steep is the density profile is a mat-ter of debate, but it is likely to be somewhere betweenρ ∝r−1 andρ ∝r−2.
An important effort exists in order to obtain and understand the total mass, gas density and temperature, specific entropy, baryon fraction profiles [see, e.g., in the past 2 years, 3, 20, 21, 23, 27].
Here, we investigate the shape of the total mass density pro-file using the standard hydrostatic equilibrium hypothesis with simple analytical gas density and temperature profiles. This allows us to easily obtain the 3D profiles needed to solve the Euler equation. Applications are made for two rich clusters of galaxies, Abell 85 and 586.
II. DENSITY AND TEMPERATURE DEPROJECTION
In order to deproject the observed 2D surface brightness, Σ(R), and the emission-weighted temperature, T2D(R), we will assume spherical symmetry.
The X-ray emission comes from a hot, rarified and ionized plasma with about 30–40% solar metal abundance (metal-licity). The bulk of the photons are emitted through the bremsstrahlung process [see, e.g., 24, for a comprehensive re-view]. The bolometric emissivity of such a plasma is:
ε(r) =K n2(r)T1/2(r), (1)
withK≈2.4×10⁻²⁷in CGS units. We take for simplicity the gaunt factor as a constant, g(T) =1.2. The above approxi-mation should be accurate forT >107KorkT >1 keV. For primordial gas (no metals) this approximation is very good, while for aZ⊙gas the approximation gets worse because there are other mechanisms occuring that cools the gas.
The 2D emission-weighted temperature can be writen as:
T2D(R) = 2K
Z∞
R
T(r)[n2(r)T1/2(r)]√r dr
r2−R2 2K
Z ∞
R [
n2(r)T1/2(r)]√r dr
r2
−R2
1160 Gast˜ao B. Lima Neto
Such temperature corresponds to the temperature we mea-sure using X-ray observations. The denominator of the above equation is the surface brightness, i.e:
Σ(R) =2K
Z ∞
R [
n2(r)T1/2(r)]√r dr
r2−R2. (3) Therefore we have a system of two equations and two un-known functions:
Σ′(R)T2D(R) = 2
Z∞
R
T3/2(r)n2(r)√r dr
r2−R2 Σ′(R) = 2
Z∞
R
T1/2(r)n2(r)√r dr
r2−R2 (4)
whereΣ′(R) =Σ(R)/Kis the normalized surface brightness.
The above equations can be solved with the Abel transform, such as:
g(x) = 2Rx∞h(y)√y dy
y2−x2 h(y) = −π1Ry∞
³∂ g ∂x ´ dx √
x2−y2.
(5)
Then, the solutions for the 3D quantities are:
T1/2(r)n2(r) =
−π1
Z ∞
r
µ∂Σ′(R) ∂R
¶ dR
√
R2−r2 T3/2(r)n2(r) = −1
π
Z ∞
r
µ∂[Σ′(R)T
2D(R)] ∂R
¶ dR
√
R2−r2 (6)
Finally solving for the deprojected (3D) function, we obtain the temperature:
T(r) =
Z ∞
r
µ∂[Σ′(R)T
2D(R)] ∂R
¶ dR
√
R2−r2
Z ∞
r
µ∂Σ′(R) ∂R
¶ dR
√
R2−r2
. (7)
and the number density:
n(r) =
( −1 πp
T(r)
Z ∞
r
µ∂Σ′
(R)
∂R
¶ dR
√
R2
−r2
)1/2
. (8)
Except for very special cases, the above de-projected pro-files will be rather cumbersome functions. Numerical solu-tions, however, involve the evaluation of only two integrals.
We will assume two projected analytical profiles for the ob-served quantities. The surface brightness is given by
Σ(R) =Σ0exp
£
−(R/a)ν¤
, (9)
the well known S´ersic profile shown by Demarco et al. [4] to be a good description of cool-core clusters, and the tempera-ture profile used by Durret et al. [8]:
T2D(R) =T0+2T0
p
R/rt
1+ (R/rt)2
, (10)
which represents well the shape of cool-core clusters of galax-ies temperature profile, with a steep rise from the center and a slow decrease outwards.
III. ABELL 586
Abell 585 is a regular cluster atz=0.17. This cluster was recently observed both with GMOS at Gemini-North and the Chandrasatellite [see 2, for details]. With these observations, it was possible to determine the total cluster mass with the three independent methods described above: weak lensing, hydrostatic equilibrium and virial theorem.
The comparison of independent mass determination meth-ods show us that indeed, in a relaxed cluster, all methmeth-ods should give approximate the same result. The differences can be ascribed to the particular bias of each method. Figure 1 shows the comparison of the different mass determinations.
0 1 2 3 4 5 6 7
0 200 400 600 800 1000 1200 1400
Mass [10
14 solar units]
R [h
70 –1 kpc]
0 0.02 0.04 0.06 0.08 0.1 0.12
0 100 200 300 400 500
Baryon fraction
R [arcsec] isothermal polytrope AMD strong lensing isothermal polytrope gas mass Virial
FIG. 1: Abell 586 mass determination using different methods. The agreement between the mass profiles is better than 1σ. The lines la-beled isothermal and polytrope correspond to different adopted tem-perature profiles. AMD is aperture mass densitometry, a technique that employs weak lensing.
Using the X-ray emitting gas as a tracer of the mass is both accurate and provides us with a good spatial resolution and reach farther than other methods. For this cluster – given its distance and the short exposure time of the X-ray observation – we cannot resolve the central region where a cool-core is expected to be present is this is a relaxed cluster. We can, however, trace the temperature profile almost to the virial ra-dius and conclude that the gas temperature is well modeled by a polytropic equation of state.
As is usually the case, the cluster mass is dominated by dark matter, with an estimated baryon fraction≈0.12, assuming a polytropic temperature profile.
IV. ABELL 85
Brazilian Journal of Physics, vol. 35, no. 4B, December, 2005 1161
extensive redshift and imaging catalogues [5, 25]; the mean galaxy redshift of Abell 85 isz=0.0555; at this redshift, 1 arcmin=90.5h−1
50 kpc, assumingΩM=0.3,ΩΛ=0.7. With this kind of resolution we can probe the inner region of the cluster. It comprises a main cluster, a south blob (a group at the same redshift), a brighter zone south-west of the cluster center coinciding with a Very Steep Spectrum Radio Source relic (hereafter the VSSRS) and an extended filament at least 4 Mpc long. This filament was first discovered with ROSAT by Durret et al. [6] and confirmed by XMM-Newton [7]; it is likely to be a chain of several groups of galaxies, falling on to the main cluster.
For this cluster, we have an accurate temperature and sur-face brightness profiles, obtained with both XMM-Newton andChandra. Fitting the observed profiles and deprojecting we obtain the 3D quantities. Fig. 2 shows the temperature fit and the 3D deprojection.
2 3 4 5 6 7 8
0 200 400 600 800 1000
0 2 4 6 8 10
T3D (computed) T2D (fitted) Chandra XMM BeppoSAX
kT
[keV]
R [h50–1 kpc]
R [arcmin]
FIG. 2: Abell 85 temperature profile obtained with BeppoSAX, XMM-Newton, and Chandra. The 2D temperature fit is the full line; the computed 3D temperature is the dashed line.
10-6 10-5 10-4 10-3 10-2 10-1 100
10 100 1000
0.1 1 10
ρdyn
[
M
pc
–3]
R [h50–1kpc]
NFW
available data
R [arcmin]
Moore 99
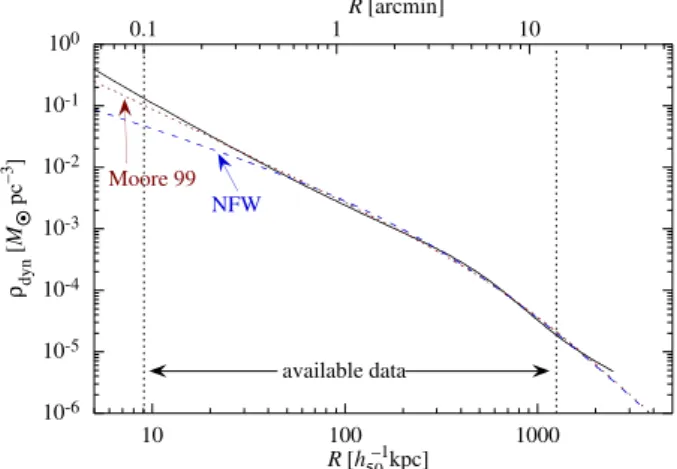
FIG. 3: Dynamical mass density as a function of radius derived from our data:ρdyn∝r−1.9(full line) and compared to a Navarro et al. [19]
model (dashed line) and to a Moore et al. [18] profile (dotted line). The two vertical dotted lines indicate the spatial resolution (left) and the limit of our data (right).
Abell 85 is relaxed in the centre, but shows clear signs of recent mergers. It has a cool-core and the brightness profile is well fitted by a cuspy profile – the S´ersic profile [8].
Consequently, the total mass density profile (Fig. 3) is as cuspy as theΛCDM cosmological N-body simulations pre-dictions. Moreover, a fit of the NFW profile [19] gives a con-centration parameterc≈5 .
In fact, if the cluster presents a cool-core, the brightness profile must be steep, so that the total mass is always positive. In other words, if the brightness profile is indeed aβ-model (with a central, flat core), then the cluster cannot have a de-creasing temperature profile towards the center.
10 100 1000
10 100 1000
0.1 1 10
kT
ne
–2/3
[
h50
–1/3
keV cm
2]
r [h50–1kpc] “entropy”
R [arcmin]
FIG. 4: Gas “entropy” profile; the dotted line corresponds to a self-similar entropy profile.
The gas “entropy” profile is shown in Fig. 4, right panel. We call “entropy”, following the trend in cluster literature, S≡kT/n2/3, which is related to the true measure of the gas specific entropy, e.g., Metzler & Evrard [16]. The entropy profile shown here was derived from the surface brightness and temperature analytical fits, cf. [8].
The bulk of the cluster shows a power-law entropy profile, withS∝R0.9, close to the relationS∝R0.95found by Piffaretti et al. [21] for a sample of 13 “cool-core” clusters. The profile slightly flattens near the center; however, down to the limit-ing resolution (∼8 arcsec) there is no indication of an entropy floor, as seen in some groups and clusters [e.g., 13, 14, 27], reaching a value as low as 20h−501/3keV cm2atR=10h−1
50kpc. Nevertheless, the entropy value estimated at R=0.1Rvirial (Rvirial=2h−501Mpc for Abell 85 is S≈200h−501/3keV cm2, comparable to the values derived by, e.g., Lloyd-Davies et al. [13].
1162 Gast˜ao B. Lima Neto
V. CONCLUSION
Recent high resolution, sensitivity X-ray observations of rich clusters of galaxies have shown that cool-core clusters have steep gas density profiles. For the clusters with enough spatial resolution, the temperature profile of these clusters de-creases towards the center, reaching a value around∼Tmean/3 (Tmean is the mean emission-weighted temperature of the whole cluster. These two profiles, steep density and falling temperature in the center, implies a steep total mass profile if the hydrostatic hypothesis holds.
The cool-core clusters are relaxed structures, while non cool-core clusters show almost always show signs of inter-action. Therefore, a central steep total mass (density) profile seems to be a characteristic of the most massive, relaxed struc-tures in the universe.
The steep matter profile observed in objects,M∼1015M⊙ is in agreement with cosmological (Λ)CDM models and lens-ing measures. Nevertheless, steep profile is not observed in
galaxies, i.e., virialized objects withM<1012M⊙, as indi-cated by the Tully-Fisher relation and the near absence of dark matter at the solar neighborhood. Perhaps something happens at the groups/poor cluster scale that is not taken into account properly in cosmological simulations. Baryon physics is now being currently used in simulations but we still lack precise knowledge on, e.g., stellar formation, SN feedback. This tran-sition from steep to flat dark matter profile may also be related to the substructure problem in dark haloes: Local Group like objects present much more halos in simulations than are actu-ally observed.
Acknowledgments
I wish to thank my collaborators F. Durret, E. Cypriano, L. Sodr´e, and W. Forman. This work is partially support the FAPESP, CAPES/Cofecub french-brazilian cooperation, and CNPq.
[1] S. W. Allen, MNRAS,296, 392 (1998).
[2] E. S. Cypriano, G. B. Lima Neto, L. Sodr´e Jr., J.-P. Kneib, and L. E. Campusano, ApJ630, 38 (2005).
[3] De Grandi S., Molendi S., 2004, in: “Outskirts of Galaxy Clus-ters: Intense Life in the Suburbs”, IAU Coll. 195, 134, Ed. A. Diaferio, (astro-ph/0407392)
[4] R. Demarco, F. Magnard, F. Durret, and I. M´arquez, A&A407, 437 (2003).
[5] F. Durret, P. Felenbok, C. Lobo, and E. Slezak, A&A Suppl. 129, 281 (1998a).
[6] F. Durret, W. Forman, D. Gerbal, C. Jones, and A. Vikhlinin, A&A335, 41 (1998b).
[7] F. Durret, G. B. Lima Neto, W. Forman, and E. Churazov, A&A 403, L29 (2003).
[8] F. Durret, G. B. Lima Neto, and W. Forman, A&A432, 809 (2005).
[9] B. Fort and Y. Mellier, A&A Review,5, 239 (1994).
[10] G. Kauffmann, J. M. Colberg, A. Diaferio, and S. D. M. White, MNRAS,303, 188 (1999).
[11] G. B. Lima Neto, V. Pislar, F. Durret, D. Gerbal, and E. Slezak A&A327, 81 (1997).
[12] G. B. Lima Neto, V. Pislar, and J. Bagchi, A&A 368, 440 (2001).
[13] E. J. Lloyd-Davies, T. J. Ponman, and D. B. Cannon, MNRAS 315, 689 (2000).
[14] I. G. McCarthy, G. P. Holder, A. Babul, and M. L. Balogh, ApJ
591, 526 (2003).
[15] Y. Mellier, ARA&A,37, 127 (1999).
[16] C. A. Metzler, A. E. Evrard, ApJ437, 564 (1994). [17] J. Miralda-Escud´e and A. Babul, ApJ,449, 18 (1995). [18] B. Moore, S. Ghigna, F. Governato, et al., ApJLett524, 19
(1999).
[19] J. F. Navarro, C. S. Frenk, and S. D. M. White, ApJ490, 493 (1997)
[20] D. M. Neumann, A&A439, 465 (2005).
[21] R. Piffaretti, Jetzer, Ph., J. S. Kaastra, and T. Tamura, A&A 433, 101 (2005).
[22] V. Pislar, F. Durret, D. Gerbal, G. B. Lima Neto, and E. Slezak, A&A322, 53 (1997).
[23] E. Pointecouteau, M. Arnaud, and G. W. Pratt, A&A435, 1 (2005).
[24] C. L. Sarazin, 1988, “X-ray emissions from cluster of galaxies”, Cambridge Astrophysics Series
[25] E. Slezak, F. Durret, J. Guibert, and C. Lobo, A&A Suppl.128, 67 (1998).
[26] V. Springel, S. D. M. White, A. Jenkins, C. S. Frenk, et al., Nature435, 629 (2005).
[27] A. Vikhlinin, M. Markevitch, S. S. Murray, C. Jones, W. For-man, and L. Van Speybroeck, ApJ628, 655 (2005).