Bol. Ciênc. Geod., sec. Artigos, Curitiba, v. 23, no2, p.338 - 351, abr - jun, 2017.
Article
DETERMINATION OF POTENTIAL AREAS FOR RESETTLEMENT OF
FAMILIES AFFECTED BY THE SÃO FRANCISCO RIVER
INTEGRATION PROJECT USING GEOTECHNOLOGIES
Determinação de áreas com potencial para o reassentamento de famílias
atingidas pelo Projeto de Integração do Rio São Francisco utilizando
geotecnologias
Wesley de Andrade Vilela 1 Rejane Ennes Cicerelli 2 Tati de Almeida 2
Gervásio Barbosa Soares Neto 3 Leonardo Zandonadi Moura 2
1 Ministério da Integração Nacional, Brasília, Distrito Federal, Brasil.
E-mail: [email protected];
2 Universidade de Brasília. Instituto de Geociências, Brasília, Distrito Federal, Brasil.
E-mails: [email protected], [email protected]; [email protected]
3 Instituto Federal de Brasília. Brasília, Distrito Federal, Brasil.
E-mail: [email protected]
Abstract:
The São Francisco River Integration Project is an infrastructure work conducted by the Brazilian federal government, aiming to guarantee water resources security to 390 municipalities, benefitting about 12 million people that suffer with water scarcity in one of the driest regions in the country. This work presents the method and tools used to evaluate land suitability for rural resettlement of displaced families. All with the intent of mitigating socioeconomic impacts for one of the annex channels in the main project axis, considering legal and technical criteria. Using geoprocessing tools, 4490 hectares of land were effectively identified as best suited for this purpose, helping public managers to promptly decide the adequate course of action.
Keywords: Geoprocessing, multicriteria analysis, AHP, rural settlements, resettlement.
Resumo:
de terras que, dentro dos critérios e para a região estudada, possuem as melhores condições para esse fim. Pode-se concluir que o estudo permitiu a identificação das melhores áreas para restabelecer as famílias afetadas, além de auxiliar o gestor público nas decisões com agilidade que sua função exige.
Palavras-chave: Geoprocessamento, análise multicritério, AHP, assentamentos rurais, reassentamentos.
1.Introduction
Construction works generate negative social and environmental impacts, which can be eliminated, minimized and controlled by sound environmental management practices. These actions and procedures maintain or improve local environmental quality and livelihoods, when performed adequately (Rios, 2014).
The São Francisco River Integration to Notheastern Watersheds Project (Projeto de Integração do Rio São Francisco com Bacias Hidrográficas do Nordeste Setentrional – PISF, in
Portuguese) was rationally designed and environmentally oriented. However, it still brings some negative socioenvironmental impacts for the populations residing on construction sites on its path.
Brazilian legislation includes guidelines, criteria and procedures for the relocation and resettlement of populations affected by infrastructure works. This was established by a work group formed by ministries (federal agencies), with public participation, and is applied by the Ministry of National Integration, which is responsible for the project.
The program establishes that a new productive basis must be provided so that livelihoods are improved, or at least maintained, for affected populations. This is accomplished by the Union through the acquisition of rural areas, along with construction of community and production infrastructure. Selection of suitable resettlement areas is not a trivial task, for it involves the integrated analysis of spatial and alphanumeric variables, which should indicate locations for the establishment of villages in a coherent and objective way.
Spatial Decision Support Tools are defined as interactive systems aiming to aid the user in attaining high levels of effectiveness in the decision making process for semi-structured spatial decision problems (Malczewski, 1999), and may be promising options to treat the resettlement issues. Multicriteria analysis is a relevant example, enabling the attribution of relative values to each factor in the process of characteristics aggregation. Applications range from the generation of erosion susceptibility maps (Valladares et al., 2012), selection of agricultural areas for crops
(Vieria & Curi, 2015), areas for universities (Castro et al., 2015), or priority areas for land use
adjustment (Sartori et al., 2011).
Bol. Ciênc. Geod., sec. Artigos, Curitiba, v. 23, no2, p.338 - 351, abr - jun, 2017.
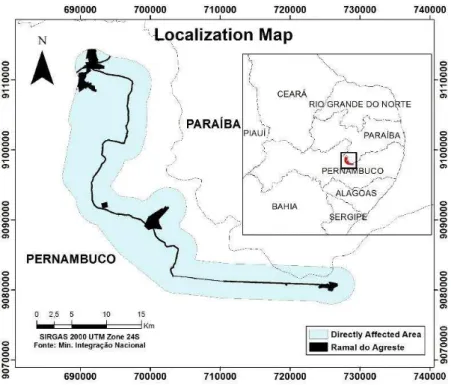
2.Study Area Characterization
The project region is located on the northeast of Brazil, state of Pernambuco, municipalities of Sertânia and Arcoverde. It is referred to as Drought Polygon (Polígono da Seca, in Portuguese), for its low pluviometry (approximately 566 mm/year). There are many months with no rain through the year, which hinders its socioeconomic development and causes outmigration.
The study area has 46129 hectares, consisting of a 5 km wide range from the Ramal do Agreste works, that will be directly affected. This 69 km long stretch of channel will supply water from the east axis of the São Francisco integration project to the Ipojuca and Moxotó river basins. It
has been the target of a public utility decree and expropriation works by Brazil’s federal
government (MI, 2006).
Figure 1: Study Area Location - Ramal do Agreste. Source: Ministério da Integração Nacional
3. Materials And Methods
A survey on selection criteria for family resettlement was the first step. Regional aptitude for agricultural production, slope, distance from channel path, human occupation, technical and legal restriction were selected, amongst the listed possibilities. We have used data with scale 1:100000, which satisfy the Brazilian cartographic exactitude standard PEC Class A.
(1980). The process systematically evaluates alternatives for decision making, comparing them pairwise, under each criterion or attribute. The comparison may utilize concrete data from the alternatives or human judgements as input information (Saaty, 1980).
This analysis transforms comparisons that are commonly empirical into numerical values for comparison. The weight of each factor allows the evaluation of each element within the defined hierarchy. This capacity of converting empirical data into numerical values is the main differential of AHP regarding other techniques (Saaty, 2008).
Values were attributed using the Saaty (1980) scale, comprising absolute numbers that give quantitative and qualitative values to decision-makers (Table 1). The expertise of professional and researchers in this area was used to define if the scale is appropriate, through questions that defined the importance intensity of each criterion.
Table 1: Saaty (1980) Scale, with 9 fundamental weights for comparison.
Source: Adapted from Carvalho & Mingoti (2005).
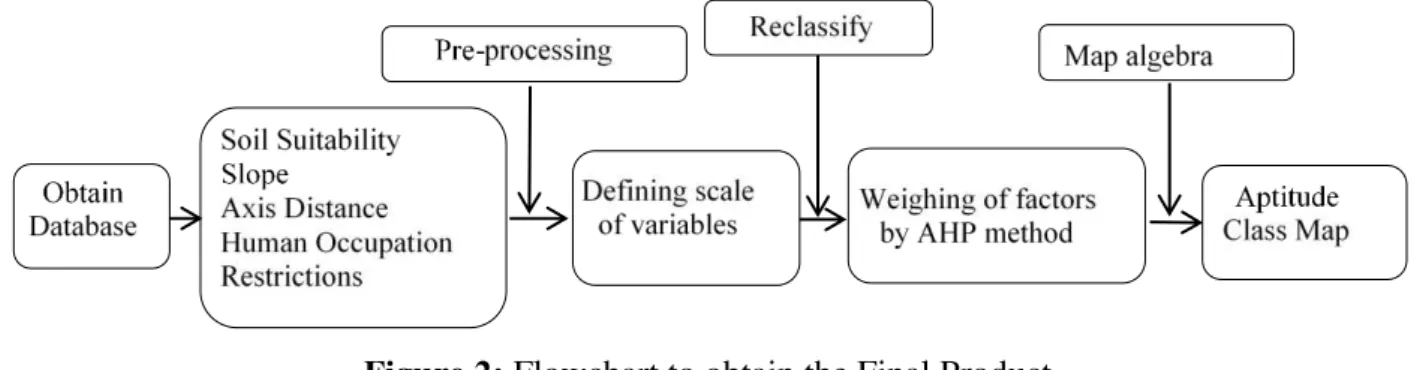
The proceedings were done with Reclassify tool to consider the intensity of importance and Raster Calculator tool to map algebra, both of ArcGis 10.3. Figure 2 shows flowchart, with main
stages.
Figure 2: Flowchart to obtain the Final Product
Procedures for each thematic criterion map and AHP method weighting are presented in the following sections.
Importance Definition Explanation
1 Importance Equivalent contribution to the goal
3 Moderate Importance A slightly favorable objective to the detriment of another.
5 Strong Importance A strongly favorable objective, to the detriment of another.
7 Very Strong Importance A very strongly favorable objective, to the detriment of another; Dominance demonstrated by practice.
9 Absolute Importance Is the largest possible affirmation order when comparing two objectives.
2,4,6,8 Iintermediate Values (between two intensities of importance)
Bol. Ciênc. Geod., sec. Artigos, Curitiba, v. 23, no2, p.338 - 351, abr - jun, 2017.
3.1 Slope Criterion
The topographic classification is strongly significant in the definition of best areas for resettlements, for it is closely related to agricultural practices (Ramalho Filho et al., 1983). It
defines limitations on the use of agricultural implements, agricultural aptitude and susceptibility to erosion.
Ramalho Filho and Beek (1994) consider areas with slopes smaller than 20% apt for agricultural use, for they have less susceptibility to erosion and little impediment to mechanization, depending on soil conditions. Areas with stronger (from 20 to 45%) slopes present high chance of erosion, which is very costly to control.
Altimetry data was obtained with a 30 meters spatial resolution, from Shuttle Radar Topography Mission (SRTM) images, available from the U.S. Geological Survey. The data range was divided in four slope classes (Table 2), according to the land use limitation, originating a slope map.
Table 2: Framing of relief classes and their Importance Intensity.
Source: Adapted from EMBRAPA (1979).
3.2 Soil Suitability Criterion
Agricultural land evaluation has the goal of indicating agricultural potential for different uses. A favorable cost/benefit relation is required, under the economic and environmental standpoints (Ramalho Filho et al., 1983). Aptitude interpretation was performed through the Brazilian
methodology from the Pedology Division and Soil Fertility in the Ministry of Agriculture (Bennema et al., 1965), currently an Embrapa center (Centro Nacional de Pesquisa de Solos –
CNPS), improved by SUPLAN-MA, with Food and Agriculture Organization of the United Nations (FAO) technical assistance (Ramalho Filho & Beek, 1994).
The main characteristic taken into account in the establishment of soil importance classes is the soil maturity or development stage (Crepani et al., 2001). Thereby, older and more intemperized
soils are better by agricultural factors, because of their greater deepness and porosity, as well as environmental factors, like their smaller vulnerability to productive use. We have arrived at the classes and Importance Intensities displayed on Table 3 using a soil map with scale 1:100000, elaborated by Embrapa. In this case, based on soil types present in the region, the soil suitability criterion has not been assigned an intensity of importance above strong importance for settlers’
family production..
Slope (%) Relief Importance Intensity
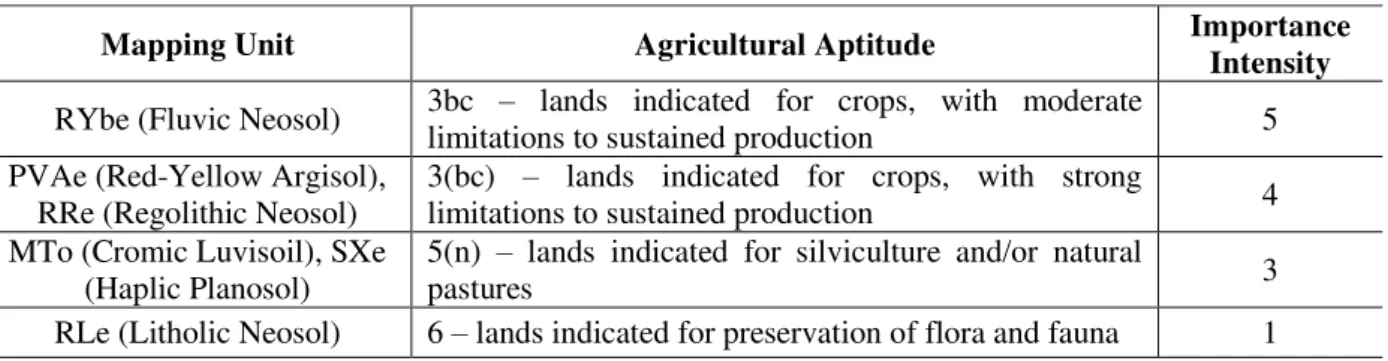
Table 3: Agricultural Aptitude by soil mapping unit and Importance Intensity.
3.3 Human Occupation Criterion
Human occupation is an extremely important factor in the choice of areas for acquisition, as higher population densities, excluding urban centers, indicate the presence of small rural landholdings. Acquisition of land with this characteristic goes against the program’s goal, for it may generate even greater demand for resettlement of expropriated small landholders, besides the greater amount of improvements, which generate onerous indemnities.
The 2010 Brazilian census from IBGE (Instituto Brasileiro de Geografia e Estatística, the census bureau) digital grid was used to elaborate the map (IBGE, 2010). This dataset indicates the population by 1 km² area. 1044 polygons cover the study area, and their centroids were used in the creation of a surface, through the Kriging interpolation technique. Kriging assumes that the distance or direction between sample points reflects a spatial correlation that can be used to explain variation in the surface. The predicted values are derived from the measures of relationship in samples using a weighted average technique (Longley et al., 2013).
We describe the importance intensity related to the population per unit area on Table 4.
Table 4: Population per Unit Area and Importance Intensity.
3.4 Horizontal Distance from Channel Axis Criterion
The procedures on the resettlement program for the São Francisco River Integration Project state that selected areas must be within a 2.5 km radius from the channel margins (MI, 2010), having potential for rainfed or irrigated agriculture. This distance enables the supply of water from the channel to the village, and coincides with public interest areas defined by a Federal Government decree. The larger the distance from the channel, the more costly to implement a pipeline and
Mapping Unit Agricultural Aptitude Importance Intensity
RYbe (Fluvic Neosol) 3bc limitations to sustained production – lands indicated for crops, with moderate 5 PVAe (Red-Yellow Argisol),
RRe (Regolithic Neosol)
3(bc) – lands indicated for crops, with strong
limitations to sustained production 4 MTo (Cromic Luvisoil), SXe
(Haplic Planosol)
5(n) – lands indicated for silviculture and/or natural
pastures 3
RLe (Litholic Neosol) 6 – lands indicated for preservation of flora and fauna 1
Population / Km² Importance Intensity
0 9
0 - 5 8
5 - 10 7
10 - 15 3
Bol. Ciênc. Geod., sec. Artigos, Curitiba, v. 23, no2, p.338 - 351, abr - jun, 2017. water supply system for human consumption and irrigation. Therefore, three buffer zones were defined around the channel, and given importance intensities as stated on Table 5.
Table 5: Distance from Channel Axis and Importance Intensities.
3.5 Legal and Technical Restrictions Criterion
Brazilian legislation demands that a buffer area or Permanent Preservation Area (Área de Preservação Permanente – APP, in Portuguese) around water bodies be protected with native vegetation. These areas were considered restricted for resettlement, along with those expropriated by the Federal Government for the channel construction, reservoirs, roads and urban perimeters. Thereby, inappropriate areas for agricultural exploitation by these criteria were given 0 (zero) importance intensity.
3.6 Weighing of factors by AHP method
The relative importance among the criteria was judged according to the Analytical Hierarchy Process (AHP) proposed by Saaty (1980), after the definition of classes and importances within of each criterion.
Saaty’s (1980) AHP method is a technique based on the paired comparison logic. On it, all
factors influencing decision-making are paired and compared. The criteria are hierarchically organized, according to an importance value for a factor above others, and then compared between themselves (Silva & Nunes, 2009). An empirical analysis on pairs of criteria allows the stipulation of a value that represents relationships among them (Figure 3).
Distance from Channel Axis (m) Importance
0 – 1000 5
1000 - 2000 3
Figure 3: Hierarchical model for the application of AHP method.
The method is based in a square comparison matrix between the “n” criteria (factors) placed on
the lines and columns on the same order. Thus, the values placed on cells correspond to the relative importance among criteria, where cell (aij) is the importance of criterion on line (i) against the (j) column criterion. Since it is a symmetrical matrix, it is only necessary to fill the lower triangular half, and the main diagonal takes unit values (Silva et al., 2004). Table 6
exhibits paired variable in which the scale is used to compare the relation between the set of variables. For example, Table 6 shows that entry 5 in the (slope, distance form Axis) position means that “slope” is 5 times more important than “distance from Axis”.
The priorities, obtained in exact form by raising the matrix to large powers and summing each row and dividing each by the total sum of all the rows, or approximately by adding each row of the matrix and dividing by their total, are shown at Table 7 with the true values expressed in relative form by dividing each variable by the sum of all variables.
Table 6 presents the interaction matrix and Table 7 the final weights given to the variables.
Table 6: Paired variable comparison matrix.
Slope Aptitude Soil Occupation Human from Axis Distance
Slope 1 2 3 5
Soil Aptitude 1/2 1 2 4
Human Occupation 1/3 1/2 1 2
Bol. Ciênc. Geod., sec. Artigos, Curitiba, v. 23, no2, p.338 - 351, abr - jun, 2017.
Table 7: Variable final weights obtained through comparison matrix.
The matrix consistence ratio was also calculated, obtaining a value of 0.0078, which is adequate by the Saaty and Vargas (1991) criterion, by which it should be less than 0.1, indicating that matrix evaluations were randomly generated. Having obtained the factor weights, we went on to using map algebra to perform a weighted sum of intermediate criterion maps.
The resulting map was then multiplied by a binary map where other restrictions such as areas protected by law (riparian zones, water body margins and others), water surfaces, roads, urban perimeters and expropriated channel area were marked as unsuitable for agricultural exploitation and excluded.
The final resettlement aptitude map was then standardized to a scale between 0 and 255 bytes, and classified in five ranges (Unsuitable, Restricted Aptitude, Low Aptitude, Average Aptitude and High Aptitude) with arbitrarily defined class breaks on 0, 60, 130, 190 and 255, varying between unfit (0) and most suited (255). These intervals were defined choosing proportional quantities of each category. The categories names were chosen taking account the terms used in Ministry of National Integration.
We arrived then at the Resettlement Aptitude map, by which viable areas were identified. Only areas belonging to the High Aptitude class were selected. They were extracted and intersected with a grid with 316.2 by 316.2 meters, or 10 hectares. Another selection was performed, for grid cells that had at least 90% of their area on the High Aptitude class.
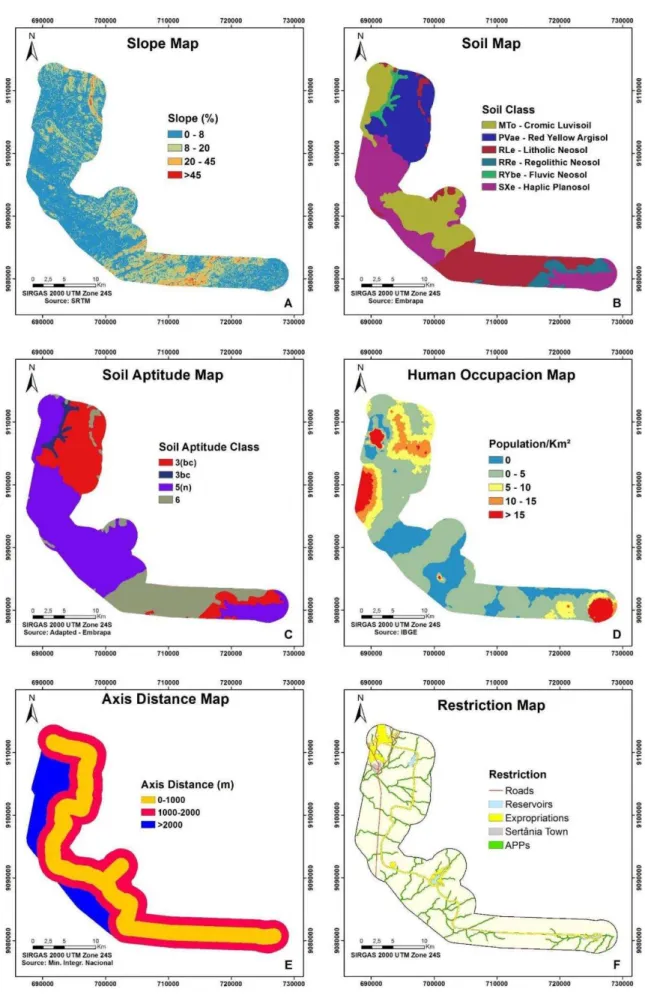
4. Results and Discussion
Individual criterion maps are presented on Figure 3. One can identify steep slopes, above 40%, on the Southern part of panel A. Those regions coincide with the poorest soils, of the Litholic Neosol class (Figure 4-B), or those indicated as class 6 – Lands proper for conservation of fauna and flora, also of low agricultural aptitude. On the other hand, northwest and central portions of the map have flat areas (below 8% slope), with better soils and agricultural aptitude. More populated areas are observable on Figure 4-D, on the northwest and southern most parts of the map, where regional communities are situated, as well as the Sertânia town (Figure 4-F). Figure 4-F displays areas with restrictions, encompassing expropriated areas for the construction of Ramal do Agreste channel, urban zone of the Sertânia municipality, Preservation Areas, roads and reservoirs.
Variables Weights
Slope 0.4758
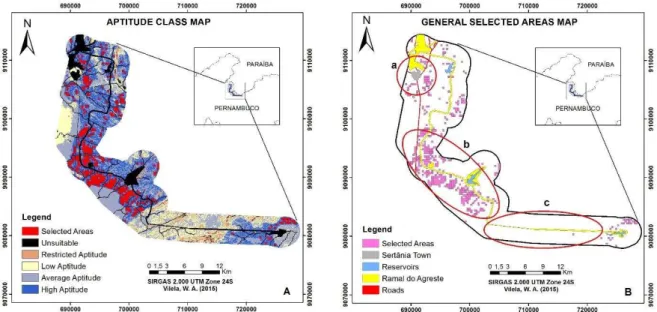
Bol. Ciênc. Geod., sec. Artigos, Curitiba, v. 23, no2, p.338 - 351, abr - jun, 2017. Through this method, 4490 hectares with at least 90% High Aptitude portions were selected, from the 46140 analyzed. Therefore, about 10% (449) of all 10 hectare cells may be used for resettlement (Figure 5).
Figure 5: (A) Aptitude Class Map and selected 10 ha areas and (B) General Selected Areas Map displaying important decision factors such as consumer centers, reservoirs, channel and roads.
We can see on Figure 5-B that, coherently with given weights, most selected areas are within a 1000 meters radius from the channel axis, and on slopes of up to 8%. There is also some concentration of areas around the town of Sertânia, Pernambuco, on the northern part of the study area. The distance of approximately 1.5 km from the town was caused by the Human Occupation criterion, that discarded areas that would be most onerous for acquisition, being more valued in the market and having more reproductive and non-reproductive improvements. A large area in the final third of the channel stretch, with steep slopes and poor soils, was completely eliminated. The construction works will go through that area with tunnels and aqueducts.
Figure 6: Graph with percentages from the total area corresponding to Aptitude Classes. Public managers were able to select enough contiguous 10-hectare areas for the resettlement
using this work’s conclusions. Besides the already mentioned criteria, the number of resettled
farming), plus 20% of the landholding being reserved for natural vegetation. Our evaluation is that the best region for the installation of a rural settlement is located on the central part of the channel path – region b of Figure 5-B. There are enough contiguous 10 ha areas that are up to 1000 meters away from the channel, close to a highway and a water reservoir.
5. CONCLUSION
Multicriteria Analysis along with Geographic Information Systems have proven to be efficient tools for the choice of places with potential for rural settlement installation. These decision support tools give public managers a fast and cost-effective targeting mechanism for best areas. The locations chosen through the proposed methodology are the most suitable from a technical perspective, which is not the only aspect to consider in public policy and action. Managers must
also consider their own capacity for analysis and empirical knowledge of the region’s social and
environmental characteristic. In addition, a final decision on settlement location must be preceded by field inspections.
In the central region of the channel’s path there are 290 polygons with 10 hectares area that
combine desirable characteristics such as flat or smoothly undulated relief, little population, proximity to the channel, a federal highway (BR-110) and a reservoir to be built in the Ramal do Agreste channel works.
This method may be used in other stretches of the São Francisco River Integration Project, as well as other regions and kinds of resettlement. Other criteria and restrictions can be applied, giving the technique flexibility to handle special settings and systematize different manager preferences.
ACKNOWLEDGEMENT
To the University of Brasilia (UnB) Graduate Program on Geosciences. To ESRI for making the ArcGIS 10.x tool package available through the contract #2011 MLK 8733. To the IMAGEM company for the support and fulfillment of the term of usage between the Geosciences Institute and ESRI and software support services.
REFERENCES
Bennema, J., Beek, K. J., Camargo, M. N. 1965. Interpretação de levantamento de solos no Brasil: um sistema de classificação de capacidade de uso da terra para levantamentos de reconhecimento de solos. Rio de Janeiro: DPFS/DPEA/FAO.
Bol. Ciênc. Geod., sec. Artigos, Curitiba, v. 23, no2, p.338 - 351, abr - jun, 2017. Castro, J. de S., Costa, L. S., Barbosa, G. R., Assemany, P. P., Calijuri, M. L. Utilização de SIG e análise multicritério para seleção de áreas com potencial para a construção de universidades e loteamentos universitários; BCG - Boletim de Ciências Geodésicas,21 (2015), pp 652 - 657.
Crepani, E., Medeiros, J. S. de, Hernandez Filho, P., Florenzano, T. G., Duarte, V., Barbosa, C. C. F, 2001. Sensoriamento Remoto e Geoprocessamento Aplicados ao Zoneamento Ecológico-Econômico e ao Ordenamento Territorial - INPE-8454-RPQ/722. São José dos Campos: INPE,
Available at: <http://www.dsr.inpe.br/laf/sap/artigos/CrepaneEtAl.pdf> [acessed 26 February 2016].
Embrapa. Manual de métodos de análise de solo, 1979. [pdf] Rio de Janeiro: Embrapa.
Available at: < https://www.agencia.cnptia.embrapa.br/Repositorio/Manual+de+Metodos 000fzvhotqk02wx5ok0q43a0ram31wtr.pdf> [accessed 9 September 2015].
Instituto Brasileiro de Geografia e Estatística (IBGE), 2010. Sistema IBGE de Recuperação Automática - SIDRA 2000-2010. Rio de Janeiro: IBGE. Available at: <http://www.sidra.ibge.gov.br> [accessed 9 September 2016].
Longley, Paul a., Goodchild, Michael, F., Maguire, David, J., Rhind, David, W. 2013. Sistemas e Ciência da Informação Geográfica. Porto Alegre: Bookman.
Malczewski, J.1999. GIS and Multicriteria Decision Analysis. New York: John Wiley and Sons.
Ministério da Integração Nacional (MI). 2006. Relatório de Impacto Ambiental do Ramal do Agreste: programas ambientais. Brasília: Ministério da Integração Nacional.
Ministério da Integração Nacional (MI). Programa Básico Ambiental de Reassentamento das Populações (PBA 08): programas ambientais. Brasília: Ministério da Integração Nacional.
Ramalho Filho, A., Pereira, E.G., Beek, K.J. 1983. Sistema de avaliação da aptidão agrícola das terras. Rio de Janeiro: Embrapa.
Ramalho filho, A., Beek, K.J. 1994. Sistema de avaliação da aptidão agrícola das terras. Rio de
Janeiro: Embrapa.
Rios, M. B. C. 2014. Estudo de Aspectos e Impactos Ambientais nas Obras de Construção do Bairro Ilha Pura - Vila dos Atletas. Rio de Janeiro: UFRJ/Escola Politécnica.
Saaty, T. L. 1980. The Analystic Hierarchy Process: planning, priority setting, resource allocation. New York: Mcgraw-hill.
Saaty, T.L., Vargas, L.G. 1991. Prediction, Projection and Forecasting. Boston: Kluwer
Academic.
Saaty, T. L. 2008. Decision making with the analytic hierarchy process. Int. J. Services Sciences
1(1), pp. 83-98.
Sartori, A. A. C., Nossack, F. A., Moraes, D. A. C., Dantas, M. J. F., Silva, R. F. B., Zimback, C. R. L. 2011. Definição de áreas prioritárias à adequação do uso da terra por meio da abordagem multicriterial em ambiente SIG. In: 15th Simpósio Brasileiro de Sensoriamento Remoto – SBSR.
Curitiba, Paraná, 01-05 April 2011.
Silva, C. A., Nunes, F. P. 2009. Mapeamento de vulnerabilidade ambiental utilizando o método AHP: uma análise integrada para suporte à decisão no município de Pacoti/CE. In: 14th Simpósio Brasileiro de Sensoriamento Remoto – SBSR. Natal, Rio Grande do Norte, 2009.
Silva, S. F., Pejon, O. J. 2004. Utilização de inferência de lógica fuzzy na elaboração de documentos cartográficos. In: 5th Simpósio de Cartografia, Geotécnica e Geoambiental. São
Valladares, G. S., Gomes, A. S.; Torresan, F. E., Rodrigues, C. A. G., Grego, C. R. Modelo multicritério aditivo na geração de mapas de susceptibilidade à erosão em área rural. Pesquisa Agropecuária Brasileira 47, n. 9 (2012): 1376-1383.
Vieira, A. S., Curi, W. F. 2015. Seleção de culturas agrícolas utilizando técnicas de análise multicriterial. Revista Gestão e Sustentabilidade Ambiental, 3(2), pp. 45-60.