Mem Inst Oswaldo Cruz, Rio de Janeiro, Vol. 111(1): 1-19, January 2016 1
online | memorias.ioc.fiocruz.br
Commercial enzyme-linked immunosorbent assay
versus
polymerase chain reaction for the diagnosis of chronic
Chagas disease: a systematic review and meta-analysis
Pedro Emmanuel Alvarenga Americano do Brasil1/+, Rodolfo Castro2,3, Liane de Castro4
1Fundação Oswaldo Cruz, Instituto Nacional de Infectologia Evandro Chagas, Laboratório de Pesquisa Clínica em Doença de Chagas, Rio de Janeiro, RJ, Brasil 2Fundação Oswaldo Cruz, Instituto Nacional de Infectologia Evandro Chagas, Laboratório de Pesquisa Clínica
em DST e AIDS 3Universidade Federal do Estado do Rio de Janeiro, Instituto de Saúde Coletiva, Rio de Janeiro, RJ, Brasil 4Fundação Oswaldo Cruz, Instituto Nacional de Infectologia Evandro Chagas, Laboratório de Farmacogenética, Rio de Janeiro, RJ, Brasil
Chronic Chagas disease diagnosis relies on laboratory tests due to its clinical characteristics. The aim of this research was to review commercial enzyme-linked immunosorbent assay (ELISA) and polymerase chain reaction (PCR) diagnostic test performance. Performance of commercial ELISA or PCR for the diagnosis of chronic Chagas disease were systematically searched in PubMed, Scopus, Embase, ISI Web, and LILACS through the bibliography from 1980-2014 and by contact with the manufacturers. The risk of bias was assessed with QUADAS-2. Heterogene-ity was estimated with the I2 statistic. Accuracies provided by the manufacturers usually overestimate the accuracy
provided by academia. The risk of bias is high in most tests and in most QUADAS dimensions. Heterogeneity is high in either sensitivity, specificity, or both. The evidence regarding commercial ELISA and ELISA-rec sensitivity and specificity indicates that there is overestimation. The current recommendation to use two simultaneous serological tests can be supported by the risk of bias analysis and theamount of heterogeneity but not by the observed accura-cies. The usefulness of PCR tests are debatable and health care providers should not order them on a routine basis. PCR may be used in selected cases due to its potential to detect seronegative subjects.
Key words: Chagas disease - Trypanosoma cruzi - diagnosis - polymerase chain reaction - enzyme-linked immunosorbent assay
doi: 10.1590/0074-02760150296
+ Corresponding author: [email protected] Received 6 August 2015
Accepted 11 December 2015
Chagas disease is a condition in which the infectious agent is a parasite called Trypanosoma cruzi. It is consid-ered a neglected disease and typically occurs in poor rural areas of Latin America. Since 2000, it has progressively become of great interest worldwide due to its increasing presence in non-Latin American countries (Savioli & Daumerie 2008, de Andrade et al. 2011, Tanowitz et al. 2011). Infected people who travel from Latin America have been identified as a source of disease transmission through blood transfusion or organ donation in non-Latin American countries (Savioli & Daumerie 2008).
Chronic Chagas disease diagnosis is rather difficult to determine due to two basic clinical issues: (i) a high prevalence of a clinical form at the chronic phase in which there is no target organ findings, the indeterminate form (Ribeiro & Rocha 1998, Prata 2001), and (ii) it is a lifelong condition where the clinical suspicion may come many decades later in infected subjects (Lapa et al. 2012) after exposure when physicians often do not identify a history of exposure or a history of acute illness signs.
Currently, diagnostic investigations of the chronic phase rely on serological tests. There are many recom-mendations of the number and combinations/algorithms of serological tests to conduct diagnostic investigation in the chronic phase (Albajar et al. 2005, MS/SVS 2005, OPAS 2005, Bern et al. 2007, MINSAL 2007, 2008, de Andrade et al. 2011, MPPS 2014). However, enzyme-linked immu-nosorbent assays (ELISA), either conventional or with recombinant antigens (ELISA-rec), are often mentioned as a preferred test (MINSAL 2007, 2008). Additionally, some guidelines mentioned that polymerase chain reac-tion (PCR), combined either in series or in parallel with serological test(s), can be used for chronic Chagas disease diagnostic investigation (Albajar et al. 2005, MS/SVS 2005). Previous systematic reviews of diagnostic tests for Chagas disease concluded that these tests were not well studied, there was a high heterogeneity in their accura-cies, and the serological tests’ accuracies are likely over-estimated (Brasil et al. 2010, Afonso et al. 2012). The lack of homogeneity of in-house PCR tests’ protocols have also been discussed as a source of heterogeneity of their accu-racy (Brasil et al. 2010, Schijman et al. 2011).
Chagas disease diagnosis systematic review • Pedro Emmanuel Alvarenga Americano do Brasil et al. 2
Eligibility criteria
The abstracts were eligible for full text evaluation if their aims were at least one of the following: (i) to esti-mate sensitivity or specificity of one or more ELISA or PCR tests for chronic Chagas disease, (ii) to estimate the accuracy of an ELISA or PCR test for chronic Chagas disease, (iii) to test a new ELISA or PCR test for chronic Chagas disease, or (iv) to estimate any validity measure for ELISA or PCR for chronic Chagas disease such as the area under the receiver operating characteristics (ROC) curve or predictive values. If abstracts had unclear ob-jectives but partially met any of the inclusion criteria, or had unclear objectives and had any of the validity measures (as described above) as a result, they were also included for full text retrieval. Abstracts with the follow-ing characteristics were not included: (i) not conducted with human volunteers or with samples from human be-ings, (ii) an indication that the tests were studied in a verification of cure scenario, (iii) the investigations were concerning exclusively acute infection or newborns, or with mixed data from acute and chronically infected patients without the possibility of disaggregation. After full text retrieval, the following inclusion criteria were applied for quality evaluation and data extraction: (i) the investigations should be original (narrative reviews, edi-torials, or letters without primary data were excluded), (ii) they should be quantitative investigations, (iii) ev-ery investigation must have two samples (1 representing those with chronic Chagas disease and another repre-senting those without chronic Chagas disease), (iv) they must have results with enough data to allow extraction (or calculation) of true positives, false negatives, false positives, and true negatives of each test, and (v) they must not involve strictly laboratory validation research.
Only texts published after 1980 were included. Al-though only abstracts in English, Spanish, or Portuguese were obtained, no language restriction was applied to the full text evaluation.
Diagnostic studies from Phase 1 to Phase 3 were in-cluded. Phase 1 studies are case-controls studies where the definitions of the cases and controls are not neces-sarily defined by the same reference. Phase 2 studies are case-control studies where the same reference for cases and controls are strictly the same and indeterminate sub-jects are usually discarded. Phase 3 studies are cross-sectional or diagnostic cohort studies with the consecu-tive inclusion of subjects in which the suspicion of the condition of interest is the main inclusion criteria.
Information sources
Data from a previous systematic review was used (Brasil et al. 2010) and updated. The previous systematic review included data from 1980-2009 and the update pe-riod included data from 2009-May 2014. Nevertheless, reviewers filled the new forms with data extracted again from all of the full texts from the previous systematic review. The main difference in the version of the forms was the risk of bias section.
The Brazilian Health Surveillance Agency (ANVISA) (the regulatory agency for health products) website was
visited up to 10 October 2014 to find possible tests of in-terest for this research. Moreover, authors visited the man-ufacturer’s website up to 10 October 2014 to find technical reports, test brochures, or set of studies’ results from tests accuracy data. In addition, the authors tried electronic mail contact with manufacturers of the tests registered at ANVISA’s website to request this same information.
The authors’ search continued up to 31 March 2014 and included the following databases for abstracts of interest: PubMed/MEDLINE, Scopus, Embase, LILACS and ISI Web. A search of the bibliography of each full text retrieved was conducted while the full texts were being evaluated.
Search strategy
The following search terms were used at Medline/ PubMed: “Chagas Disease” (MeSH) OR “Trypanosoma cruzi” (MeSH) AND ELISA OR enzyme AND linked AND assay, OR PCR OR polymerase AND chain AND reaction, AND sensitive* (Title/Abstract) OR sensitiv-ity and specificsensitiv-ity (MeSH Terms) OR diagnos* (Title/ Abstract) OR diagnosis (MeSH:noexp) OR diagnostic* (MeSH:noexp) OR diagnosis, differential (MeSH:noexp) OR diagnosis (Subheading:noexp) OR “Reproducibility of Results” (MeSH) OR reliability OR reproducibility.
The search strategies used in the remaining databas-es were adapted from the one above and can be accdatabas-essed at protocol registration at: crd.york.ac.uk/PROSPERO/ display_record.asp?ID=CRD42014005733.
Study records
The retrieved abstracts were stored in a reference manager library. The library was split in two sets. Both sets were classified by one of the reviewers/authors and the remaining authors classified one set each. The re-viewers independently tagged each abstract as eligible or not eligible, and later the reviewers met and compared each of their classifications and solved their discrepan-cies. For each eligible abstract, the full text was retrieved and the same independent classification was conducted. For each elected full text, the same process of indepen-dent evaluation/extraction was conducted with a previ-ously updated and piloted form.
Data items
The authors planned to collect data related to the tests, samples included in the original investigation, and the in-vestigation itself including the risk of bias questionnaire.
kinetoplast-3
Mem Inst Oswaldo Cruz, Rio de Janeiro, Vol. 111(1), January 2016
DNA (k-DNA) minicircles or satellite-DNA (sat-DNA) and whether the technique was DNA hybridisation, PCR standard qualitative, nested, or quantitative.
It is important to note that the authors planned in advance to collect many other data; however, they were dropped in the analysis either because there were too many fields with an absence of data or they were too heterogeneous to compile. In the latter case, they are mentioned in the text if appropriate.
Risk of bias of individual reports
The risk of bias was assessed through a quality assess-ment tool for diagnostic accuracy studies (QUADAS)-2 (Whiting et al. 2011). Briefly, this tool is designed to as-sess the quality of primary diagnostic accuracy studies and should be applied in addition to extracting primary data for use in the review. The QUADAS-2 tool consists of four key domains that discuss patient selection, the index test, the reference standard, and the flow of patients through the study and timing of the index tests and reference standard.
Risk of bias is judged as “low”, “high”, or “unclear”. If the answers to all of the signalling questions for a do-main are “yes”, then the risk of bias can be judged as low. If any signalling question is answered “no”, the potential for bias exists. The “unclear” category was used when insufficient data are reported to permit a judgement.
Applicability was structured in a way similar to that of the bias sections but do not include signalling questions. Review authors recorded the information on which the judgement of applicability is made and then rate their concern that the study does not match the re-view question.
Outcomes
The outcomes of interest were the absolute counts of (i) true positives, (ii) false negatives, (iii) false posi-tives, and (iv) true negatives; these counts were (i) the amount of subjects with Chagas disease and identified by the test as having Chagas disease, (ii) the amount of subjects with Chagas disease and identified by the test as not having Chagas disease, (ii) the amount of subjects without Chagas disease identified by the test as having Chagas disease, and (iv) the amount of subjects without Chagas disease and identified by the test as not having Chagas disease. From these counts, it was possible to estimate by different methods the sensitivity (the frac-tion of subjects correctly identified with the condifrac-tion) and specificity (the fraction of subjects correctly identi-fied without the condition). These measures, along with the area under the summary ROC curve (SROC) by the bivariate method, were the outcomes of interest.
The authors also planned to collect data concerning the reliability of the tests. However, due to the absence of data, this outcome was dropped from the analysis.
Tests of interest
Index tests - The first index test is a commercial ELI-SA for the diagnosis of Chagas disease or ELIELI-SA-rec.
The second index test is based on molecular technol-ogy, PCR, and its variations, such as commercial or in-house tests, qualitative or quantitative, and with k-DNA
or sat-DNA amplification. However, groups of inter-est were formed as sugginter-ested by Schijman et al. (2011) where four different methodologies were suggested to improve PCR performance in an international study.
These methodologies are as follows: (M1) DNA ex-traction from blood in ethylenediamine tetraacetic acid (EDTA)-guanidine with phenol-chloroform and amplifi-cation of sat-DNA using a quantitative PCR, (M2) DNA extraction from blood in EDTA-guanidine with phenol-chloroform and amplification of sat-DNA using conven-tional qualitative PCR, (M3) DNA extraction from blood in EDTA-guanidine using commercial extraction kits with glass columns and amplification of sat-DNA with quantita-tive PCR, and (M4) DNA extraction from blood in EDTA-guanidine with phenol-chloroform and amplification of k-DNA (121-122 primers) with hot-start PCR. Finally, and additional group was formed from commercial PCR tests.
Comparator(s)/control
The desired comparator is the Chagas disease diag-nosis as recommended by the Brazilian consensus in which two serological tests of different methodology are conducted in parallel. However, as no reference stan-dard for Chagas disease diagnostic research is widely accepted, research with other reference tests were also included such as latent class analysis. If comparisons were made with more than two serological tests or with parasitological tests, and data using two simultaneous serological tests as reference standard was available as well, the latter was preferred instead.
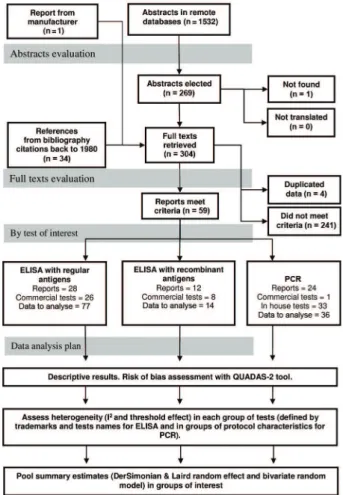
Data analysis plan
Data synthesis was conducted in each subgroup of interest and was the combination of the trademark and the test name in the case of the ELISA tests. For PCR tests, the groups of interest were whether the tests were commercial or in-house and the variations of PCR pro-cedures. Heterogeneity was explored in and between these groups with the I2 and the Cochrane Q test for both
sensitivity and specificity (Fig. 1). For all of the groups of trademark and test name with four or more studies, a threshold effect was also explored as a source of heter-ogeneity. The threshold effect is as a correlation of the test sensitivity and the false positive rate. If a threshold effect is present, a change in test accuracy from different studies is likely to be from differences in the decision thresholds used in each study.
An I2 up to 25% was considered low evidence of
het-erogeneity, 50% or higher was considered high evidence of heterogeneity, and between 25-50% was considered moderate evidence of heterogeneity. A p-value of the Q test lower then 0.10 was also considered evidence of het-erogeneity. If there was a conflict of heterogeneity inter-pretation according to these two tests, the I2 statistic was
considered to be more appropriate. If heterogeneity is high, then one must understand that the pooled summary estimate lacks interpretation.
Chagas disease diagnosis systematic review • Pedro Emmanuel Alvarenga Americano do Brasil et al. 4
likely mislead the interpretation of the results. The sensi-tivity and specificity were summarised using two strate-gies. In the first one, we used a bivariate model proposed by Reitsma (2005) (defined as a linear mixed model with known variances of the random effects). The Cochrane Di-agnostic Test Accuracy systematic review group currently recommends this method as the standard approach. Some of its characteristics are considered advantageous: it fits the pair of sensitivity and specificity simultaneously, it re-turns conservative estimates in the presence of heteroge-neity, as correlation is one of its parameters, the presence of the threshold effect reduces the confidence interval, and it allows estimation the SROC; however, it was conduct-ed only in the groups with at least four or more studies. Similar to other regression methods, it has limitations, may not converge, and may mislead interpretation due to convergence problems, especially in small datasets. As an alternative, we used the DerSimonian & Laird random ef-fect (D&L) with a logit transformation (and back-transfor-mation) and the inverse variance method to estimate study
weights (as the 2nd method) with all of the groups of inter-est. All of the analyses were conducted with the R-project statistical package (R Core Team 2015) with libraries meta (Schwarzer 2015) and mada (Doebler 2015).
Study selection
On the ANVISA website, the authors found 30 re-cords of ELISA tests and no rere-cords of commercial PCR tests. Visiting the manufacturers’ websites and by re-questing information through their website contact or by phone, we were unable to obtain a return of any tech-nical report during the update period. Nevertheless, the authors looked for possible data of interest in the tests’ technical descriptions and the technical recommenda-tions regarding their use. The majority of these 30 tests did not have any information available regarding the test performance on their websites.
After removing the replicates from the remote bib-liographic database strategy, the authors found 1,532 ab-stracts including the original and the update period (Fig. 1). After including those found through the bibliography search and removing those that did not meet the inclu-sion criteria or those that met the excluinclu-sion criteria, 59 original reports remained for data extraction. As some investigations had data regarding two or more tests, the number of reports, tests, and data to analyse will not match the number of reports included in the review. Data concerning commercial ELISA were extracted from 28 reports (Lorca et al. 1992, Pan et al. 1992, Carvalho et al. 1993, Teixeira et al. 1994, Hamerschlak et al. 1997, Oelemann et al. 1998, Houghton et al. 1999, Leiby et al. 2000, Ferreira et al. 2001, Gadelha et al. 2003, Ar-rieta et al. 2004, Enciso et al. 2004, Moretti et al. 2004, Pirard et al. 2005, Duarte et al. 2006, Kirchhoff et al. 2006, Malan et al. 2006, Caballero et al. 2007, Tobler et al. 2007, Gorlin et al. 2008, Otani et al. 2009, Remesar et al. 2009, Añez et al. 2010, Flores-Chávez et al. 2010, Barfield et al. 2011, De Marchi et al. 2011, Pereira et al. 2012, Araújo & Berne 2013) (Fig. 1) including 26 dif-ferent combinations of trademarks and test names. Data from 12 commercial ELISA-rec reports were extracted (Pastini et al. 1994, Gomes et al. 2001, Gadelha et al. 2003, Pirard et al. 2005, Blejer 2006, Chang et al. 2006, Caballero et al. 2007, Ramírez et al. 2009, Remesar et al. 2009, Villagrán et al. 2009, Añez et al. 2010, Pereira et al. 2012, Souza et al. 2012) (Fig. 1), including eight differ-ent combinations of trademarks and test names. Finally, data concerning PCR were extracted from 24 reports (Avila et al. 1993, Wincker et al. 1994, 1997, Britto et al. 1995, Espinoza et al. 1996, Junqueira et al. 1996, Car-riazo et al. 1998, Chiaramonte et al. 1999, Gomes et al. 1999, Ribeiro-dos-Santos et al. 1999, Castro et al. 2002, Gutierrez et al. 2004, Duarte et al. 2006, Gil et al. 2007, Piron et al. 2007, Fitzwater et al. 2008, Deborggraeve et al. 2009, Ferrer et al. 2009, 2013, Ramírez et al. 2009, Batista et al. 2010, Gilber et al. 2013, Sabino et al. 2013), but only one commercial test was found (Deborggraeve et al. 2009, De Winne et al. 2014). However, the original authors modified the commercial version in two of the studies for research purposes (De Winne et al. 2014).
5
Mem Inst Oswaldo Cruz
, Rio de Janeiro, V
ol.
111
(1), January 2016
TABLE I
Descriptive data of individual enzyme-linked immunosorbent assay test studies
Study Multicenter Country
Data collection
period
Children proportion
(%)
Male proportion
(%)
Mean age (years)
Max age (years)
Min age (years)
From blood bank
(%)
Living in rural areas
(%)
Living in urban areas
(%)
With cardiac
form (%)
With indeterminate
form (%)
Lorca M-1992 (Lorca et al. 1992)
No Argentina - - -
-Pan AA-1992 (Pan et al. 1992)
Yes Argentina, Brazil - - -
-Carvalho MR-1993 (Carvalho et al. 1993)
Ignored Brazil - - - 67 - - -
-Teixeira MGM-1994 (Teixeira et al. 1994)
No Brazil - - - - 78 16 - - - -
-Hamerschlak N-1997 (Hamerschlak et al. 1997)
No Brazil - 0 - - - - 100 - - -
-Oeleman WMR-1998 (Oelemann et al. 1998)
No Brazil - - -
-Houghton RL-1999 (Houghton et al. 1999)
No Brazil, Equator, USA - - -
-Leiby DA-2000 (Leiby et al. 2000)
No Brazil - - - 100 - - -
-Ferreira AW-2001 (Ferreira et al. 2001)
No Brazil - - - 52 - - 27
-Gadelha AAM-2003 (Gadelha et al. 2003)
No Brazil - 0 - - 82 21 - - - 79 13
Arrieta R-2004 (Arrieta et al. 2004)
Yes Argentina 2000-2001 100 - - 14 1 0 - - -
-Enciso C-2004 (Enciso et al. 2004)
No Colombia - - - 100 - - -
-Moretti E-2004 (Moretti et al. 2004)
No Argentina - - -
-Pirard M-2005 (Pirard et al. 2005)
No Bolivia 1998-1999 0 66 31 - - 100 13 87 -
-Duarte AMV-2006 (Duarte et al. 2006)
No Brazil 2000-2002 - - - 80 10 - - - 48 38
Kirchhoff LV-2006 (Kirchhoff et al. 2006)
-C
ha
ga
s d
ise
as
e d
iag
no
sis s
ys
te
m
at
ic r
ev
ie
w • P
ed
ro E
m
m
an
ue
l A
lva
re
ng
a A
m
eri
ca
no d
o B
ra
sil e
t a
l.
6
Study Multicenter Country
Data collection
period
Children proportion
(%)
Male proportion
(%)
Mean age (years)
Max age (years)
Min age (years)
From blood bank
(%)
Living in rural areas
(%)
Living in urban areas
(%)
With cardiac
form (%)
With indeterminate
form (%)
Malan AK-2006 (Malan et al. 2006)
No Brazil, USA - - 47 49 71 21 45 - - 50 60
Caballero ZC-2007 (Caballero et al. 2007)
Yes Brazil, Panama - 0 60 - 60 18 32 - - -
-Rivetz B-2007a Yes Multicenter - - - - - - - - - -
-Tobler LH-2007 (Tobler et al. 2007)
No USA - - - 96 - - -
-Gorlin J-2008 (Gorlin et al. 2008)
Yes USA - - - 96 - - -
-Otani MM-2009 (Otani et al. 2009)
Yes Argentina, Brazil,
Colombia, El Salvador, Honduras, Mexico, Nicaragua, Paraguay
2000-2000 0 - - - - 100 - - -
-Remesar MC-2009 (Remesar et al. 2009)
Yes Argentina 2006-2007 0.6 79 36 - - 100 - - -
-Añez N-2010 (Añez et al. 2010)
No Venezuela - - 35.7 - - - 44.7 - - 44.7 15.8
Flores Chavez M-2010 (Flores-Chávez et al. 2010)
No Spain - - -
-Barfield CA-2011 (Barfield et al. 2011)
No Argentina - - -
-March CR-2011 (De Marchi et al. 2011)
Ignored Brazil - - - 32.4 - - -
-Araujo AB-2013 (Araújo & Berne 2013)
No Brazil - 0 - - 65 18 100 - - 0 100
7
Mem Inst Oswaldo Cruz
, Rio de Janeiro, V
ol.
111
(1), January 2016
TABLE II
Descriptive data for individual enzyme-linked immunosorbent assay recombinant test studies
Study Multicenter Country
Data collection
period
Children proportion
(%)
Male proportion
(%)
Mean age (years)
Max age (years)
Min age (years)
From blood bank
(%)
Living in rural areas
(%)
Living in urban
areas (%)
With cardiac
form (%)
With indeterminate
form (%)
Pastini AC-1994 (Pastini et al. 1994)
No Argentina - - -
-Gomes YM-2001 (Gomes et al. 2001)
No Brazil - - - - 76 5 - - - -
-Gadelha AAM-2003 (Gadelha et al. 2003)
No Brazil - - - - 82 21 - - - 79 13.39
Blejer JL-2006 (Blejer 2006)
No Argentina 1995-2003 - - - 100 - - -
-Pirard M-2005 (Pirard et al. 2005)
No Bolivia 1998-1999 0 66 31 - - 100 13 87 -
-Chang CD-2006 (Chang et al. 2006)
No USA - - - 100 0 0 -
-Caballero ZC-2007 (Caballero et al. 2007)
Yes Brazil,
Panama
- 0 60 - 60 18 32 - - -
-Ramírez JD-2009 (Ramírez et al. 2009)
No Colombia - 0 - - - 100 0
Remesar MC-2009 (Remesar et al. 2009)
Yes Argentina 2006-2007 0 79 36 - - 100 - - -
-Villagrán ME-2009 (Villagrán et al. 2009)
Yes Mexico - - -
-Añez N-2010 (Añez et al. 2010)
No Venezuela - - 35.7 - - - 44.7 - - 44.7 15.8
Souza RM-2012 (de Souza et al. 2012)
-C
ha
ga
s d
ise
as
e d
iag
no
sis s
ys
te
m
at
ic r
ev
ie
w • P
ed
ro E
m
m
an
ue
l A
lva
re
ng
a A
m
eri
ca
no d
o B
ra
sil e
t a
l.
8
TABLE III
Descriptive data of individual polymerase chain reaction test studies
Study Multicenter Country
Data collection
period
Children proportion
(%)
Male proportion
(%)
Mean age (years)
Max age (years)
Min age (years)
From blood bank
(%)
Living in rural areas
(%)
Living in urban areas
(%)
With cardiac
form (%)
With indeterminate
form (%)
Avila HA-1993 (Avila et al. 1993)
No Brazil - - - - 84 13 15 - - -
-Wincker P-1994 (Wincker et al. 1994)
No Brazil 1992-1992 - - - 0 - - -
-Britto C-1995 (Britto et al. 1995)
No Brazil - - -
-Espinoza AG-1996 (Espinoza et al. 1996)
No Bolivia - 77 0 - - -
-Junqueira ACV-1996 (Junqueira et al. 1996)
No Brazil 1993-1994 - - -
-Wincker P-1997 (Wincker et al. 1997)
No Bolivia - 100 - 7 15 1 0 100 0 -
-Carriazo CS-1998 (Carriazo et al. 1998)
No Argentina - - -
-Chiaramonte MG-1999 (Chiaramonte et al. 1999)
No Argentina - - -
-Gomes ML-1999 (Gomes et al. 1999)
No Brazil - - 46 46 76 11 - - - -
-Ribeiro-dos-Santos G-1999 (Ribeiro-dos-Santos et al. 1999)
No Brazil - - - 100 - - -
-Castro AM-2002 (Castro et al. 2002)
No Brazil - 0 42 51 88 23 - - - -
-Gutierrez R-2004 (Gutierrez et al. 2004)
No Colombia - - -
-Duarte AMV-2006 (Duarte et al. 2006)
No Brazil 2000-2002 - - - 80 10 - - - 48 38
Gil J-2007 (Gil et al. 2007)
No Colombia - 0 - - 65 18 - - - 46 10
Piron M-2007 (Piron et al. 2007)
No Spain 2000-2004 1 - - - 1 - - - -
-Fitzwater S-2008 (Fitzwater et al. 2008)
No Peru 2006-2007 - 0 24 45 13 0 - - -
-Deborggraeve S-2009 (Deborggraeve et al. 2009)
-9
Mem Inst Oswaldo Cruz, Rio de Janeiro, Vol. 111(1), January 2016
Descriptive results
Argentina and Brazil were the countries where most of the studies of serological tests were conducted (Tables I, II). Most of the studies with PCR tests were also con-ducted in these two countries and in Colombia, Bolivia, and Venezuela (Table III). Very few multicentre investi-gations were found, and considering the amount of ab-sent information, it was often very hard to know whether the same investigation protocol was applied or just sam-ples from different sources were analysed together. It became clear that the sample description of most of the studies lacked data. The vast majority of the information that was planned to be collected was absent in 60% or more of the reports. Eight (28.6%) of the ELISA reports (Table I), three (25%) of the ELISA-rec studies (Table II), and five (20.8%) of the PCR reports do not have any information regarding the sample description (Table III).
The authors planned to collect data regarding the se-rological tests’ antigens, whether the antigens were puri-fied or not, recommended decision threshold, and how the decision thresholds were estimated, but the tests’ descriptions were often so poor that the desired informa-tion was not available. When looking for accuracy data on the manufacturers’ websites, the authors were some-times able to read the instructions to conduct the tests. When that was the case, the serology decision threshold was always dependent of internal controls and formu-las such as “the arithmetic mean of negative and posi-tive controls” are frequent. This indicates that each time someone runs the test, a new decision threshold may arise and its basis is solely on analytic information.
The reference standard was also highly heteroge-neous among all of the studies. Twenty-one percent of all of the investigations did not even apply the same ref-erence standard to classify those with and without Cha-gas disease. Only 22% of the studies applied a reference standard similar to the Brazilian consensus in which two serological tests must be either positive or negative, and 3.5% used latent class analysis. The remaining studies applied reference standards such as one serological test (21%), two positives out of three tests (21%), ignored (14%) and unusual combinations of different serologi-cal tests (e.g., western blot, haemagglutination, and two ELISAs), and combinations of serological tests with parasitological tests or partial verification of the sample.
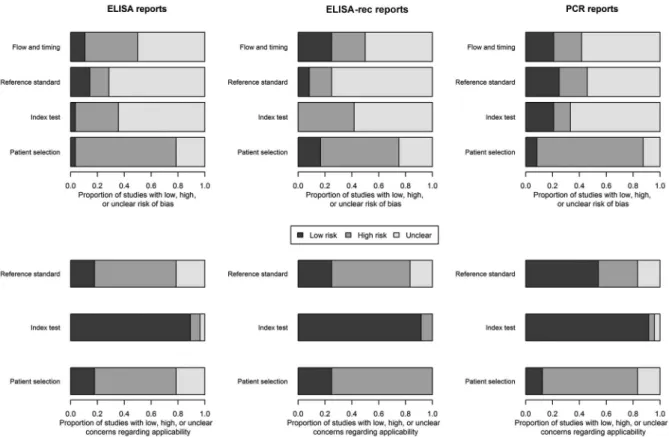
Risk of bias assessment
The risk of bias assessment made through the QUA-DAS-2 tool is shown in Fig. 2. No more than 30% of studies were classified as “low risk” of bias in any of the evaluated dimensions or in any of the three tests. In the “patient selection” dimension, the majority of the studies were classified as having a high risk of bias. This occurred because most of the selected volunteers/samples were a case mix of unexposed to Chagas disease or samples from patients with other diseases where the suspicion of Cha-gas disease was unlikely. The remaining assessment of the risk of bias, “flow and timing”, “reference standard”, and “index tests” had the majority of studies classified as “unclear”. Again, this is an indicator of the amount of the absence of data and did not permit the authors to conduct appropriate classification for review purposes.
-Chagas disease diagnosis systematic review • Pedro Emmanuel Alvarenga Americano do Brasil et al. 10
The risk of bias results given the concerns about ap-plicability is a little different from the risk of bias re-sults from the research design/conduction. The majority of the reports of ELISA and the PCR tests were classi-fied as “low risk” in the index test dimension. Again, the majority of the studies were classified as “unclear risk” concerning the applicability in the “reference standard”, and “patient selection” topics in all three serological and molecular tests (Fig. 2).
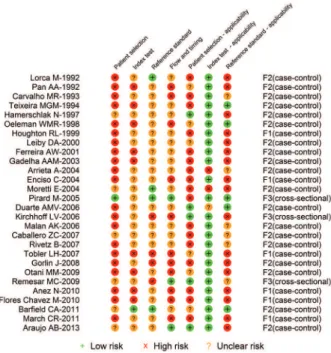
Looking at the individual reports’ classifications about their risk of bias for the ELISA (Fig. 3), ELISA-rec (Fig. 4), and PCR (Table IV), it is observed that the number of clas-sifications of “low risk” within each study is heterogeneous and ranges from 0-5 in the ELISA and ELISA-rec reports and from 1-7 in the PCR reports. The majority of ELISA (Fig. 3) and ELISA-rec (Fig. 4) studies do not have more than two topics assessed as “low risk” of bias, whereas in the PCR studies, the majority have no more than three topics assessed as “low risk”. Only one PCR study had all seven topics assessed as “low risk” of bias (Fig. 5).
Studies classified as development Phase 3 or later are considered the most suitable to give results for deci-sion making because they are those which most resemble clinical practice (Haynes & You 2009); however, few studies were classified as development Phase 3 in this review. Only three ELISA studies, five ELISA-rec stud-ies, and one PCR study were classified as Phase 3.
Heterogeneity and summary estimates
With very few exceptions, the ELISAs’ sensitivity and specificity point estimates are above 90% in all of the stud-ies (Supplementary Figure 1), and this occurs with ELI-SA-rec (Supplementary Figure 2) as well. This finding is compatible with the sensitivity and specificity point esti-mate provided by the manufacturers, although, in most cas-es, the manufacturers clearly provided higher accuracy esti-mates than the academic studies (Table V). What stands out is that 56% of the manufacturers do not explicitly provide accuracy information regarding commercial tests on their websites or in the test documentation (Table V), and for the tests where the information is available, there is neither an estimate of confidence intervals nor information on how they reached the accuracy results. Only rarely do manufac-turers provide a bibliography for further reading on their website, which may contain some information about study design, conducting the study, and the accuracy results.
Again, one must understand that the excess of het-erogeneity turns the summary estimate into a noninter-pretable status, although this excess may be accounted for in a bivariate model approach if the threshold effect is present. Overall, the evidence of heterogeneity was high except in the Research Institute for Health Sciences (IICS) of the National University of Asunción - Chagas Test ELISA, and the Bio-Manguinhos enzyme
11
Mem Inst Oswaldo Cruz, Rio de Janeiro, Vol. 111(1), January 2016
Fig. 3: quality assessment tool for diagnostic accuracy studies risk of bias of individual studies of enzyme-linked immunosorbent assay tests.
TABLE IV
Summary estimates from bivariate model of different polymerase chain reaction (PCR) methodologies
studied at least four times
Test Measure Estimate 95% CI.lb 95% CI.ub
M4 Sensitivity 0.457 0.091 0.877 Specificity 0.958 0.858 0.989
AUC SROC 0.94 -
-Threshold effect 0.342 -0.554 0.871 None Sensitivity 0.654 0.493 0.786 Specificity 0.972 0.914 0.991
AUC SROC 0.919 -
-Threshold effect 0.373 -0.036 0.675
accuracies without significant threshold effect are not inter-pretable. AUC SROC: area under the summary receiver op-erating characteristic curve; CI.lb: confidence interval lower bound; CI.ub: confidence interval upper bound; M4: DNA ex-traction from blood in ethylenediamine tetraacetic acid-gua-nidine with phenol-chloroform, amplification of kinetoplast-DNA (121-122 primers) with hot-start PCR; none: none of the improvements propose by Schijman.
assay (EIA) Recombinant studies, where there is a low evidence of heterogeneity in both sensitivity and spec-ificity. D&L pools the sensitivity and specificity sepa-rately; therefore, it is possible to detect different levels of heterogeneity in sensitivity and specificity in the same test. This is the case of the bioMérieux - BioElisacruzi, Lemos - BIOZIMA CHAGAS ELISA, and Biokit - BI-OELISA CHAGAS tests, where there is low evidence of heterogeneity in sensitivity and high evidence of het-erogeneity in specificity. This also happened with the Lemos - Chagatek, and Wiener - CHAGAS TEST tests, in which there is moderate evidence of heterogeneity in sensitivity and high evidence of heterogeneity in speci-ficity. Either there was a high evidence of heterogeneity in both sensitivity and specificity in the remaining tests or they were studied just once, in which case it was not possible to estimate heterogeneity.
Only two ELISA-rec tests were studied at least twice to allow the heterogeneity estimates (Supplementary Figure 2). The Bio-Manguinhos EIA Recombinant was studied twice and the evidence of heterogeneity in both sensitivity and specificity was low. The Wiener CHAGAS TEST re-combinant was studied seven times and evidence of hetero-geneity was high in both sensitivity and specificity.
For where the evidence of heterogeneity was low (i.e., the Bio-Manguinhos EIA Recombinant and IICS of National University of Asunción - Chagas Test ELISA), the summary sensitivity was 0.98 and 0.97, and the sum-mary specificity was 1.00 and 0.99, respectively (Sup-plementary Figures 1, 2). The remaining D&L summary estimates of the ELISA tests (Supplementary Figure 1) and ELISA-rec tests (Supplementary Figure 2) have lim-ited interpretation due to their heterogeneity.
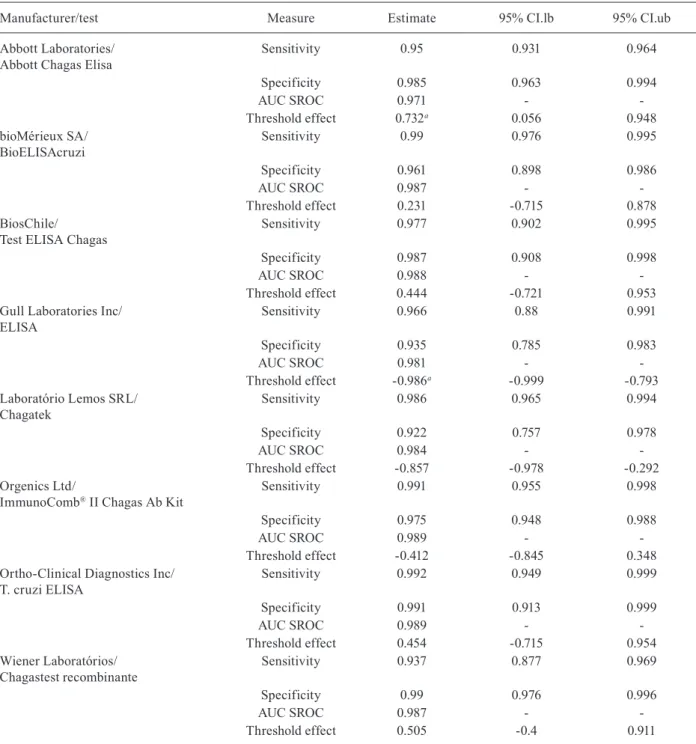
The Abbott Laboratories - ABBOTT CHAGAS ELISA, Gull - ELISA, and Lemos - Chagatek tests had almost identical summary pooled estimate results by bivariate and D&L models; however, a threshold effect was detected. The bivariate model summary estimate (Table VI) showed a slightly lower accuracy than the D&L estimate with narrower confidence intervals. In this case, they were considered more appropriate and result in interpretable summary estimates. In addition, the presence of the threshold effect turns the area under the ROC curve into an attractive accuracy measure for performance interpretation.
The Ortho-Clinical Diagnostics - T. cruzi ELISA, Lemos - BIOZIMA CHAGAS ELISA, bioMérieux - BioE-lisacruzi, BiosChile - Test ELISA Chagas, Wiener - CHA-GASTEST, and Wiener - CHAGASTEST recombinant tests had different evidence of heterogeneity in sensitivity and specificity, and no threshold effect was detected. The pooled summary estimates of both models are almost iden-tical; thus, neither the area under the SROC curve nor the sensitivity and specificity estimates were considered inter-pretable. The three tests with four or more studies that are not in Supplementary Figure 1 or Table VI (i.e., the Embra-bio - HEMOBIO CHAGAS, Lemos - BIOZIMA CHAGAS ELISA, and Wiener - CHAGASTEST test) did not converge in the bivariate model and are not presented on purpose.
Chagas disease diagnosis systematic review • Pedro Emmanuel Alvarenga Americano do Brasil et al. 12
Fig. 4: quality assessment tool for diagnostic accuracy studies risk of bias of individual studies of enzyme-linked immunosorbent assay tests with recombinant antigens.
Fig. 5: quality assessment tool for diagnostic accuracy studies risk of bias of individual studies of polymerase chain reaction tests.
aware that there is no identical PCR test protocol among all of the reports found. Once more, the bivariate model (Table IV) returns similar summary statistics when com-pared to the D&L model (Supplementary Figure 3, Table IV). Both summary pooled estimates are not interpretable due the amount of heterogeneity and the differences of
protocols (Supplementary Figure 3). Similar to the sero-logical studies, the summary estimates by the bivariate model (Table IV) are also difficult to interpret.
The main results of this research are: (i) the lack of information regarding all dimensions is significantly high including study sample description, heterogeneous reference standards and the tests’ key issues (e.g., the decision thresholds and antigens used), (ii) the fraction of “low risk” of bias is low in almost all of the dimen-sion groups in the risk of bias assessment and only one PCR study was classified as low risk of bias in all of the dimensions, (iii) there was evidence of moderate or high heterogeneity in most cases of the serological tests, but in two tests a threshold effect was evident, and (iv) heterogeneity was even more evident in the PCR studies. This amount of heterogeneity in the PCR tests was ex-pected because there are no identical protocols and only one commercial test was found.
In practice, there are several differences in clinical and pre-clinical diagnostic test validation phases. These phases are also known as “laboratory validation” and “clinical validation”. Didactically, the latter is divided into three-five phases, similar to clinical trials (Haynes & You 2009). These phases of the clinical validation refer to an increasing maturation of the results to a straightforward clinical interpretation. Usually, there is an overestimation of the test accuracy in the early phases (Haynes & You 2009).
Similar to the period of the first review (1980-2009), in the update period, basic science (parasitology and im-munology) journals and their authors were the most prev-alent. This could be a good explanation for the amount of missing data regarding clinical sample description and study design, as the research in these basic areas is more concerned with the tests themselves and less likely to manage clinical research design, conduction, and in-terpretation. Nevertheless, data from the update period (from 2009-2014) showed a clearly increasing awareness in academia regarding differences of clinical and labo-ratory validation and labolabo-ratory researchers seem to be increasingly devoting more efforts to strictly laboratory validation (Schijman et al. 2011).
13
Mem Inst Oswaldo Cruz
, Rio de Janeiro, V
ol.
111
(1), January 2016
TABLE V
Country, manufacturer, and accuracies of commercial enzyme-linked immunosorbent assay (ELISA) and ELISA recombinant tests provided by the manufacturers on their websites
Country Manufacturer Test Sensitivity Specificity
USA Abbott Laboratories Abbott ESA Chagas 1.000 0.991 or 0.925
USA Abbott Laboratories Abbott PRISM Chagas 0.984 0.987
Italy Adaltis EIAgen Trypanosoma cruzi Ab NA NA
Spain Biokit Bioelisa CHAGAS 1.000 0.974-0.995
Brazil Bio-Manguinhos Bio-Manguinhos EIA NA NA
Brazil Bio-Manguinhos Bio-Manguinhos EIA recombinant NA NA
France bioMérieux SA ELISA cruzi NA NA
Chile BiosChile Test ELISA Chagas III 1.000 1.000
Spain BLK Diagnostics ELISA BLK NA NA
Australia Cellabs Pty Ltd Cellabs T. cruzi IgG CELISA 0.98 0.98
Belgium Coris BioConcept T. cruzi OligoC-TesT 1.00 1.00
Brazil Ebram Produtos Laboratoriais Ltda CHAGAS ELISA 1.00 1.00
Brazil Embrabio Empresa Brasileira de Biotecnologia SA HEMOBIO-CHAGAS NA NA
Argentina Gador SA Dia Kit Bio-Chagas NA NA
Ireland GenCell Biosystems cruziTEST ELISA NA NA
USA Gull Laboratories Inc/Meridian Bioscience Inc Gull ELISA NA NA
USA Hemagen Diagnostics Inc Hemagen Chagas’ Kit NA NA
Paraguay Research Institute for Health Sciences /National University of Asunción Chagas Test ELISA NA NA
USA IVD Research Inc IVD ELISA NA NA
Argentina Laboratório Lemos SRL BIOZIMA CHAGAS ELISA NA NA
Argentina Laboratório Lemos SRL Chagatek NA NA
Argentina Laboratório Lemos SRL PATH-Lemos rapid test NA NA
USA Meridian Bioscience Inc CHAGAS IgG EIA NA NA
Scotland Omega Diagnostics Ltd PATHOZYME CHAGAS 0.983 0.985
USA Orgenics Ltd/Alere Inc ImmunoComb® II Chagas Ab Kit 1.00 0.983
USA Ortho-Clinical Diagnostics Inc ORTHO T. cruzi ELISA Test System 1.00 0.999
USA Siemens Healthcare Siemens IMMULITE CHAGAS IgG NA NA
Brazil Symbiosys ANTI-CHAGAS SYMBIOSYS 1.00 0.993
Argentina Wiener Laboratórios Chagatest ELISA lisado 1.00 0.992
Argentina Wiener Laboratórios Chagastest ELISA recombinante v.4.0 1.00 0.996
Chagas disease diagnosis systematic review • Pedro Emmanuel Alvarenga Americano do Brasil et al. 14
TABLE VI
Summary estimates from bivariate model of enzyme-linked immunosorbent assay tests studied at least four times
Manufacturer/test Measure Estimate 95% CI.lb 95% CI.ub
Abbott Laboratories/ Abbott Chagas Elisa
Sensitivity 0.95 0.931 0.964
Specificity 0.985 0.963 0.994
AUC SROC 0.971 -
-Threshold effect 0.732a 0.056 0.948
bioMérieux SA/ BioELISAcruzi
Sensitivity 0.99 0.976 0.995
Specificity 0.961 0.898 0.986
AUC SROC 0.987 -
-Threshold effect 0.231 -0.715 0.878
BiosChile/ Test ELISA Chagas
Sensitivity 0.977 0.902 0.995
Specificity 0.987 0.908 0.998
AUC SROC 0.988 -
-Threshold effect 0.444 -0.721 0.953
Gull Laboratories Inc/ ELISA
Sensitivity 0.966 0.88 0.991
Specificity 0.935 0.785 0.983
AUC SROC 0.981 -
-Threshold effect -0.986a -0.999 -0.793
Laboratório Lemos SRL/ Chagatek
Sensitivity 0.986 0.965 0.994
Specificity 0.922 0.757 0.978
AUC SROC 0.984 -
-Threshold effect -0.857 -0.978 -0.292 Orgenics Ltd/
ImmunoComb® II Chagas Ab Kit
Sensitivity 0.991 0.955 0.998
Specificity 0.975 0.948 0.988
AUC SROC 0.989 -
-Threshold effect -0.412 -0.845 0.348 Ortho-Clinical Diagnostics Inc/
T. cruzi ELISA
Sensitivity 0.992 0.949 0.999
Specificity 0.991 0.913 0.999
AUC SROC 0.989 -
-Threshold effect 0.454 -0.715 0.954
Wiener Laboratórios/ Chagastest recombinante
Sensitivity 0.937 0.877 0.969
Specificity 0.99 0.976 0.996
AUC SROC 0.987 -
-Threshold effect 0.505 -0.4 0.911
a: significant threshold effect. Accuracies without significant threshold effect are not interpretable; AUC SROC: area under the summary receiver operating characteristic curve; CI.lb: confidence interval lower bound; CI.ub: confidence interval upper bound.
Diagnostic test development and validation are influ-enced by regulatory agency legislation. Usually, the regu-lations to register and commercialise diagnostic tests are less restricted than those for medicines, vaccines, or inva-sive devices, which is probably due to safety issues (Hin-man et al. 2006). For example, the current ANVISA reg-ulation states that diagnostic tests or devices conducted in biological samples in artificial containers (outside the
15
Mem Inst Oswaldo Cruz, Rio de Janeiro, Vol. 111(1), January 2016
et al. 2006). The available tests on the market are likely to have questionable and overestimated accuracies when required improvements are not conducted.
Unfortunately, the risk of bias assessment showed a bias susceptibility mainly in the patient selection di-mension. Nevertheless, the risk is either unknown or high in almost every dimension. The bias may be in any magnitude and in both directions, and it seems to be a common issue in diagnostic test investigations and di-agnostic tests’ accuracy reviews (Leeflang et al. 2007). However, there is evidence supporting that the presence of bias leads to tests’ accuracies overestimation (Lijmer et al. 1999), which converges with the reasoning of over-estimated accuracies discussed above. To reduce the risk of bias in diagnostic test research, future research should focus attention on conducting and reporting on the fol-lowing topics: research should be conducted at clinical settings where patients are included consecutively and their main inclusion criteria should be chronic Chagas disease suspicion. In addition, the index test and refer-ence test must be conducted independently and blind-ed to each other. Their description should be detailblind-ed enough to allow others to reproduce the methods. Usu-ally, these topics characterise and are more often present for Phase 3 diagnostic test research.
Heterogeneity is defined as a variation of the study results beyond random occurrence (Egger et al. 2001). It may be due to sample, design, how the study was con-ducted, and reporting differences. It was stated before that heterogeneity is a rule in systematic reviews of diag-nostic tests’ accuracies (Buntinx et al. 2009); neverthe-less, it is not always possible to identify heterogeneity sources with subgroup analysis. For the same reason, the bivariate model has been recommended as one analysis approach to work around this issue.
A particular source of heterogeneity in diagnostic test research is the threshold effect. Different observed accuracies of the same test may be determined by the use of different decision thresholds. It is likely that in many cases in this review, the determined heterogeneity is a mix of bias and the threshold effect, as the ELISA tests thresholds are estimated using internal controls by a variety of criteria, and its values may vary from run to run and even in the same test. As the original stud-ies are using different thresholds, it is very hard to tie the summary estimates to a particular threshold, even if threshold effect is detected and the estimated sum-mary accuracy considers it. Therefore, one cannot make recommendations about which threshold should be used in this particular test. The threshold effect is one of the parameters in the bivariate model and it therefore ac-counts for this source of heterogeneity. In the presence of heterogeneity and the absence of a threshold effect, the bivariate approach estimates larger variances and thus wider confidence intervals. Therefore, it returns a conservative interpretation in this situation. However, it requires a large number of studies to accurately estimate the point summary sensitivity and specificity.
High evidence of heterogeneity among the PCR tests was expected. However, less heterogeneity of recent stud-ies was also expected where available technology makes
the tests less operator-dependent. Currently, the costs of PCR tests are quickly decreasing, and the equipment to conduct fast and automated molecular tests are becoming widely available. It is likely that the amounts of differ-ences in PCR protocols are due to fast adoption of new techniques/methodologies/equipment without sufficient evidence concerning the clinical applicability of previous generations of protocols. Based on an international study (Schijman et al. 2011), four different approaches were rec-ommended as the best analytical methods. Unfortunately, not all of these four recommendations were used in clini-cal research for chronic Chagas diagnosis, and the cur-rently there is high evidence of heterogeneity. Therefore, it not yet possible to confirm that any of these four recom-mendations perform better in clinical settings.
There are some settings where PCR can be quite use-ful, such as an assessment of a cure after trypanocidal treatment, identification of Chagas disease reactivation after transplant, and diagnosis of acute infection. Ref-erence/research laboratories may be able to apply PCR using specific algorithms that sometimes combine a few PCR tests or PCR with serological tests for several pur-poses. This practice is particularly interesting in epide-miological investigations as PCR is currently the only technique that offers genotype capabilities.
One issue about the PCR test is that many believe that it has 100% specificity due to the DNA’s analytical spec-ificity. However, in this review we found many reports with a PCR specificity point estimate lower than 100%. This phenomenon may occur because it may indeed not have 100% specificity, as test contamination may raise false positive results, and specificity underestimation may occur as the reference standard serology does not correctly identify those without Chagas disease. In the latter case, there is some discussion in literature regard-ing seronegative cases of chronic Chagas disease (Salo-mone et al. 2003, Batista et al. 2010, Blum-Domínguez et al. 2011). However, there is an inherent limitation of PCR tests imposed by the disease, which is that parasitic presence in the blood stream is required.
A PCR assay needs a small amount of specific DNA target sequences, as a template of the parasite, in periph-eral blood samples for an appropriate amplification. This reasoning indicates that PCR assays are promising tools. However, this analytical sensitivity was not transposed to clinical sensitivity as shown in this review. There is evidence that parasitaemia is low in the chronic phase (Castro et al. 1999, Castro & Prata 2000, de Freitas et al. 2011). Therefore, the accuracy of PCR is compromised by an unknown behaviour of T. cruzi parasitaemia in the chronic phase, where periods of detectable parasitaemia are not predictable. One way to improve the PCR perfor-mance for chronic Chagas disease diagnosis would be to detect a predictable pattern of the parasite in the blood stream and use this pattern to choose a more convenient moment to collect blood samples. A possible workaround on this limitation is to collect a series of blood samples because it may increase the probability of identifying the parasitic DNA in at least one of the samples.
Chagas disease diagnosis systematic review • Pedro Emmanuel Alvarenga Americano do Brasil et al. 16
overcome the low sensitivity of the test, although there is no evidence pointing to this direction so far. Other suggestions to improve PCR performance are: parasite concentration, to use two or more PCR assays (Fitzwater et al. 2008, Qvarnstrom et al. 2012) or to use two or more primers simultaneously. Although there is no consistent evidence that these procedures improve clinical PCR performance for chronic Chagas disease diagnosis, this later strategy was previously applied for development of a diagnostic assay of other neglected tropical diseases using loop-mediated isothermal amplification (Dinzou-na-Boutamba et al. 2014).
Concluding remarks
In conclusion, evidence supports that commercial ELISA and ELISA-rec tests’ known accuracies are prob-ably biased and overestimated. Therefore, to improve di-agnostic investigation, studies of test accuracies that are less susceptible to bias are needed. This will probably occur when key issues are adopted, such as: consecutive inclusion of suspected subjects, a reference standard for chronic Chagas disease diagnosis widely accepted in the scientific community and research with later-phase de-signs. The current recommendation to use two simultane-ous serological tests for chronic Chagas disease diagnosis is neither supported by the accuracies found in research papers nor the accuracies provided by the manufacturers. However, this recommendation may be supported by evi-dence of the heterogeneity of the available tests’ accura-cies, the absence of key data in the studies, the likelihood of overestimated accuracies, and perhaps, the prevalence of inconclusive results during clinical investigations.
PCR test usefulness is debatable and health care pro-viders should not order it as a routine test for chronic Chagas disease diagnostic investigation. The single ex-istent commercial test is not widely available, and its accuracy provided by the manufacturer is likely over-estimated. The several different in-house protocols lead to a wide range of sensitivity and specificity. PCR’s sen-sitivity is probably limited by the characteristics of the disease itself. Research/reference centres that are able to conduct PCR and perform it in selected cases, either alone or in combination with serology, are likely to bring some benefit to chronic Chagas disease diagnosis. This practice may be supported by the fact that PCR tests have the potential to detect seronegative cases. However, the performance of this combination and the frequency of these seronegative cases are unknown so far.
REFERENCES
Afonso AM, Ebell MH, Tarleton RL 2012. A systematic review of high quality diagnostic tests for Chagas disease. PLoS Negl Trop Dis 6: e1881.
Albajar P, Aparicio P, Canavate C, Castro E, Coll O, Coura JR, Dias JCP, Fumado V, Gallego M, Garate T, Gascon J, Gomez J, Her-nandez JM, Jansa JM, Junqueira ACV, Lopez MC, Muñoz J, Por-tus M, Riera C, Sauleda S, Serra T, Thomas C, Trevino B, Val-ladares B, Vilella A 2005. Diagnosis and treatment of imported Chagas disease. Med Clin (Barc) 6: 230-235.
Añez N, Romero M, Crisante G, Bianchi G, Parada H 2010. Compara-tive evaluation of serologic diagnostic tests used to detect Chagas disease in Venezuela. Bol Dir Malariol Saneam Ambient 50: 17-27.
Araújo AB, Berne MEA 2013. Conventional serological performance in diagnosis of Chagas disease in southern Brazil. Braz J Infect Dis 17: 174-178.
Arrieta R, Daquino B, Rosso N, Ferreras MG, Juarez N 2004. Evalu-ation of a screening method for Chagas disease in San Luis, Ar-gentina. Salud Publica Mex 46: 430.
Avila HA, Pereira JB, Thiemann O, de Paiva E, de Grave W, Morel CM, Simpson L 1993. Detection of Trypanosoma cruzi in blood specimens of chronic chagasic patients by polymerase chain re-action amplification of kinetoplast minicircle DNA: comparison with serology and xenodiagnosis. J Clin Microbiol 31: 2421-2426.
Barfield CA, Barney RS, Crudder CH, Wilmoth JL, Stevens DS, Mo-ra-Garcia S, Yanovsky MJ, Weigl BH, Yanovsky J 2011. A highly sensitive rapid diagnostic test for Chagas disease that utilizes a recombinant Trypanosoma cruzi antigen. IEEE Trans Biomed Eng 58: 814-817.
Batista AM, Aguiar C, Almeida EA, Guariento ME, Wanderley JS, Costa SCB 2010. Evidence of Chagas disease in seronegative Bra-zilian patients with megaesophagus. Int J Infect Dis 14: e974-e977.
Bern C, Montgomery SP, Herwaldt BL, Rassi A, Marin-Neto JA, Dantas RO, Maguire JH, Acquatella H, Morillo C, Kirchhoff LV, Gilman RH, Reyes PA, Salvatella R, Moore AC 2007. Evaluation and treatment of Chagas disease in the United States: a systemat-ic review. JAMA 298: 2171-2181.
Blejer JL 2006. Serological screening of antibodies to Trypanosoma cruzi in blood banks. Salud Cienc 15: 470.
Blum-Domínguez S, Espinoza B, Martínez-Martínez I, Maldonado-Velázquez G, Tamay-Segovia P 2011. A Trypanosoma cruzi in-fection without serologic evidence. Rev Medica Inst Mex Seguro Soc 49: 537-539.
Brasil P, de Castro L, Hasslocher-Moreno A, Sangenis L, Braga J 2010. ELISA versus PCR for diagnosis of chronic Chagas disease: sys-tematic review and meta-analysis. BMC Infect Dis 10: 337.
Britto C, Cardoso MA, Vanni CMM, Hasslocher-Moreno AM, Xavier SS, Oelemann W, Santoro A, Pirmez C, Morel CM, Wincker P 1995. Polymerase chain reaction detection of Trypanosoma cru-zi in human blood samples as a tool for diagnosis and treatment evaluation. Parasitology 110: 241-247.
Buntinx F, Aertgeerts B, Macaskill P 2009. Guidelines for conducting systematic reviews of studies evaluating the accuracy of diagnos-tic tests. In JA Knottnerus, F Buntinx (eds.), The evidence base of clinical diagnosis: theory and methods of diagnostic research, Wiley-Blackwell, Oxford, 302 pp.
Caballero ZC, Sousa OE, Marques WP, Saez-Alquezar A, Umezawa ES 2007. Evaluation of serological tests to identify Trypanosoma cruzi infection in humans and determine cross-reactivity with
Trypanosoma rangeli and Leishmania spp. Clin Vaccine Immu-nol 14: 1045-1049.
Carriazo CS, Sembaj A, Aguerri AM, Requena JM, Alonso C, Bua J, Ruiz A, Segura E, Barral JM 1998. Polymerase chain reaction procedure to detect Trypanosoma cruzi in blood samples from chronic chagasic patients. Diagn Microbiol Infect Dis 30: 183.
Carvalho MR, Krieger MA, Almeida E, Oelemann W, Shikanai-Yas-suda MA, Ferreira AW, Pereira JB, Sáez-Alquézar A, Dorlhi-ac-Llacer PE, Chamone DF, Goldenberg S 1993. Chagas disease diagnosis: evaluation of several tests in blood bank screening.
Transfusion (Paris) 33: 830-834.
17
Mem Inst Oswaldo Cruz, Rio de Janeiro, Vol. 111(1), January 2016
Castro C, Macêdo V, Prata A 1999. Comportamento da parasitemia pelo Trypanosoma cruzi em chagásicos crônicos durante 13 anos.
Rev Soc Bras Med Trop 32: 157-165.
Castro C, Prata A 2000. Absence of both circadian rhythm and Trypa-nosoma cruzi periodicity with xenodiagnosis in chronic chagasic individuals. Rev Soc Bras Med Trop 33: 427-430.
Chang CD, Cheng KY, Jiang LX, Salbilla VA, Haller AS, Yem AW, Bry-ant JD, Kirchhoff LV, Leiby DA, Schochetman G, Shah DO 2006. Evaluation of a prototype Trypanosoma cruzi antibody assay with recombinant antigens on a fully automated chemiluminescence ana-lyzer for blood donor screening. Transfusion (Paris) 46: 1737.
Chiaramonte MG, Frank FM, Furer GM, Taranto NJ, Margni RA, Malchiodi EL 1999. Polymerase chain reaction reveals Trypa-nosoma cruzi infection suspected by serology in cutaneous and mucocutaneous leishmaniasis patients. Acta Trop 72: 295.
de Andrade JP, Marin Neto JA, de Paola AAV, Vilas-Boas F, Oliveira GMM, Bacal F, Bocchi EA, Almeida DR, Fragata Filho AA, Moreira MCV, Xavier SS, de Oliveira Jr WA, Dias JCP 2011. I Latin American Guidelines for the diagnosis and treatment of Chagas heart disease. Arq Bras Cardiol 97: 1-48.
de Freitas VLT, da Silva SCV, Sartori AM, Bezerra RC, Westphalen EVN, Molina TD, Teixeira ARL, Ibrahim KY, Shikanai-Yasuda MA 2011. Real-time PCR in HIV/Trypanosoma cruzi co-infec-tion with and without Chagas disease reactivaco-infec-tion: associaco-infec-tion with HIV viral load and CD4 level. PLoS Negl Trop Dis 5: e1277.
De Marchi CR, Di Noia JM, Frasch ACC, Amato Neto V, Almeida IC, Buscaglia CA 2011. Evaluation of a recombinant Trypanoso-ma cruzi mucin-like antigen for serodiagnosis of Chagas disease.
Clin Vaccine Immunol 18: 1850-1855.
de Souza RM, Amato Neto V, Bezerra RC, Gakyia E, Braz LMA 2012. Evaluation of the “Symbiosys” immunoassay for the serological di-agnosis of Chagas disease. Rev Inst Med Trop São Paulo 54: 115-116.
De Winne K, Büscher P, Luquetti AO, Tavares SBN, Oliveira RA, Solari A, Zulantay I, Apt W, Diosque P, Rumi MM, Gironès N, Fresno M, Lopez-Velez R, Perez-Molina JA, Monge-Maillo B, Garcia L, Deborggraeve S 2014. The Trypanosoma cruzi satellite DNA OligoC-TesT and Trypanosoma cruzi kinetoplast DNA Ol-igoC-TesT for diagnosis of Chagas disease: a multi-cohort com-parative evaluation study. PLoS Negl Trop Dis 8: e2633.
Deborggraeve S, Coronado X, Solari A, Zulantay I, Apt W, Mertens P, Laurent T, Leclipteux T, Stessens T, Dujardin J-C, Herdewijn P, Büscher P 2009. T. cruzi OligoC-TesT: a simplified and standard-ized polymerase chain reaction format for diagnosis of Chagas disease. PLoS Negl Trop Dis 3: e450.
Dinzouna-Boutamba S-D, Yang H-W, Joo S-Y, Jeong S, Na B-K, In-oue N, Lee W-K, Kong H-H, Chung D-I, Goo Y-K, Hong Y 2014. The development of loop-mediated isothermal amplification tar-geting alpha-tubulin DNA for the rapid detection of Plasmodium vivax. Malar J 13: 248.
Doebler P 2015. Mada: meta-analysis of diagnostic accuracy. Available from: cran.r-project.org/web/packages/mada/vignettes/mada.pdf.
Duarte AMV, de Andrade HM, do Monte SJH, de Toledo VPCP, Guimarães TMPD 2006. Assessment of chemiluminescence and PCR effectiveness in relation to conventional serological tests for the diagnosis of Chagas disease. Rev Soc Bras Med Trop 39: 385.
Egger M, Smith GD, Altman DG 2001. Systematic reviews in health care: meta-analysis in context, BMJ, London, 31 pp.
Enciso C, Montilla M, Santacruz MM, Nicholls RS, Rodriguez A, Mer-cado M, Puerta C 2004. Comparison of the indirect immunofluores-cent (IFAT), ELISA test, and the commercial Chagatek test for an-ti-Trypanosoma cruzi antibodies detection. Biomedica 24: 104-108.
Espinoza AG, Taibi A, Billaut-Mulot O, Ouaissi A 1996. PCR-based detection of Trypanosoma cruzi useful for specific diagnosis of human Chagas disease. J Clin Microbiol 34: 485.
Ferreira AW, Belem ZR, Lemos EA, Reed SG, Campos-Neto A 2001. En-zyme-linked immunosorbent assay for serological diagnosis of Cha-gas disease employing a Trypanosoma cruzi recombinant antigen that consists of four different peptides. J Clin Microbiol 39: 4390-4395.
Ferrer E, da Conceição F, Campioli P, Lares M, López M, Rivera MG, Viettri M, Medina M, Salcedo M, Morocoima A, Herrera L 2009. Validación de protocolos de PCR para el diagnóstico molecular de la enfermedad de Chagas. Salus 12: 163-174.
Ferrer EB, Lares M, Viettri M, Medina M 2013. Comparison between immunological and molecular techniques for the diagnosis of Chagas disease. Enferm Infect Microbiol Clin 31: 277-282.
Fitzwater S, Calderón M, Lafuente C, Galdos-Cardenas G, Ferrufino L, Verastegui M, Gilman RH, Bern C 2008. Polymerase chain reaction for chronic Trypanosoma cruzi infection yields higher sensitivity in blood clot than buffy coat or whole blood speci-mens. Am J Trop Med Hyg 79: 768-770.
Flores-Chávez M, Cruz I, Rodríguez M, Nieto J, Franco E, Garate T, Cañavate C 2010. Comparison of conventional and non-con-ventional serological tests for the diagnosis of imported Chagas disease in Spain. Enferm Infecc Microbiol Clin 28: 284-293.
Gadelha AA, Vercosa AF, Lorena VM, Nakazawa M, Carvalho AB, Souza WV, Ferreira AG, Silva ED, Krieger MA, Goldenberg S, Gomes YM 2003. Chagas disease diagnosis: comparative analy-sis of recombinant ELISA with conventional ELISA and the hae-magglutination test. Vox Sang 85: 165-170.
Gil J, Pavia P, Montilla M, Florez AC, Quintero C, Mercado M, Vacca M, Nicholls S, Puerta C 2007. Comparison of a PCR test based on the histone H2A/SIRE genes with classical serological tests for the diagnosis of chronic Chagas disease in Colombian patients.
Biomedica 27 (Suppl. 1): 83-91.
Gilber SR, Alban SM, Gobor L, Bescrovaine JO, Myiazaki MI, Thomaz-Soccol V 2013. Comparison of conventional serology and PCR methods for the routine diagnosis of Trypanosoma cruzi
infection. Rev Soc Bras Med Trop 46: 310-315.
Gomes ML, Galvão LM, Macedo AM, Pena SD, Chiari E 1999. Cha-gas disease diagnosis: comparative analysis of parasitologic, mo-lecular, and serologic methods. Am J Trop Med Hyg 60: 205-210.
Gomes YM, Pereira VRA, Nakazawa M, Rosa DS, Barros MNDS, Ferreira AGP, Silva ED, Ogatta SFY, Krieger MA, Goldenberg S 2001. Serodiagnosis of chronic Chagas infection by using EIE-re-combinant-Chagas-Biomanguinhos kit. Mem Inst Oswaldo Cruz 96: 497-501.
Gorlin J, Rossmann S, Robertson G, Stallone F, Hirschler N, Nguyen KA, Gilcher R, Fernandes H, Alvey S, Ajongwen P, Contestable P, Warren H 2008. Evaluation of a new Trypanosoma cruzi antibody assay for blood donor screening. Transfusion (Paris) 48: 531-540.
Gutierrez R, Angulo VM, Tarazona Z, Britto C, Fernandes O 2004. Comparison of four serological tests for the diagnosis of Chagas disease in a Colombian endemic area. Parasitology 129: 439.
Hamerschlak N, Pasternak J, Amato Neto V, de Carvalho MB, Guerra CS, Coscina AL, Ferreira OC, Rosenblit J, Szterling LN 1997. Chagas disease: an algorithm for donor screening and positive donor counseling. Rev Soc Bras Med Trop 30: 205-209.