61
Food spectrum and trophic structure of the ichthyofauna of
Corumbá reservoir, Paraná river Basin, Brazil
Karla D. G. Luz-Agostinho*, Luis M. Bini**, Rosemara Fugi*,
Angelo A. Agostinho, and Horácio F. Júlio Jr.*
In this paper we evaluate plasticity of fish concerning diet. We expect that sampling over a large temporal and spatial scale, including environmental changes such as impoundments, will allow us to cover most of the diet plasticity. We also evaluate the efficacy of ordination method in discriminating trophic groups based on fish species diet. Data were obtained from 17 sampling stations sampled monthly from March/96 to February/99 in the Corumbá river drainage, before and after the formation of the Corumba reservoir. Diet was determined analysing 9,177 stomach contents from 64 fish species. Trophic categories were discriminated by a non-hierarchic grouping analysis named k-means, applied to diet data. Most of the species presented great trophic plasticity, eating a great variety of food items. Resources availability, estimated from all fish stomach contents, was similar among environments, except in creeks, where it varied more with a large importance of terrestrial insects. K-means present satisfactory results, identifying nine trophic groups (detritivores, herbivore-piscivores, insectivore-herbivores, omni-vores, invertiomni-vores, aquatic insectiomni-vores, piscivore-insectiomni-vores, piscivores and herbivores).
Neste estudo avaliamos a plasticidade trófica em peixes. Nós esperamos que amostras obtidas com uma ampla escala temporal e espacial, incluindo mudanças ambientais como represamentos, nos permita cobrir a maior parte desta plasticidade. Foi avaliada também a eficiência do método de ordenação em discriminar os grupos tróficos baseado na dieta das espécies. As amostragens foram realizadas mensalmente de março/96 a fevereiro/99 em 17 estações de coleta na bacia do rio Corumbá antes e após a formação do reservatório de Corumbá. Foram analisados 9177 conteúdos estomacais, pertencentes a 64 espécies. As categorias tróficas foram discriminadas através de uma análise de agrupamento não hierárquica denominada K-means aplicada aos dados de dieta. A maioria das espécies apresentou elevada plasticidade trófica, consumindo uma grande variedade de itens alimentares. A disponibilidade dos recursos alimentares, estimada através de todos os conteúdos estomacais, foi similar entre os ambientes a exceção dos riachos, onde ocorreu maior heterogeneidade e os insetos terrestres tiveram grande importância. A análise K-means revelou resultados satisfatórios, identificando nove grupos tróficos (detritívoros, herbívoro-piscívoros, insetívoro-herbívoros, onívoros, invertívoros, insetívoros aquáticos, piscívoro-insetívoros, piscívoros e herbívoros). Key words: fish diet, feeding plasticity, resources availablility.
*Núcleo de Pesquisas em Limnologia, Ictiologia e Aqüicultura, Universidade Estadual de Maringá. Maringá, PR, Brazil. e-mail: karla.dgl@uol.com.br
**Departamento de Biologia Geral, Universidade Federal de Goiás, Goiânia, GO, Brazil. e-mail: bini@icb1.ufg.br Introduction
During the colonization process of a reservoir, some popu-lations are depleted, while others show explosive growth in response to rapid environmental changes (Agostinho, 1992; Agostinho et al., 1997). The abrupt transformations in water dynamics lead to modifications in environmental conditions, altering biotic interactions and food resource proportions (Hahn et al., 1997a). Consequently, food supply appears to be an important indicator of species success during the oc-cupation of a new environment (Paiva, 1983; Petts, 1984; Rodríguez-Ruiz, 1998).
Although some fishes in tropical environments present marked trophic specializations, most exhibits great feeding flex-ibility (Agostinho et al., 1995; Araújo-Lima et al., 1995; Lowe-McConnell, 1999). Trophic plasticity can be an important strat-egy that allows the use of abundant available food resources at the beginning of reservoir formation. However, the initial abun-dant food resources (especially allochthonous) tend to decrease after the first years of the impoundment (Petrere Jr & Ribeiro, 1994; Agostinho et al., 1999), promoting population alterations that are reflected in the assemblage structure.
is fundamental for an effective conservation and manage-ment of the fish fauna. Data on fish assemblage diet over spatial and temporal scales, covering all ontogenetic species stages, supplies important information on resources avail-ability (Winemiller, 1996) and on the use of those resources (Agostinho et al., 1997).
In this paper we evaluate plasticity of fish concerning diet. We expect that sampling over a large temporal and spa-tial scale, including environmental changes (formation of the Corumbá reservoir), we will be able to cover most of the diet plasticity. We also evaluate the efficacy of ordination method in discriminating trophic groups based on fish species diet. Study area.The Corumbá river (Goiás State) is the main right-bank tributary of the Paranaíba river (Fig. 1) that, together with the Grande river, originates the Paraná river. Its drainage basin has an area of 34,000 km2 (predominantly scrubland in
the Cerrado Biome). It is an upland river and the largest part of its course is narrow, with rocky bed and steep banks (Paiva, 1982). The Corumbá river was dammed in September 1996, forming the Corumbá Hydroelectric Reservoir. Corumbá
Res-ervoir presents a surface area of 65 km2, a total volume of 1500
x 106m3, an average depth of 23 m and a hydraulic retention
time of 30 days.
Materials and Methods
Fish samples were carried out monthly from March 1996 to August 1996 (river phase), September 1996 to February 1997 (filling phase) and March 1997 to February 1999 (reser-voir phase) in 17 sites distributed in the lower Corumbá river basin and its tributaries. Sample sites were grouped in streams (sampling stations FURN, GAME, TAQU, ROCH and ARAL), river upstream (AREI and MOIT), river downstream (JUSA), reservoir (LISA, JACU, PONT, CPIR and COPE) and medium sized streams (LINI, PFOZ, PIRA and SAPE) herein named biotopes (Fig. 1). Fish were collected by a set of gillnets with different mesh sizes (between 2.4 and 16.0 cm opposite knots). Nets were set in open areas during 24 hours (checked at 08:00, 16:00 and 22:00). In littoral areas, 20 m-long seining nets (0.5 cm mesh size) were operated during the day and night. In streams, electrofishing was conducted using a 220v genera-tor equipped with 50-meter cables and two energized dip nets. All collected fish were identified and stomachs with con-tent were removed and preserved in 4% formalin, and later transferred to 70% alcohol for laboratory analysis. Voucher specimens were deposited in the Ichthyological Collection of the Núcleo de Pesquisas em Limnologia, Ictiologia e Aquicultura of the Universidade Estadual de Maringá (CI-Nupelia-UEM).
Stomach contents were examined under a stereoscopic microscope and identified to the lowest taxonomic level pos-sible. To express diet results, we used volumetric (obtained by water displacement in graduated beaker) and occurrence frequency methods (Hynes, 1950; Hyslop, 1980) combined in the Alimentary Index (IAi) proposed by Kawakami & Vazzoler (1980), described by the equation:
∑
=
=
n1 n
i i i
)
V
*
(F
V
*
F
IAi
ix 100
Where: IAi = alimentary index; i = 1, 2,.., n food item; Fi = occurrence frequency percentage and Vi = volumetric fre-quency percentage.
Food spectrum and resource availability. Food spectrum and the importance of each item to the diet were established ac-cording to the alimentary index values obtained for the entire sampling period considering all sampled biotopes. Spatial variation in the availability of resources was analyzed only after the filling of the reservoir (March 1997 to February 1999). Resource availability was inferred from the volume of food items in the stomachs analyzed for all species combined. In-ferences of this type assume that captured species exploit all resources in the environment that are susceptible to inges-tion (Lawlor, 1980; Winemiller, 1989; Winemiller & Kelso-Fig. 1. Studied area. Map of the Corumbá river, where the
Corumbá reservoir was formed, showing the sampling stations.
Gam eleira
Taquarí
P ir ap et in ga
P
ei
xe
River
Antonio Santo
Sucurí Cachoeira
Libóri o
Furna s Stream
Sap é
Taquaral
Stream
Roch
edo
17º 59’S
48
º 3
1
’W
Caldas Novas City
River
River Riv
er
R
iv
er
Stre am
River
Strea m
Stream
Stream
Co rum
bá
Riv er
scale 0 2 4km
MOIT AREI ARAL
COPE PFOZ LINI
PONT
SAPE ROCH
PIRA
CPIR
JACU TAQU
LISA
JUSA GAME
FURN
N
S
W E
Goiás State
Reservoir Tributaries (streams)
Downstream Upstream
Winemiller, 1996). Although this assumption may lead to dis-tortions (e.g. food items with different degrees of digestibil-ity), it should produce results that are closer to reality than the alternative method, i.e. quantification of various food re-sources in the environment based on different sampling meth-odologies that generate non-comparable data on resource abundances. In this study, due to the fact that contents analy-sis were restricted to sub-samples, volumes of the items were corrected by the ratio of the species in the sample, consider-ing only individuals with food in their stomach, accordconsider-ing to the equation:
∑
=
=
sn
i
i
N
n
V
D
1
)
.
(
Where: D = item availability, Vi = item volume for species i; ni = number of individuals in species i with stomach content; N = total number of individuals with stomach content in the sample; s=species number.
Ordination and trophic classification of the species based on diet. In order to classify species into trophic groups, we first ordinated the data using a Detrended Correspondence Analy-sis (DCA; Hill & Gauch, 1980; Gauch, 1994). DCA ordination allowed the analysis of the patterns of feeding similarity among the 52 species based on IAi values, which were square-root transformed, before analysis, to reduce skewness. Sec-ond, we identified trophic groups based on the scores of first two DCA axes with a nonhierarchical cluster analysis, the k-means method (STATISTICA 5.5; STASOFT, 2000). The num-ber of groups was determined following Bussab et al. (1990).
Results
Food spectrum and availability of resources. A total of 9,177 stomachs representing 64 fish species presented some type of food (Table 1). However, diet characterization was carried out only for species with more than 10 stomachs with identi-fiable food items, resulting in a data set of 9,139 stomachs representing 52 species. Intake food resources were grouped in: microcrustaceans (cladocerans, copepods, ostracods and
conchostracans), aquatic insects (dipterans, ephemeropterans, odonats, tricopterans, hemipterans, coleopterans and plecop-terans), terrestrial insects (dipterans, hymenopterans, co-leopterans, isopterans, ortopterans, homopterans, neuropter-ans, odonats, lepidopterans and hemipterans), other aquatic invertebrates (acarines, bryozoans, bivalves, nematodes, testate amoebae, oligoquetes, rotifers and decapods.), other terrestrial invertebrates (diplopods, araneans, isopods, oligoquetes, gastropods), fish (characiformes, siluriformes, cypriniformes, gymnotiformes and perciformes), other verte-brates (amphibians), algae (filamentous and unicellular), aquatic plants (bryophytes, macrophyte parts), terrestrial plants (seeds, fruits, higher plant leaves), and detritus/sedi-ment (amorphous organic material with an elevated content of mineral particles). Most of the species presented great trophic flexibility, evidenced by the incorporation of a wide variety of food resources in their diets.
The most widely consumed food resources were aquatic insects (mainly dipterans; eaten by 55 species - 85.9% of the total number of analyzed species), terrestrial plants (47 spe-cies - 73.4%), detritus/sediment (46 spespe-cies - 71.9%), terres-trial insects (mainly hymenopterans; 44 species - 68.7%), fish (mainly Characiformes; 41 species - 64.1%), algae (mainly Chlorophyceae; 32 species - 50.0%). In addition, other aquatic invertebrates (25 species - 39.1%), microcrustaceans (21 spe-cies - 32.8%), aquatic plants (14 spespe-cies - 21.9%), other terres-trial invertebrates (11 species - 17.2%) and other vertebrates (2 species - 3.1%), were also important.
The availability of these resources in the different biotopes (inferred from the volume of the food items ingested by all species) showed similar tendencies, with fish and ter-restrial plants being the most available resources (Fig. 2). However, in streams, there were more available resources, with greater importance of terrestrial insects. In the reservoir and river sections, fish constituted the basic food source. Notwithstanding, high occurance of aquatic insects were found in fish stomachs from all environments.
Ordination. The coefficient of determination between dis-tances in the ordination space and distance in the original space, for the first axis of the DCA (eigenvalue = 0.48) was equal to 0.66. This indicates that the first axis expresses most
Fig. 2. Food resource availability, inferred from the volume of food items in the stomachs analyzed for all species combined.
Microcrustaceans Aquatic insects Terrestrial insects Others aq. invert. Others ter. invert. Fishes Other vertebrates Algae Aquatic plants Terrestrial plants Detritus
0 25 50 75 100 0 25 50 75 100
Reservoir River
downstream River upstream
0 25 50 75 100 0 25 50 75 100 0 25 50 75 100
Large
tributares Streams
Volume (%) 0,13
1,93 5,42
0,03 0,34
0,10
0,06
0,04
6,85
0,48
1,57 0,42
1,42
0,40
1,17 1,25
0,33 0,02
1,96
2,15
0,01
0,02
0,08
0,95
2,65
0,20
2,48
0,19 0,17
0,50
0,37
1,50
1,56 7,59
3,84
14,87
16,08
0,24 0,02
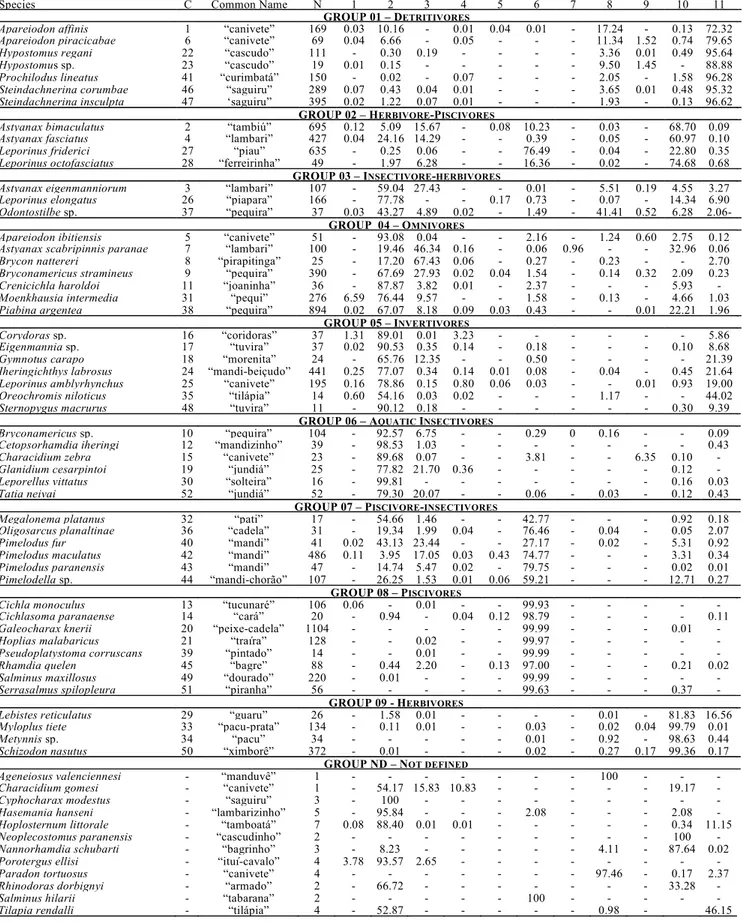
Table I. Main food resources (IAi %) consumed by fish species of the Corumbá river basin, combined for the entire sampling period and different biotopes (1=microcrustaceans; 2=aquatic insects; 3=terrestrial insects; 4=others aquatic invertebrates; 5=other terres-trial invertebrates; 6=fishes; 7=other vertebrates; 8=algae; 9=aquatic plants; 10=terresterres-trial plants; 11=detritus). C=species codes used at Figure 3; N=number of stomach contents analysed. See Trophic structure for characterization of the groups.
Species C Common Name N 1 2 3 4 5 6 7 8 9 10 11
GROUP 01 – DETRITIVORES
Apareiodon affinis 1 “canivete” 169 0.03 10.16 - 0.01 0.04 0.01 - 17.24 - 0.13 72.32
Apareiodon piracicabae 6 “canivete” 69 0.04 6.66 - 0.05 - - - 11.34 1.52 0.74 79.65
Hypostomus regani 22 “cascudo” 111 - 0.30 0.19 - - - - 3.36 0.01 0.49 95.64
Hypostomus sp. 23 “cascudo” 19 0.01 0.15 - - - 9.50 1.45 - 88.88
Prochilodus lineatus 41 “curimbatá” 150 - 0.02 - 0.07 - - - 2.05 - 1.58 96.28
Steindachnerina corumbae 46 “saguiru” 289 0.07 0.43 0.04 0.01 - - - 3.65 0.01 0.48 95.32
Steindachnerina insculpta 47 ‘saguiru” 395 0.02 1.22 0.07 0.01 - - - 1.93 - 0.13 96.62
GROUP 02 – HERBIVORE-PISCIVORES
Astyanax bimaculatus 2 “tambiú” 695 0.12 5.09 15.67 - 0.08 10.23 - 0.03 - 68.70 0.09
Astyanax fasciatus 4 “lambari” 427 0.04 24.16 14.29 - - 0.39 - 0.05 - 60.97 0.10
Leporinus friderici 27 “piau” 635 - 0.25 0.06 - - 76.49 - 0.04 - 22.80 0.35
Leporinus octofasciatus 28 “ferreirinha” 49 - 1.97 6.28 - - 16.36 - 0.02 - 74.68 0.68
GROUP 03 – INSECTIVORE-HERBIVORES
Astyanax eigenmanniorum 3 “lambari” 107 - 59.04 27.43 - - 0.01 - 5.51 0.19 4.55 3.27
Leporinus elongatus 26 “piapara” 166 - 77.78 - - 0.17 0.73 - 0.07 - 14.34 6.90
Odontostilbe sp. 37 “pequira” 37 0.03 43.27 4.89 0.02 - 1.49 - 41.41 0.52 6.28 2.06-
GROUP 04 – OMNIVORES
Apareiodon ibitiensis 5 “canivete” 51 - 93.08 0.04 - - 2.16 - 1.24 0.60 2.75 0.12
Astyanax scabripinnis paranae 7 “lambari” 100 - 19.46 46.34 0.16 - 0.06 0.96 - - 32.96 0.06
Brycon nattereri 8 “pirapitinga” 25 - 17.20 67.43 0.06 - 0.27 - 0.23 - - 2.70
Bryconamericus stramineus 9 “pequira” 390 - 67.69 27.93 0.02 0.04 1.54 - 0.14 0.32 2.09 0.23
Crenicichla haroldoi 11 “joaninha” 36 - 87.87 3.82 0.01 - 2.37 - - - 5.93 -
Moenkhausia intermedia 31 “pequi” 276 6.59 76.44 9.57 - - 1.58 - 0.13 - 4.66 1.03
Piabina argentea 38 “pequira” 894 0.02 67.07 8.18 0.09 0.03 0.43 - - 0.01 22.21 1.96
GROUP 05 – INVERTIVORES
Corydoras sp. 16 “coridoras” 37 1.31 89.01 0.01 3.23 - - - 5.86
Eigenmannia sp. 17 “tuvira” 37 0.02 90.53 0.35 0.14 - 0.18 - - - 0.10 8.68
Gymnotus carapo 18 “morenita” 24 - 65.76 12.35 - - 0.50 - - - - 21.39
Iheringichthys labrosus 24 “mandi-beiçudo” 441 0.25 77.07 0.34 0.14 0.01 0.08 - 0.04 - 0.45 21.64
Leporinus amblyrhynchus 25 “canivete” 195 0.16 78.86 0.15 0.80 0.06 0.03 - - 0.01 0.93 19.00
Oreochromis niloticus 35 “tilápia” 14 0.60 54.16 0.03 0.02 - - - 1.17 - - 44.02
Sternopygus macrurus 48 “tuvira” 11 - 90.12 0.18 - - - 0.30 9.39
GROUP 06 – AQUATIC INSECTIVORES
Bryconamericus sp. 10 “pequira” 104 - 92.57 6.75 - - 0.29 0 0.16 - - 0.09
Cetopsorhamdia iheringi 12 “mandizinho” 39 - 98.53 1.03 - - - 0.43
Characidium zebra 15 “canivete” 23 - 89.68 0.07 - - 3.81 - - 6.35 0.10 -
Glanidium cesarpintoi 19 “jundiá” 25 - 77.82 21.70 0.36 - - - 0.12 -
Leporellus vittatus 30 “solteira” 16 - 99.81 - - - 0.16 0.03
Tatia neivai 52 “jundiá” 52 - 79.30 20.07 - - 0.06 - 0.03 - 0.12 0.43
GROUP 07 – PISCIVORE-INSECTIVORES
Megalonema platanus 32 “pati” 17 - 54.66 1.46 - - 42.77 - - - 0.92 0.18
Oligosarcus planaltinae 36 “cadela” 31 - 19.34 1.99 0.04 - 76.46 - 0.04 - 0.05 2.07
Pimelodus fur 40 “mandi” 41 0.02 43.13 23.44 - - 27.17 - 0.02 - 5.31 0.92
Pimelodus maculatus 42 “mandi” 486 0.11 3.95 17.05 0.03 0.43 74.77 - - - 3.31 0.34
Pimelodus paranensis 43 “mandi” 47 - 14.74 5.47 0.02 - 79.75 - - - 0.02 0.01
Pimelodella sp. 44 “mandi-chorão” 107 - 26.25 1.53 0.01 0.06 59.21 - - - 12.71 0.27
GROUP 08 – PISCIVORES
Cichla monoculus 13 “tucunaré” 106 0.06 - 0.01 - - 99.93 - - -
Cichlasoma paranaense 14 “cará” 20 - 0.94 - 0.04 0.12 98.79 - - - - 0.11
Galeocharax knerii 20 “peixe-cadela” 1104 - - - 99.99 - - - 0.01 -
Hoplias malabaricus 21 “traíra” 128 - - 0.02 - - 99.97 - - -
Pseudoplatystoma corruscans 39 “pintado” 14 - - 0.01 - - 99.99 - - -
Rhamdia quelen 45 “bagre” 88 - 0.44 2.20 - 0.13 97.00 - - - 0.21 0.02
Salminus maxillosus 49 “dourado” 220 - 0.01 - - - 99.99 - - -
Serrasalmus spilopleura 51 “piranha” 56 - - - 99.63 - - - 0.37 -
GROUP 09 - HERBIVORES
Lebistes reticulatus 29 “guaru” 26 - 1.58 0.01 - - - - 0.01 - 81.83 16.56
Myloplus tiete 33 “pacu-prata” 134 - 0.11 0.01 - - 0.03 - 0.02 0.04 99.79 0.01
Metynnis sp. 34 “pacu” 34 - - - - - 0.01 - 0.92 - 98.63 0.44
Schizodon nasutus 50 “ximborê” 372 - 0.01 - - - 0.02 - 0.27 0.17 99.36 0.17
GROUP ND – NOT DEFINED
Ageneiosus valenciennesi - “manduvê” 1 - - - 100 - - -
Characidium gomesi - “canivete” 1 - 54.17 15.83 10.83 - - - 19.17 -
Cyphocharax modestus - “saguiru” 3 - 100 - - -
Hasemania hanseni - “lambarizinho” 5 - 95.84 - - - 2.08 - - - 2.08 -
Hoplosternum littorale - “tamboatá” 7 0.08 88.40 0.01 0.01 - - - 0.34 11.15
Neoplecostomus paranensis - “cascudinho” 2 - - - 100 -
Nannorhamdia schubarti - “bagrinho” 3 - 8.23 - - - - - 4.11 - 87.64 0.02
Porotergus ellisi - “ituí-cavalo” 4 3.78 93.57 2.65 - - -
Paradon tortuosus - “canivete” 4 - - - 97.46 - 0.17 2.37
Rhinodoras dorbignyi - “armado” 2 - 66.72 - - - 33.28 -
Salminus hilarii - “tabarana” 2 - - - 100 - - -
of the information contained in the original data matrix. The same coefficients for axes 2 (eigenvalue = 0.14) and 3 (0.05) were equal to 0.20 and 0.0, respectively. Thus, the third axis adds little to the original data representation and was not considered in this study.
According to species and food items scores along axis 1, species 23, 41, 46, 47, 22, 1 and 6 tended to consume items of aquatic origin, mainly detritus and plants (species scores below 150 - Figs. 3 a-b; see species codes in Table 1). On the other hand, species with scores above 150 (species 27, 28, 2, 34, 50, 33 and 4) tended to consume terrestrial origin items (mainly plants and insects), and fish (species 36, 44, 42 and 43). For the species with greater scores, fish was dominant (species 13, 14, 20, 21, 39, 45, 49 and 51).
These tendencies are corroborated when species scores along axis 1 of the DCA are contrasted with the original val-ues of the food items (Fig. 4), i.e. algae and detritus at one extreme and fish at the other. It should be emphasized that the ordination pattern of species along axis 1 of the DCA was determined mainly by these three food items. The ordination pattern of species along axis 2, was determined mainly due to aquatic insects and terrestrial plants (Fig. 5). Species 10, 12, 15, 19, 30 and 52, with low scores along axis 2, tend to present higher IAi values for aquatic insects, whereas species with high scores (50, 34, 33 and 29), tend to present higher IAi values for terrestrial plants.
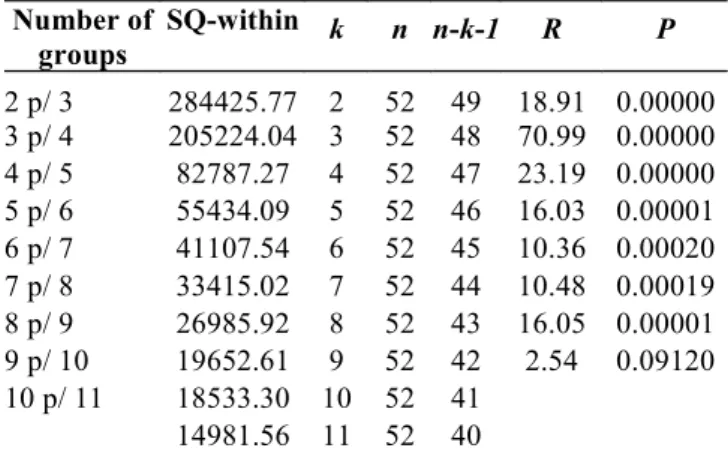
Classification of the species into trophic groups. Using k-means analysis on the scores derived from DCA axes 1 and 2, it was possible to discriminate nine groups of species with similar diets. The R statistic demonstrates that new groups did not significantly reduce (P=0.09) the variance within groups, revealing that nine seems to be the most parsimoni-ous number of groups for the data collection (Table 2). The nine groups are presented in Table 1. The species scores, along axes 1 and 2 of the DCA (Fig. 3a), are symbolized differ-ently with the objective of better visualizing the nine groups. The nine groups are distinguished by the following char-acteristics:
Group 01 - detritivores: seven species (13.4% of the species analyzed) that exploit predominantly the bottom, ingesting large quantities of detritus/sediment (IAi>70%), together with algae, aquatic insect larvae, fragments of adult insects and plants, and other benthic invertebrates.
Group 02 - herbivore-piscivores: four species (7.7%) that consume plants (predominantly), fish and insects.
Group 03 - insectivore-herbivores: three species (5.7%) that ingest large quantities of larvae or nymphs of insects, to-gether with algae (mainly filamentous) and plants.
Group 04 - omnivores: seven species (13.4%) whose con-sumption ranges from algae (unicellular and filamentous) to
Fig. 3. Detrended correspondence analysis (DCA) scores of the species (a) and food items (b) along axes 1 and 2. Differ-ent symbols in (A) indicate the groups idDiffer-entified by k-means. Species are coded numerically and represented in Table 1.
Fig. 4. Relationship between square-root transformed IAi values for fish, algae and detritus and DCA axis 1.
Fig. 5. Relationship between square-root transformed IAi values for aquatic and terrestrial insets and DCA axis 2.
DCA 1 6 23 41 1 28 27 4 2 37 26 3 8 9 7 38 31 5 11 1718 48 35 25 15 19 44 40 42 43 32 36 51 49 50 34 33 29 -20 20 60 100 140 180 220 260
-50 0 50 100 150 200 250 300 350
(a) 46 47 22 45 14 13 39 20 21 10 52 12 30 24 16 D C A 2 G1 G2 G3 G4 G5 G6
G7 G8
G9
DCA 1
DCA 2 microcrust.
aqu. insects terr. insects aqu. invertebrates terr. invertebrates fishes vertebrates algae aqu.vegetation terr.vegetation detritus -40 0 40 80 120 160 200 240 280
-50 0 50 100 150 200 250 300 350
terrestrial source aquatic source (b) DCA 2 Valores d e IAI -1 1 3 5 7 9 11
-20 20 60 100 140 180 220 260
aquatic insects terrestrial plants DCA 1 IA I Values 0 2 4 6 8 10
-50 0 50 100 150 200 250 300 350
Table 2. Results used to calculate the R statistic, which evaluates if the increase from k to k + 1 groups is significant. SQ -Within = Total sum of squares within; n = number of species (objects); n - k - 1 = degrees of freedom; P = probability of type I error.
Number of groups
SQ-within k n n-k-1 R P
2 p/ 3 284425.77 2 52 49 18.91 0.00000 3 p/ 4 205224.04 3 52 48 70.99 0.00000 4 p/ 5 82787.27 4 52 47 23.19 0.00000 5 p/ 6 55434.09 5 52 46 16.03 0.00001 6 p/ 7 41107.54 6 52 45 10.36 0.00020 7 p/ 8 33415.02 7 52 44 10.48 0.00019 8 p/ 9 26985.92 8 52 43 16.05 0.00001 9 p/ 10 19652.61 9 52 42 2.54 0.09120 10 p/ 11 18533.30 10 52 41
14981.56 11 52 40
higher plants, and from invertebrates to fish. However, they ingest preferentially aquatic and terrestrial insects.
Group 05 - invertivores: seven species (13.4%) that are bot-tom feeders, ingesting organisms from the benthic fauna. In this category, the item “fish” refers to scales. Aquatic insects are the most important item for these species (>55%), together with detritus/sediment.
Group 06 - aquatic insectivores: six species (11.6%) that in-gest predominantly aquatic insects (>77%), especially larvae and nymphs, with emphasis on diptera larvae. They present low incidence of detritus/sediment in the contents.
Group 07 - piscivore-insectivores: six species (11.6%) whose diets are dominated by fish and insects (especially aquatic). Group 08 - piscivores: eight species (15.5%) that intake es-sentially fish (>96%). They can complement their diets with insects, plants and other invertebrates, but at very low pro-portions.
Group 09 - herbivores: four species (7.7%) that feed essen-tially on plant parts (>98%), especially terrestrial (>82%).
Discussion
In general, fish species are endowed with great diet plas-ticity. This fact is easily observed when we compare informa-tion originating from different biotopes (Agostinho et al., 1997; Gaspar da Luz & Okada, 1999) or from the same biotope in different ontogenetic phases (Hahn et al., 1997b) or peri-ods (Fugi, 1998; Hahn et al., 1997a). Ontogenetic changes in the diet and the opportunist behavior of many fish species in consuming alternate food resources in the absence of prefer-ential food have been the object of broad discussion in the literature (Nikolsky, 1963; Keast, 1977; Dill, 1983; Gerking, 1994). According to Gerking (1994), when there is a shortage of a certain preferential resource (for example, due to environ-mental conditions), most fish species can intake temporarily the more available resource. Lowe-McConnell (1999) relates
a similar fact to tropical fish species. Given the alimentary flexibility exhibited by fishes, it is important that investiga-tions regarding species diet spectrum are based on all life stages over a wide spatial and temporal scales. Although this study investigates only part of the total distribution area of most of the species, the fact that it covers wide ontogenetic, seasonal and biotopic variations, should give more realistic results.
Most of the species examined in this study presented a wide alimentary spectrum. Thirty-five percent varied their di-ets eating items as different as fish, algae, higher plants, in-sects and detritus. Among the identified trophic groups, only piscivores and herbivores were restrictive in relation to the items ingested.
The incorporation of terrestrial insects caused by sudden variation in water level of the reservoir should determine the wide availability of this resource. Complementally, the large number of small-sized species and the abundance of juve-niles of large-sized species (with other feeding preferences as adults) should be related to the wide occurrence of this item in the diet.
Terrestrial plants were common in the diet of the species (74%) and represented a substantial amount of the biomass ingested, especially in biotopes outside of the reservoir. The lower availability of terrestrial plants in the dammed area, when compared to other environments, could be due to the fact that samplings for this analysis began six months after dam-ming, when younger plant parts (preferentially consumed by fishes) had already decomposed. Water level fluctuation, which limited the development of terrestrial and riparian veg-etation in the reservoir zone, is a barrier for the availability of this resource.
The resource “fish”, present in the diet of 64% species, had the greatest availability in all habitats, except streams. This result can be partially explained by population explo-sions of forage fish species, as a result of increased availabil-ity of food resources provided by the flooding of large terres-trial areas and the period of dam closure. So, the formation of Corumba reservoir, impounded in September 1997, overlapped with the reproductive period of many forage species. Besides this, during reservoir filling, a high amount of terrestrial or-ganic matter is incorporated in the aquatic system resulting in a marked increase in the availability of food resources that can be ingested by small-sized and opportunists species (Agostinho et al., 1999). As a consequence of the prolifera-tion of these species, there is an increase in piscivores. The fact that the availability of fish, inferred from the stomach contents volume of all species, surpassed plants and detritus for most of the biotopes considered, results from the partial approach of the food web, which is restricted to fish and, even so, excludes the larval and juvenile phases (generally with lower positions in the food web).
Lowe-McConnell, 1999; Araújo-Lima et al., 1995). However, various studies indicated the great importance of attached algae and aquatic larvae of insects (Teixeira, 1989; Henderson & Walker, 1990; Sabino & Castro, 1990; Lowe-McConnell, 1991). Thus, the relative importance of allochthonous and autochthonous foods for stream fish assemblages may be dependent on the environmental conditions of the specific stream studied (e.g. amount of vegetation cover in the water-shed, water transparency and velocity, etc.).
The instability of a recently dammed environment, with resources that are both qualitatively and quantitatively un-usual, is a strong source of bias when one tries to character-ize trophic groups. Even so, the multivariate analysis based on food resources discriminated the groups that used terres-trial, aquatic and fish along the gradient.
The fish assemblage of Corumbá reservoir species pre-sented high diet plasticity, except for a small group of herbi-vores and detritiherbi-vores, which are characterized by marked morphological adaptations that may restrict the use of other resources. This indicates that diet studies carried out under variable environmental conditions (e.g. along a riverine-lacus-trine gradient) are efficient in revealing the amplitude of the alimentary spectrum of species that do not present marked morphological restriction. This was not the case for a re-stricted group of piscivores that consumed fish almost exclu-sively, but do not show morphological restrictions in taking other small items like insects and other invertebrates, as de-scribed by studies in different areas of the Paraná river basin (Almeida et al., 1997; Penczak et al., 2000).
In new formed reservoirs, the high heterogeneity of food resources provides an excellent opportunity to evaluate diet plasticity of fishes. However, in the phase that the Corumbá reservoir is, it was difficult to set up reliable species prefer-ences (patterns), and, therefore, to put them in trophic cat-egories, even using the ordination and classification meth-ods employed in this study. This plasticity appears to be important in determining species success in reservoirs.
Acknowledgements
We are grateful to Nupélia/UEM and FURNAS Centrais Elétricas for supporting this study, to CNPq for the grant, to Luiz Carlos Gomes, David J. Hoeinghaus (Texas A&M Uni-versity) and John Jervis for reviewing the English.
Literature Cited
Agostinho, A. A. 1992. Manejo de recursos pesqueiros em reserva-tórios. Pp.106-121. In: Agostinho, A. A. & E. Benedito-Cecilio (Eds.). Situação atual e perspectivas da Ictiologia no Brasil. EDUEM, Maringá, 127p.
Agostinho, A. A., A. E. A. M. Vazzoler, & S. M. Thomaz. 1995. The High river Paraná basin: limnological and ichthyological aspects. Pp.59-103. In: Tundisi, J. G., C. E. M. Bicudo & T. Matsumura-Tundisi (Eds.). Limnology in Brazil. ABC/SBL, Rio de Janeiro, 376p.
Agostinho, A. A., C. M. L. Ferretti, L.C. Gomes, N. S. Hahn, H. I. Suzuki, R. Fugi & F. Abujanra. 1997. Ictiofauna de dois reservatórios do rio Iguaçu em diferentes fases de coloniza-ção: Segredo e Foz do Areia. Pp. 257-292. In: Agostinho, A. A. & L. C. Gomes (Eds.). Reservatório de Segredo: bases ecológicas para o manejo. EDUEM, Maringá, 387p. Agostinho, A. A., L. E. Miranda, L. M. Bini, L.C. Gomes, S. M.
Thomaz & H. I. Suzuki. 1999. Patterns of colonization in neotropical reservoirs, and prognoses on aging. Pp. 227-265. In: Tundisi, J. G. & M, Straskraba (Eds.). Theoretical reservoir ecology and its applications. Backhuys Publishers, Leiden, 585p. Almeida, V. L. L., N. S. Hahn & A. E. A. M.Vazzoler. 1997. Feeding patterns in five predatory fishes of the high Paraná river floodplain (PR, Brazil). Ecology of Freshwater Fish, 6: 123-133.
Araújo-Lima, C. A. R. M., A. A. Agostinho & N. N. Fabré. 1995 Trophic aspects of fish communities in brazilian rivers and reservoirs. Pp.105-136. In: Tundisi, J. G., C. E. M. Bicudo & T. Matsumura-Tundisi (Eds.). Limnology in Brazil. ABC/SBL, Rio de Janeiro, 376p.
Bussab, W. O., E. S. Miazaki & D. F. Andrade. 1990. Introdução à análise de agrupamentos. Simpósio Brasileiro de Probabilidade e Estatística, IME-USP, São Paulo, 105p.
Dill, L. M. 1983. Adaptive flexibility in the foraging behaviour of fishes. Canadian Journal Fisheries Aquatic Sciences, 40: 398-408. Fugi, R. 1998. Ecologia alimentar de espécies endêmicas de lambaris do trecho médio da bacia do rio Iguaçu. Unpublished Ph.D. Thesis, Universidade Federal de São Carlos, São Paulo. 88p. Gauch, H. G., Jr. 1994. Multivariate analysis in community ecology.
Cambridge, Cambridge University Press, 298p.
Gaspar da Luz, K. D. & E. K. Okada. 1999. Diet and dietary overlap of three sympatric fish species in lakes of the upper Paraná river floodplain. Brazilian Archives of Biology and Technology, 42: 441-447.
Gerking, S. D. 1994. Feeding ecology of fish. San Diego, Califórnia, Academic Press, 416p.
Hahn, N. S., R. Fugi, V. L. L. Almeida, M. R. Russo & V. E. Lourei-ro. 1997a. Dieta e atividade alimentar de peixes do reservatório de Segredo. Pp.141-162. In: Agostinho, A. A. & L. C. Gomes (eds.). Reservatório de Segredo:bases ecológicas para o manejo. EDUEM, Maringá, 387p.
Hahn, N. S., A. A. Agostinho & R. Goitein. 1997b. Feeding ecology of curvina Plagioscion squamosissimus (Hechel, 1840) (Osteichthyes, Perciformes) in the Itaipu reservoir and Porto Rico floodplain. Acta Limnologica Brasiliensia,9: 11-22. Henderson, P. A. & I. Walker. 1990. Spatial organization and
population density of the fish community of the litter banks within a Central Amazonian blackwater stream.Journal of Fish Biology, 37: 401-411.
Hill, M. O. & H. G. Gauch. 1980. Detrended correspondence analysis: an improved ordination technique, Vegetatio,42: 47-58. Hynes, H. B. N. 1950. The food of freshwater sticklebacks (
Gaste-rosteus aculeatus and Pygosteus pungitius), with a review of
methods used in studies of the food of fishes. Journal of Animal Ecology,19: 36-58.
Hyslop, E. J. 1980. Stomach contents analysis, a review of methods and their application. Journal of Fish Biology, 17: 411-429. Kawakami, E. & G. Vazzoler. 1980. Método gráfico e estimativa de
índice alimentar aplicado no estudo de alimentação de peixes. Boletim do Instituto Oceanográfico29: 205-207.
Knoppel, H. A. 1970. Food of Central Amazonian fishes. Contribution to the nutrient ecology of Amazonian rain forest streams. Amazoniana,2: 257-352.
Lawlor, L. R. 1980. Overlap, similarity, and competition coefficients, Ecology 61: 245-251.
Lowe-Mcconnell, R. H. 1991. Natural history of fishes in Araguaia and Xingu Amazonian tributaries, Serra do Roncador, Mato Gros-so, Brazil. Ichthyological Exploration of Freshwaters, 2: 63-82. Lowe-McConnell, R. H. 1999. Estudos ecológicos de comunidades
de peixes tropicais.Editora da USP, São Paulo, 535p. Nikolsky, G. V. 1963. The ecology of fishes. Academic Press,
London, 352p.
Paiva, M. P. 1982. Grandes represas do Brasil. Brasília: Editerra. 292p. Paiva, M. P. 1983. Peixes e pescas de águas interiores do Brasil.
Brasília: Editerra, 1983.
Penczak, T., A. A. Agostinho & N. S. Hahn. 2000. An ordination technique for fish diet comparisons. Brazilian Archives of Biology and Technology 43: 101-110.
Petrere, M. & M. C. L. B Ribeiro. 1994. The impact of a large tropical hydroelectric dam: the case of Tucurui in the middle river Tocantins. Acta Limnológica Brasiliensia, 5: 123-133. Petts, G. E. 1984. Impounded rivers: perspectives for ecological
management. John Wiley & Sons, Chichester, 326p.
Rodrigues-Ruiz, A. 1998. Fish species composition before and after construction of a reservoir on the Guadalete river (SW Spain). Archive für Hydrobiologie, 142: 353-369.
Sabino, J. & R. M. C. Castro. 1990. Alimentação, período de ativi-dade e distribuição espacial dos peixes de um riacho da floresta Atlântica (Sudeste do Brasil). Revista Brasileira de Biologia, 50: 23-36.
Stasoft, Inc. 2000. STATISTICA for Windows (Computer Program Manual). Version 5.5, Tulsa, OK.
Teixeira, R. L. 1989. Aspectos da ecologia de alguns peixes do ar-roio Bom Jardim, Triunfo, RS. Revista Brasileira de Biologia, Rio de Janeiro, 49(1): 183-192.
Welcomme, R. L. 1985. River fisheries. FAO Fisheries Technical Paper, no.262.
Winemiller, K. O. 1986. Dynamic diversity in fish assemblages of tropical rivers. In: Cody, M. L. & R. Smallwood (Eds.). Long-term studies of vertebrate communities. Orlando, Florida: Aca-demia Press, 99-134.
Winemiller, K. O. 1989. Ontogenetic diet shifts and resource partitioning among piscivorous fishes in the Venezuelan Ilanos. Environmental Biology of Fishes, 26 (1): 177-199.
Winemiller, K. O. & L. C. Kelso-Winemiller. 1996. Comparative ecology of catfishes of the upper Zambezi river floodplain. Journal of Fish Biology, 49 (6): 1043-1061.