(Annals of the Brazilian Academy of Sciences) ISSN 0001-3765
www.scielo.br/aabc
Spatial variation in the stable isotopes of
13C and
15N and trophic position of
Leporinus friderici
(Characiformes, Anostomidae) in Corumbá Reservoir, Brazil
ALEXANDRE L. PEREIRA1, EVANILDE BENEDITO2 and CÁSSIA M. SAKURAGUI3 1Departamento de Agronomia, Universidade Estadual de Maringá
Avenida Colombo, 5790, 87020-900 Maringá, PR, Brasil
2Núcleo de Pesquisas em Limnologia, Ictiologia e Aqüicultura, Departamento de Biologia
Programa de Pós-graduação em Ecologia de Ambientes Aquáticos Continentais, Universidade Estadual de Maringá Avenida Colombo, 5790, 87020-900 Maringá, PR, Brasil
3Departamento de Biologia, Universidade Estadual de Maringá Avenida Colombo, 5790, 87020-900 Maringá, PR, Brasil
Manuscript received on August 11, 2005; accepted for publication on August 8, 2006; presented byLUCIAMENDONÇAPREVIATO
ABSTRACT
Stable isotopes of carbon (δ13C) and nitrogen (δ15N) were used to describe sources of energy and trophic position for
adultLeporinus fridericiin the area of the Corumbá Reservoir, Brazil. Samples were collected from April 1999 to March
2000. Spatial variations were not identified in the isotopic composition. The maximum and minimum contribution of C4plants calculated integrating the variation of plants and fish were 47.7% and 2.4%, respectively. Among C3plants, periphyton presented closer isotopic values to those observed for fishes, corresponding to an important carbon source. The proportion of ingested plant item is larger in rivers upstream from the reservoir (42.7%), which justifies the smaller trophic level among there. However, in the reservoir, the ingestion of fish was 81.4%, while ingested plants contributed with 18.6%. Downstream from the dam, participation of plant item was even smaller (14.4%). Although the trophic position calculated with diet data was proportional to the one calculated withδ15N values, the former elevated the
trophic level ofL. fridericiin the food web, because estimated trophic positions were based on fish items belonging to
the 2nd(a) and to the 3rd(b) trophic levels.
Key words:stable isotopes, reservoir,Leporinus friderici, food web.
INTRODUCTION
The use of stable isotopes of carbon (δ13C) and nitro-gen (δ15N) has been intensified in the last years (Hob-son and Wassenaar 1999). These isotopes are used to describe sources of energy and trophic relationships in food chains of terrestrial, marine and freshwater ecosys-tems (Peterson and Fry 1987). Theδ13C usually iden-tifies pathways of carbon transference, starting from the primary producers, whereas theδ15N characterizes the trophic position of the organisms in food chains
(Van-Correspondence to: Alexandre Leandro Pereira E-mail: alexmga@yahoo.com.br
der Zanden et al. 1997). The amount ofδ15N in tissues of consumers is, usually, enriched in 3◦/
◦◦ in relation to
their prey. However, δ13C is slightly enriched (1◦/◦◦)
lighter isotope during fixation of carbon, C3 plants are
significantly more enriched in12C. These isotopic
differ-ences turn relatively easy to identify carbon of C3and C4
plants (Forsberg et al. 1993).
Primary sources of energy in the area of influence of Corumbá Reservoir are C4grasses, C3plants (constituted
by the riparian vegetation), phytoplankton and periphy-ton (Benedito-Cecilio et al. 2004). Aquatic macrophytes are scarce in the area of the Corumbá Reservoir (Luz-Agostinho et al. 2006). Studies have indicated that, in spite of the great quantity of biomass produced by C4
plants, isotopic carbon signatures in fish are more re-lated to algae based food web (Araújo-Lima et al. 1986, Forsberg et al. 1993).
Leporinus friderici is an abundant species in the
Corumbá Reservoir (Agostinho et al. 1999). This species is economically important in other areas of the Paraná River basin, in spite of the environmental modifications imposed by impoundments (Agostinho et al. 1989, 1994). Ecological studies withLeporinus fridericiwere
conducted in the Brazilian stretch of Paraná River with-out dams (Andrian et al. 1994, Vazzoler et al. 1997), in Itaipu Reservoir (Agostinho et al. 1992, Benedito-Cecilio et al. 1997) and in the dammed stretch of the basin (Lopes et al. 2000, Benedito-Cecilio et al. 2005). These studies generated valuable information to support management actions.
Studies using stable isotopes of carbon were firstly carried out in the Amazonian ecosystem in the 80’s (Araújo-Lima et al. 1986, Martinelli et al. 1991, Fors-berg et al. 1993). However, for the Paraná River, isotope ratios were not described so far for any biotic compo-nent. Concepts of energy that flows in food webs have only been based on diet analysis and stomach content of fish, which maybe limited due to difficulties in identify-ing food items, or, when they can be identified, it is not safe to affirm that such items would be assimilated and, therefore, they will contribute to production (Jennings et al. 1997). In the present work, isotopic ratios of car-bon and nitrogen of muscles of adultLeporinus friderici
the composition of the food ingested by the species.
MATERIALS AND METHODS
Leporinus friderici(Bloch 1794) was collected monthly
from April 1999 to March 2000 in nine sites distributed in the lower Corumbá River basin and its tributaries local-ized predominantly scrubland in the Cerrado Biome. The Corumbá River dammed in September 1996, forming the Corumbá Hydroelectric Reservoir. Corumbá Reser-voir presents a surface area of 65 km2, a total volume
of 1500×106 m3, an average depth of 23 m and a
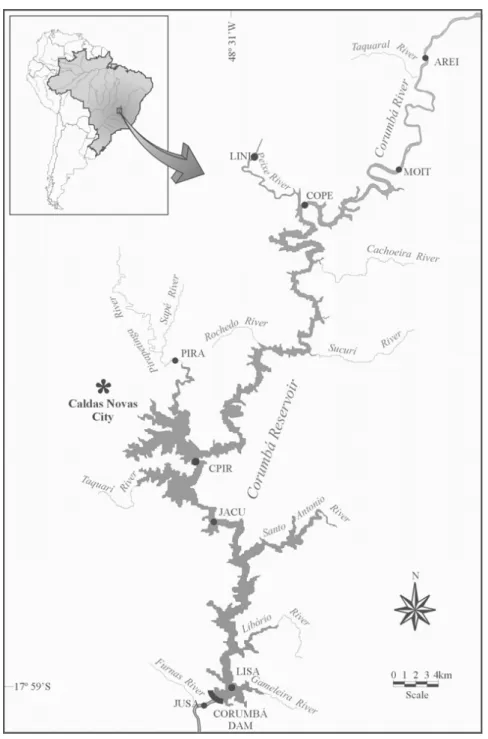
hy-draulic retention time of 30 days (Luz-Agostinho et al. 2006). Sample sites were grouped in three characteristic biotopes defined considering the influence of Corumbá Reservoir: (1) streams lotic and semi-lotic characteristics upstream from the reservoir (COPE, MOIT, AREI and PFOZ); (2) stations inside the reservoir (LISA, JACU, CPIR and PIRA); and (3) river downstream from the dam (JUSA) (Figure 1).
Gillnets with different mesh sizes were used to cap-ture fish. For each fish, standard length (Ls) and total weight (Wt) were obtained. A sample of the muscle close to the insertion of the dorsal fin was removed from each individual. Leaves of C3(riparian vegetation) and
C4 (grasses) plants were sampled on bank areas. No
aquatic macrophytes were found. Periphyton samples were washed in distilled water, filtered and maintained in fiberglass filter. Filters (GF/C Whatman) were pre-viously undergone combustion at 550◦C for 4 hours.
Filtered samples were rinsed in 1N HCl solution to re-move carbonates. Particulate Organic Carbon (POC) and zooplankton samples were collected respectively with 25µm- and 75µm -mesh nets. These samples were also conditioned in fiberglass filters.
To determine theδ13C of phytoplankton is prob-lematic due to contamination by carbon from vascular plants. Considering the results presented in Fry and Sherr (1984) for food webs of aquatic communities, the isotopic composition of phytoplankton was established through zooplankton with 1◦/
Fig. 1 – Map showing position of sampling sites (•).
level. Based on this criterion, results of phytoplankton were limited to the inner areas of the reservoir (about 40km above the dam), because this area presented the higher abundance of zooplankton (Velho et al. 2001). Samples were dried at 60◦C and sent to the Institute of
Ecology and Analytic Chemistry Laboratory in Georgia,
USA, and to the Stable Isotope Facility – Department of Agronomy and Range Science in California, USA, for determination ofδ13C andδ15N ratios by mass spec-trometer.
To determine the relative importance of C4 plants
%C4 = C4plants contribution;
δ13Cfish = mean value ofδ13C forL. friderici; δ13CC3 = mean value ofδ13C for C3plants; δ13CC4 = mean value ofδ13C for C4plants.
According to defined mean values of carbon for the groups of plants of the area of influence of Corumbá Reservoir (Benedito-Cecilio et al. 2004), the most nega-tive group (phytoplankton = –29,4◦/
◦◦) was used to
cal-culate the maximum contribution of C4plants, while the
less negative group (periphyton = –21,6◦/
◦◦) was used to
calculate the minimum contribution. The percentage of the carbon originated from C3plants, by definition, was
%C3= (%C4) –100.
Trophic position (TP) based onδ15N was calculated according to formula (Vander Zanden et al. 1997):
TP = δ
15N
fish − 5.7 3.4
+ 1
where:
δ15Nfish = mean value ofδ15N forL. friderici;
5.7 = averageδ15N for vascular plants; 3.4 = increase of trophic level forδ15N.
The enrichment ofδ15N was calculated in 3.4◦/◦◦
for trophic level (Fry 1988, Vander Zanden et al. 1997). Diet of the species was described in Hahn et al. (2004). Diet-based mean trophic position (MTP) was estimated by the formula (Winemiller 1990, Vander Zanden and Rasmussem 1996):
MTP = (Cn · Tn) + 1
where:
Cn = percentage contribution of the nthfood item;
Tn = trophic position of nthfood item.
Values of the trophic position estimated for items ingested by the species were: 3 – carnivorous-prey; 2.5 – omnivorous-prey; 2 – herbivorous-prey; 1 – for primary producers (Vander Zanden et al. 1997).
and an average of –28.8◦/
◦◦ for the entire fish
assem-blage (Forsberg et al. 1993). The low value could be related to the formation of Corumbá Reservoir that influ-enced the access to the sources of energy for the species. The analysis of stomach content, in river phase and im-mediately after Corumbá Reservoir filling (Ferreira et al. 2002, Luz-Agostinho et al. 2006), demonstrated varia-tions in diet of species. In the river phase, the item fish was predominant in those the diet, whereas in the reser-voir phaseL. fridericiingested, basically, plants and a
small proportion of fish and insects. These findings are reinforced by Andrian et al. (1994) for the Paraná River floodplain, which classified the species as opportunist.
TABLE I
Means values ofδ13C andδ15N (◦/◦◦) forL. fride-rici sampled in the area of influence of Corumbá Reservoir (n = number of specimens, SD = standard deviation).
Environment N δ13C±SD δ15N±SD
River 4 −21.8±2.3 9.0±1.0 Reservoir 4 −21.4±1.4 9.7±1.2 Downstream 4 −21.1±1.7 11.3±1.7 Mean values −21.4±1.7 10.0±1.6
Isotopic variations ofδ13C for primary producers analyzed by Benedito-Cecilio et al. (2004) in the same area are presented in the Figure 2. C4plants were strongly
enriched in δ13C (–2.7◦/◦◦ ±0.7), but phytoplankton
was the more negative group (–29.3◦/
◦◦ ±1.6).
Phy-toplankton carbon is usually lighter than vascular plants carbon (Hamilton and Lewis 1992, Victoria et al. 1992). However, in the area studies C3 plants (riparian
vege-tation, C3 grasses, periphyton and phytoplankton)
pre-sented significant different isotopic ratios (F3,22= 22.59; p < 0.001). Periphyton presented positive values of δ13C (–21.6◦/◦◦;±3.4). Nevertheless, planktonic and
Phyto POC Peri C4 C3
Groups -32
-28 -24 -20 -16 -12
1
3 C
Mean SD
Fig. 2 – Means Values and standard deviation (SD) ofδ13C for C3plants, C4grasses, phytoplankton (phyto), periphyton (peri) and POC (Particulate Organic Carbon) sampled in the area of influence of Corumbá Reservoir (source: Benedito-Cecilio et al. 2004).
basin, where mean values were –33.3 and –26.2◦/ ◦◦,
re-spectively (Araújo-Lima et al. 1986).
Spatial variations were not identified in the com-position of δ13C for adultL. friderici (Table I). Large
variance was detected for isotopic values of carbon in lotic environments. Spatial differences in isotopic ra-tio for adults Colossoma macropomum and Prochilo-dus nigricanswere verified by Benedito-Cecilio et al.
(2000) in Central Amazon, where the authors observed depletion ofδ13C from downstream to upstream. Sim-ilarly, Thomas and Cahoon (1993) demonstrated signif-icant differences in the ratio ofδ13C and 15N for fish in coral reefs. ForL. friderici, although significant
spa-tial differences inδ13N were not been identified (F2,12=
3.18; p>0.05), values were greater downstream from the dam (Table I). In spite of differences were not sig-nificant, the species may be adopting specific trophic strategy for each environment. This is confirmed if we consider that fish sampled downstream consumed more (Luz-Agostinho et al. 2006), denoting the use of protein originated from superior trophic levels.
Variations in the isotopic composition ofL. frid-ericican also be due to the spatial variability in the
iso-topic ratio of the same food item. The spatial analysis,
relative to the distance of to the dam, of the isotopic variations of δ13C for primary producers is presented by Benedito-Cecilio et al. (2004) (Figure 3). Although the studied area was relatively short (100 km), spatial correlations were detected for phytoplankton (r = 0.97;
p<0.05) and POC (r = 0.65; p<0.05). In the system Solimões-Amazonas (between Tefé and Santarém), spa-tial differences were also verified inδ13C of C4
macro-phytes (Benedito-Cecilio et al. 2000). Gradients of car-bon stable isotopes can exist in ecosystems and this may have influenced the isotopic ratios of plants. The up-stream stretches, not impacted by the reservoir, are 1.5 to 2 times more saturated in CO2 and present higher
values ofδ13C than downstream (Lajtha and Marshall 1994). POC, which is composed by organic carbon orig-inated from parts of plants and animals, can represent that reduction in the downstream values ofδ13C.
The inverse tendency verified for phytoplankton seems to be associated to diel variations in13CO
2
(tem--20 0 20 40 60 80 100 120
Distance (Km)
-32 -28 -24 -20
1
3
C
Fig. 3 – Spatial variation ofδ13C in leaves of the riparian vegetation, C4 plants, zooplankton, periphyton, POC in the area of influence of Corumbá Reservoir: 0=dam; distance>0= upstream; distance<0=downstream (source: Benedito-Cecilio et al. 2004).
perature, salinity, seasonality) and to geographical and temporal variations. All these have potential to induce alterations in plant metabolism.
In Corumbá Reservoir, the maximum and minimum contribution of C4 plants, for adults ofLeporinus frid-erici, calculated integrating the variation of plants and
fish were 47.7% and 2.4%, respectively. This is an ex-pressive contribution of carbon from C4 plants, if com-pared to the fish assemblages studied in Central Amazon. In that ecosystem, only four species presented maximum contribution of C4 plants superior to 38%. The largest
proportion of C3carbon in adult fish could be, however,
due to the preferential consumption of C3 plants
(Fors-berg et al. 1993).
The low digestibility and the diminished nutritional value of C4plants for herbivores were demonstrated by
Caswell et al. (1973). On the other hand, algal protein is highly nutritive and easily assimilated by most animals (Waslien 1979). Among C3plants, periphyton presented
closer isotopic values to those observed for fishes, corre-sponding to an important carbon source toL. friderici.
The intra specific variability in trophic position for
the species, calculated from the obtained values ofδ15N (Vander Zanden et al. 1997) and diet data (Luz-Agosti-nho et al. 2006), are presented in Table II. The proportion of ingested plant item is larger in rivers upstream from the reservoir (42.7%), which justifies the smaller trophic level among there. However, in the reservoir, the inges-tion of fish was 81.4%, while ingested plants contributed with 18.6%. Downstream from the dam, participation of plant item was even smaller (14.4%).
TABLE II
Trophic position (TP) based on diet compo-sition andδ15N forL. friderici(a = trophic position based on prey occupying the 2nd trophic level, b = trophic position based on prey occupying the 3rdtrophic level).
TP diet
Environment TPδ15N a b
River 2.0 2.8 3.4
Reservoir 2.2 2.8 3.6
Trophic position indicates how many times the bio-mass consumed by an organism have been metabolized along the food chain (Vander Zanden et al. 1997). In this case, the omnivorous behavior of the species, a charac-teristic of tropical ecosystems complexity, makes diffi-cult the understanding of energy flow and mass transfer in aquatic ecosystems. The trophic position variability of the species can be attributed to the following factors or even to the combination of both: i) high flexibility in feeding species, already justified by Andrian et al. (1994) for the Paraná River floodplain, and ii) variation in the trophic position of preys. In this last case, the difficulty to identify prey is due to a characteristic of the species that removes pieces of fishes when feeding. This impedes the determination of the prey trophic level (Luz-Agostinho et al. 2006). For an appropriate correction of this variation, experimentations to quantify the degree of trophic flexi-bility and to determine preferential prey are fundamental. Although the trophic position calculated with diet data was proportional to the one calculated with 15N values, the former elevated the trophic level of L. fridericiin
the food web, because estimated trophic positions were based on fish items belonging to the 2nd(a) and to the 3rd
(b) trophic levels (Table II).
Determination of trophic position based on diet, compared to the use ofδ15N, involves distinctions in the way as these methods integrate variations in trophic posi-tions (Vander Zanden et al. 1997). Theδ15N presents, in a more robust way, the integration in longer time, through the food web, the energy assimilated by lower trophic levels. However, a better estimate of the results obtained withδ15N is only possible based on diet composition.
Results obtained with the use of isotopes made pos-sible a better understanding of the role ofL. fridericiin
the flow of energy in the food web of the area of Corumbá Reservoir influence. The primary sources of carbon for the species, after the first year reservoir filling, were con-stituted by periphyton and C4grasses. Although studies
have not been conducted in the river phase, such sources might not have been the same during the two phases (be-fore and after the formation of the reservoir), once the diet of the species presented similar item, but in different relative importance in the reservoir phase. On the other hand, trophic position of the species, in the adult phase, based on diet data andδ15N, ranks it above the second
trophic level. However, the pattern of carbon flow and trophic dynamics in juveniles of this species may be dis-tinct to those presented in this work.
ACKNOWLEDGMENTS
We are grateful to M.F.A and L.C. Gomes for valuable comments, to Núcleo de Pesquisas em Limnologia, Icti-ologia e Aquicultura (NUPELIA) and FURNAS Centrais Elétricas S.A. for infrastructural support and Conselho Nacional de Desenvolvimento Científico e Tecnológico (CNPq), for the scientific iniciation scholarship to ALP.
RESUMO
Isótopos estáveis de carbono (δ13C) e nitrogênio (δ15N) foram
utilizados para descrever as fontes de energia e a posição tró-fica de adultos deLeporinus fridericina área do reservatório
de Corumbá, Brasil. As amostras foram coletadas entre abril de 1999 e março de 2000. Variações espaciais não foram iden-tificadas quanto à composição isotópica da espécie. As con-tribuições máximas e mínimas das plantas C4, foram de 47,7% e 2,4%, respectivamente. Entre as plantas C3, o perífiton cor-respondeu a uma das mais importantes fontes de carbono para a espécie, pois seus valores isotópicos foram os mais próxi-mos àqueles observados para os peixes. A proporção ingerida do item vegetal foi maior em rios localizados a montante do reservatório (42,7%), justificando a menor posição trófica re-gistrada para a espécie entre os ambientes estudados, enquanto no reservatório esta proporção foi de 18,6%, sendo que o item peixes atingiu 81,4%. A jusante do reservatório, a partici-pação das plantas foi ainda menor, atingindo 14,4%. Embora a posição trófica da espécie, calculada com os dados de di-eta, fossem proporcionais àqueles calculados com os valores deδ15N, os primeiros elevaram o nível trófico deL. friderici
na cadeia alimentar, pois estas foram baseadas nos itens peixe, cujas espécies pertenciam ao segundo e ao terceiro nível trófico.
Palavras-chave: isótopos estáveis, reservatório, Leporinus
friderici, teia alimentar.
REFERENCES
the fish fauna and fisheries. In: COWXIG (Ed), Reha-bilitation of freshwater fisheries, Oxford: Fishing News Books, p. 171–184.
AGOSTINHO AA, MIRANDA LE, BINI LM, GOMES LC, THOMAZSMANDSUZUKIHI. 1999. Patterns of Colo-nization in Neotropical reservoirs, and Prognoses on Aging. In: TUNDISIJGANDSTRASKRABA M (Eds), Theoretical Reservoir Ecology and its Applications, In-ternational Institute of Ecology, São Carlos, SP, Brazil, p. 227–265.
ANDRIAN IF, DÓRIA CRC, TORRENTEG ANDFERRETI CM. 1994. Espectro alimentar e similaridade na com-posição da dieta de quatro espécies deLeporinus
(Chara-ciformes, Anostomidae) do rio Paraná (22◦10-22◦50′/ 53◦40′W), Brasil. Unimar 16: 97–106.
ANGRADITR. 1994. Trophic linkages in the lower Colorado River: multiple stable isotope evidence. J N Am Benthol Soc 13: 479–495.
ARAÚJO-LIMACARM, FORSBERGBR, VICTORIARAND MARTINELLILA. 1986. Energy sources for detritivorous fishes in the Amazon. Science 234: 1256–1258. BENEDITO-CECILIO E, AGOSTINHO AA, JÚLIO JR HF
ANDPAVANELLICS. 1997. Colonização ictiofaunística do reservatório de Itaipu e áreas adjacentes. Rev Bras Zool 14: 1–14.
BENEDITO-CECILIOE, ARAÚJO-LIMACARM, FORSBERG BR, BITTENCOURTMMANDMARTINELLILC. 2000. Carbon sources of Amazonian fisheries. Fish Manag Ecol 7: 305–315.
BENEDITO-CECILIO E, PEREIRA AL AND SAKURAGUI CM. 2004. Effect of size on the energy acquired in species of the fish from a neotropical reservoir, Brazil. Environ Biol Fishes 7: 313–320.
BENEDITO-CECILIOE, PEREIRA AL, BALERONI HAND FARIAACEA. 2005. Effects of habitat on physiological indicators inLeporinus friderici(Pisces, Anostomidae) in the influence area of the Corumbá Reservoir, Goiás, Brazil. Acta Limnol Bras 17: 71–79.
CASWELL H, REED F, STEPHENSON SN AND WERNWE PA. 1973. Photosynthetic pathways and selective her-bivory: a hypothesis. Am Nat 107: 465–480.
rumbá. Ecol Monogr Acta Limnol Bras 14: 43–52. FORSBERGBR, ARAÚJO-LIMACARM, MARTINELLILA,
VICTORIARLANDBONASSIJA. 1993. Autotrophic car-bon sources for fish of the Central Amazon. Ecology 74: 643–652.
FRANCERL. 1997. Stable carbon and nitrogen isotopic ev-idence for ecotonal coupling between boreal forests and fishes. Ecol Freshw Fish 6: 78–83.
FRYB. 1988. Food web structure on Georges Bank from stable C, N and S isotopic compositions. Limnol Oceanogr 33: 1182–1190.
FRYBANDSHERREB. 1984. δ13C measurements as
indi-cators of carbon flow in marine and freshwater ecosys-tems. Contrib Mar Scien 27: 13–47.
HAHNNS, FUGIRANDANDRIANIF. 2004. Trophic ecol-ogy of fish assemblages. In: THOMAZSM, AGOSTINHO AAANDHAHNNS (Eds), The upper Paraná River and its floodplain: physical aspects, ecology and conservation. Leiden: Backhuys Publishers, p. 381–393.
HAMILTONSKANDLEWISWM. 1992. Stable carbon and nitrogen isotopes in algae and detritus from the Orinoco River floodplain, Venezuela. Geochim Cosmochim Acta 56: 4237–4246.
HOBSON KA ANDWASSENAARLI. 1999. Stable isotope ecology: an introduction. Oecologia 120: 312–313. JACKSONDANDHARKNESSDD. 1987. The use and
inter-pretation ofδ13C values as a means of stablishing dietary
composition. Oikos 48: 258–264.
JENNINGS S, REÑONES O, MORALES-NIN B, POLUNIN NVC, MORANTAJANDCOLLJ. 1997. Spatial variation in the15N and13C stable isotope composition of plants, invertebrates and fishes on Mediterranean reefs: implica-tions for the study of trophic pathways. Mar Ecol Prog Ser 146: 109–116.
KEOUGHJR, SIERSZENMEANDHAGLEYCA. 1996. Anal-ysis of a lake superior coastal food web with stable isotope techniques. Limnol Oceanogr 41: 136–146.
LOPESCA, BENEDITO-CECILIOEANDAGOSTINHOAA. 2000. The reproductive strategy of Leporinus friderici
(Characiformes, Ansotomidae) in the Paraná River basin: the effect of reservoirs. Rev Brasil Biol 60: 255–266. LUZ-AGOSTINHOKDG, BINI LM, FUGI R, AGOSTINHO
AAANDJÚLIOJRHF. 2006. Food spectrum and trophic structure of the ichthyofauna of Corumbá reservoir, Paraná river Basin, Brazil. Neotr Ichth 4: 61–68. MARTINELLILA, DEVOLAH, VICTORIARLANDRICHEY
JE. 1991. Stable carbon isotope variation in C3and C4 plants along the Amazon River. Nature 353: 57–59. MCARTHURJVANDMOORHEADKK. 1996.
Chraracteriza-tion of riparian species and stream detritus using multiple stable isotopes. Oecology 107: 232–238.
MCCLELLANDJWANDVALIELAI. 1998. Changes in food web structure under the influence of increase anthropo-genic nitrogen inputs to estuaries. Mar Ecol Prog Ser 168: 259–271.
PETERSONBJANDFRYB. 1987. Stable isotopes in ecosys-tem studies. Ann Rev Ecol Syst 18: 293–320.
THOMASCJANDCAHOONLB. 1993. Stable isotope analy-ses differentiate between different trophic pathways sup-porting rocky-reef fishes. Mar Ecol Prog Ser 95: 19–24. VANDER ZANDEN MJ AND RASMUSSEN JB. 1996. A
trophic position model of pelagic food webs: impact on contaminant biomagnification in lake trout. Ecol Monogr 66: 451–477.
VANDERZANDENMJ, CABANAGANDRASMUSSENJB. 1997. Comparing trophic position of calculated using sta-ble nitrogen isotope ratios (δ15N) and literature dietary
data. Can J Fish Aquat Sci 54: 1142–1158.
VAZZOLERAEAM, AGOSTINHOAAANDHAHNNS. 1997 A planície de inundação do alto rio Paraná: aspectos físi-cos, biológicos e socioeconômicos. Maringá, PR, Brasil, EDUEM, 460 p.
VELHOLFM, LANSAC-TÔHAFA, BONECKERCC, BINI LMANDROSSA DC. 2001. The longitudinal distribu-tion of copepods in Corumbá Reservoir, State of Goiás, Brazil. Hydrobiologia 453/454: 385–391.
VICTORIA RL, MARTINELLI LA, TRIVELIN PCO, MAT -SUIE, FORSBERGBR, RICHEY JEANDDEVOLAH. 1992. The use of the stable isotopes in studies of nutrient cycling: carbon isotope composition of Amazon Varzea sediments. Biotropica 24: 240–249.
WASLIENCI. 1979. Unusual sources of proteins for man. Crit Rev Food Sci Nutr 6: 77–151.