Genetic diversity of Morato’s Digger Toad,
Proceratophrys moratoi
: spatial
structure, gene flow, effective size and the need for differential management
strategies of populations
Mauricio P. Arruda
1,2, William P. Costa
1and Shirlei M. Recco-Pimentel
1 1Departamento de Biologia Estrutural e Funcional, Instituto de Biologia, Universidade Estadual de
Campinas (UNICAMP), Campinas, SP, Brazil
2
Laboratório de Biologia, Instituto Federal de Educação, Ciência e Tecnologia do Amazonas (IFAM),
Tabatinga, AM, Brazil.
Abstract
The Morato’s Digger Toad,Proceratophrys moratoi, is a critically endangered toad species with a marked population decline in southern Brazilian Cerrado. Despite this, new populations are being discovered, primarily in the northern part of the distribution range, which raises a number of questions with regard to the conservation status of the spe-cies. The present study analyzed the genetic diversity of the species based on microsatellite markers. Our findings permitted the identification of two distinct management units. We found profound genetic structuring between the southern populations, on the left margin of the Tietê River, and all other populations. A marked reduction was ob-served in the contemporary gene flow among the central populations that are most affected by anthropogenic im-pacts, such as extensive sugar cane plantations, which presumably decreases habitat connectivity. The results indicated reduced diversity in the southern populations which, combined with a smaller effective population size, may make these populations more susceptible to extinction. We recommend the reclassification ofP. moratoi as vulnera-ble and the establishment of a special protection program for the southern populations. Our results provide important insights about the local extinction of southern populations of this toad.
Keywords:Proceratophrys moratoi, microsatellite, population structure, management unit, conservation. Received: February 9, 2016; Accepted: January 8, 2017.
Introduction
The understanding of genetic diversity, population structure, gene flow, and the dispersal capacity of endan-gered species are fundamental to conservation genetics (Beebee, 2005). Studies of this kind are especially impor-tant for elucidating population decline, the definition of conservation status, and the development of management strategies (Beebee, 2005; Funket al., 2012).
The Morato’s Digger Toad,Proceratophrys moratoi
(Jim and Caramaschi, 1980), is a small digging toad which is found generally in “campo sujo” habitats (savanna with some shrubs) of the Cerrado biome, often in the proximity of streams (Jim and Caramaschi, 1980). The Cerrado is a biodiversity “hotspot” which has suffered high rates of hab-itat loss, with only 21% of the original vegetation remain-ing intact (Conservation International, 2011) most of which now are small, isolated fragments (Mittermeier et al.,
2005).
Due to its restricted geographic distribution and the evidence of decline and extinction in the southern popula-tions, the species is listed by the IUCN as critically endan-gered (Cruz and Caramaschi, 2004). However, recent stud-ies have recorded a number of new occurrence localitstud-ies, especially in the northern part of its original distribution, which have led to considerable debate on its conservation status (e.g.Brasileiroet al., 2008; Carvalho Jret al., 2010; Rolimet al., 2010; Martins and Giaretta, 2012).
The susceptibility ofP. moratoito anthropogenic
im-pacts is uncertain. The population of Botucatu, the type lo-cality of the species, has been considered to be extinct since 1998, since when no more individuals have been found, de-spite numerous field studies at this locality and surrounding areas during the rainy season (Rolim, 2009). One possible cause of this disappearance is habitat destruction related to farming and urban development, with remaining popula-tions being restricted to protected areas (Brasileiroet al.,
2008), such as Brotas, which is located on the right margin of the Tietê river. However, one of the known populations, São Carlos, is located in an area of intense agricultural ac-tivity, indicating that the species may be able to tolerate a
DOI: http://dx.doi.org/10.1590/1678-4685-gmb-2016-0025
certain level of human impact or even colonize modified habitats (Carvalho Jret al., 2010). In fact, little is known
about the natural history ofP. moratoior its long-term
ca-pacity for survival in degraded habitats.
Based on the analysis of morphological, cytogenetic, and morphometric characteristics, Costa (2012) detected reduced levels of inter-population divergence, although it was possible to identify patterns of variation in coloration and some morphometric traits, such as body size, which permitted the differentiation of populations. However, For-tiet al.(2016) observed low variation in the traits of calls
and a high level of haplotype sharing among populations (in the 16S mitochondrial gene).
To complement these findings, we analyzed the ge-netic characteristics of P. moratoi populations, using microsatellite markers, in order to i) estimate the genetic di-versity, inbreeding levels, and effective size of populations; ii) characterize the spatial genetic structure and gene flow between populations; and iii) integrate the results into man-agement recommendations for the conservation of this spe-cies.
Materials and Methods
Study area and ethics statement
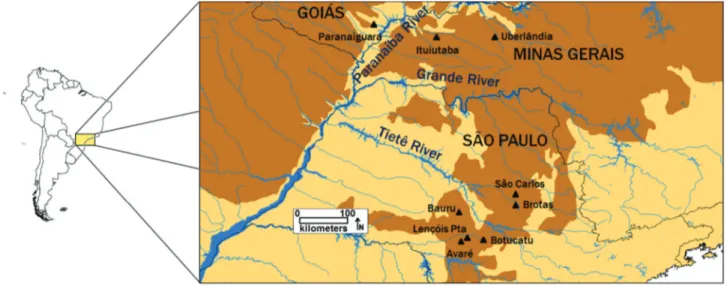
All the areas in whichP. moratoipopulations were
re-corded prior to 2013 were surveyed (Figure 1). Fieldwork was conducted from October to March (rainy season) in the years between 2010 and 2013. Samples were collected in the field using two methods to capture toads: acoustic and visual survey at breeding sites, as proposed by Scott Jr and Woodward (1994), and pitfall traps with drift fence (Cechin and Martins, 2000).
The sampling was non-destructive with no impact on endangered populations ofP. moratoi. Saliva samples were collected from all individuals used in the study. During the
course of the study, samples of salivary mucous were ob-tained from between one and 41 adult individuals from each site (Table 1). The salivary mucous samples were col-lected using the protocol described by Pidancier et al.
(2003), with modification, where following capture, each animal’s oral cavity was opened gently by depressing the lower part of the mandible with a thumb. A commer-cially-available sterile cotton swab was then introduced into the oral cavity and wiped gently around the internal surface of the cavity using circular movements for approxi-mately 2 min, until the saliva sample was obtained. The swab was then stored in a micro-tube containing 1 mL of lysis buffer (10 mM tris-HCl pH 8.0, 1 mM EDTA pH 8.0, 100 mM NaCl, 2% SDS) and kept on ice until storage in a freezer at -20 °C. After saliva collection, all captured indi-viduals were released back into the wild without being marked in any way.
Amphibians were captured within a maximum radius of 500 meters from the coordinates of each site (see Table 1). The reduced sample size for some populations was due to the scarcity of calling adults at local sites, despite re-peated visits by collectors during the rainy season. Given this, and considering the unique situation of the species, with numerous declining and extinct populations, it was deemed necessary to conduct the analysis, in spite of the small size of some samples. To avoid a possible recapture bias in the population analyses, whenever identical geno-types were identified in the combined analysis of all loci in CERVUS 3.0.3 (Marshallet al., 1998), only one of the
indi-viduals was included in the population analyses.
Extraction of genomic DNA
A modified protocol based on Pidancieret al.(2003) was used to obtain samples from salivary mucous. This is a non-destructive method for the extraction of genomic DNA. The extracted DNA was diluted in a solution of
Tris-EDTA (10 mM Tris-HCl pH 8.0, 1 mM EDTA pH 8.0). Concentration and purity of the DNA were estimated using a NanoDropäND-1000 spectrophotometer.
The first population of the species was identified in the district of Rubião Júnior (municipality of Botucatu, SP) and according to Rolim (2009), this population is now ex-tinct. Individuals had been collected from this population in 1976, fixed in formalin, and deposited in the amphibian collection at UNESP in Botucatu. For the analysis of this population, samples of muscle tissue were extracted from 13 specimens, and the DNA was extracted using the modi-fication procedure described by Boomet al.(1990), with modifications. Initially, the tissue was diluted in a pH 8.0 buffer (Tris-HCl 10 mM) for 20 min, and after maceration, it was transferred to 500mL of pH 6.4 lysis buffer (gua-nidine thiocyanate 4M, Tris-HCl 10 mM, EDTA 20 mM and Triton X-100 0.65%). The solution was then incubated overnight at 60 °C, followed by the addition of 500mL of chloroform. After inversion, the suspension was centri-fuged for 3 min at 3,824 rcf. Approximately 450mL of the supernatant was transferred to a new microtube, to which 1 mL of lysis buffer and 40mL of silica particles were added for 10 min, and the suspension was then centrifuged for 3 min at 3,824 rcf. The supernatant (1 mL) was discarded, 1 mL of washing buffer (guanidine thiocyanate 4 M, Tris-HCl 10 mM pH 6.4) was added and centrifuged for 3 min at 3,824 rcf. The supernatant was again discarded (1 mL) and the solution was topped off with freezing absolute ethanol. The micro-tube was inverted repeatedly, centri-fuged at 17,949 rcf for 15 min, and after the ethanol was discarded, the pellet was dried and the DNA was diluted in 110 mL of TE buffer (10 mM Tris-HCl pH 8.0; 1 mM EDTA) and stored at -20 °C.
Genotyping of the populations and evaluation of the
microsatellite markers
The 22 microsatellite loci developed by Arrudaet al.
(2012) were used to genotype theP. moratoipopulations.
PCR assays prepared and amplifications were done follow-ing the recommendations of these authors. Successfully amplified PCR products were analyzed in a Dual Dedicated Height vertical electrophoresis sequencing system (CBS Scientific) using a denaturing 6% polyacrylamide gel and stained with silver nitrate (Cresteet al., 2001). Allele size was estimated in GELANALYZER 2010A (Lazar and La-zar, 2010).
Only the markers that presented a clear profile (with-out unspecific or stutter bands) and had been amplified in at least one individual from each population (except for Botu-catu, given the loss of genotypes due to the degradation of the samples by the formalin – see Results) were used for the population-level analyses presented here. The markers were evaluated in MICRO-CHECKER 2.2.3 (van Oosterhoutet al., 2004) for the identification of genotyping
errors and evidence of null alleles, using the Brookfield (1996) method with 1,000 randomizations and Bonferroni correction (Rice, 1989). Given the assumptions of this method, this analysis included only the populations with samples of at least 20 individuals. The potential effect of null alleles on genetic differentiation was estimated in FreeNA (Chapuis and Estoup, 2007) with 100 replicates us-ing the excludus-ing null alleles “ENA” method to adjust the genotypes. Potential genotype linkage disequilibrium was evaluated in GENEPOP 4.1.0 (Rousset, 2008), with 10,000 dememorization steps and 100 batches of 5,000 interac-tions per batches.
Table 1- Basic characteristics of theP. moratoistudy populations, grouped by geographic region (see Figure 1) and levels of intrapopulation genetic di-versity.
Region Population-state Latitude Longitude n1 P Na Ne AR Ho He pHWE FIS
North 1-Paranaiguara-GO2 -18.76° -50.61° 3 59% 2.47 2.27 1.48 0.45 0.48 0.994 0.080
2-Ituiutaba-MG -19.01° -49.45° 4 88% 2.35 1.85 1.45 0.35 0.45 0.378 0.242
3-Uberlândia-MG -19.00° -48.32° 12 82% 3.65 2.36 1.39 0.33 0.39 0.449 0.148
Central 4-São Carlos-SP -22.02° -47.94° 40 88% 4.24 2.47 1.42 0.40 0.42 0.142 0.043
5-Brotas-SP -22.21° -47.91° 41 88% 4.53 2.65 1.41 0.37 0.41 0.007 0.102
South 6-Bauru-SP -22.35° -49.02° 24 65% 3.41 2.21 1.38 0.38 0.38 0.481 -0.008
7-Avaré-SP -22.89° -48.95° 3 53% 1.76 1.50 1.28 0.26 0.28 0.602 0.100
8-Lençóis Paulista-SP -22.82° -48.88° 1 24% 1.24 1.24 1.23 0.24 0.24 -
-9-Botucatu-SP -22.89° -48.51° 13 70% 2.10 1.81 - 0.19 0.39 0.028 0.573
MD3 1414 80% 3.77 2.36 1.40 0.36 0.40 0.211 0.117
1n= sample size (individuals); P = percentage of polymorphic loci; N
a= mean number of alleles per locus; Ne= number of effective alleles; AR = allelic richness; Ho= observed heterozygosity; He= expected heterozygosity; pHWE = probability of deviations from Hardy-Weinberg Equilibrium (p values lower than 0.003, with the Bonferroni correction, are considered to be significant);FIS= coefficient of endogamy;
2GO = Goiás; MG = Minas Gerais; SP = São Paulo;
Population analysis
Intra-population variability was quantified according to the observed (Ho) and expected heterozygosity (He), the
percentage of polymorphic loci (P), number of alleles (Na),
and the effective number of alleles (Ne) (Hartl and Clark,
1989), all of which were estimated in POPGENE 1.32 (Yeh
et al., 1997). The intra-population inbreeding coefficient (Fis) was calculated in FSTAT 2.9.3.2 (Goudet, 1997), as were allelic richness (AR) (except for the Botucatu popula-tion, for which not all the loci were amplified), corrected by the minimum sample size of one individual, and the diver-gent values of allelic richness among groups of samples were examined using permutation test with 15,000 permu-tations. The populations were also examined for possible deviations from Hardy-Weinberg equilibrium using GENEPOP with 10,000 dememorization steps and 100 batches of 5,000 interactions per batches with Bonferroni correction.
Inferences on population structure may be affected by deviations from neutrality, such as outlier markers that are suffering selection pressure, resulting in certain biases in the analyses. The LOSITAN (Antaoet al., 2008)
applica-tion was used to identify such loci, with runs of 200,000 simulations using an initial run to identify a set of neutral markers, based on two mutation models, the stepwise muta-tion model and the infinite alleles model. Neutral markers,
i.e., non-outliers, were included in all the subsequent
analy-ses.
Levels of differentiation in the population were eval-uated in ARLEQUIN 3.5.1.2 (Excoffier and Schneider, 2006), based on theFstatistic, with theFSTandRSTindices.
The latter was adjusted to the stepwise mutation model of evolution for microsatellite markers (Slatkin, 1995), using 10,000 permutations. The permutation test, run in SPAGeDI 1.4c (Hardy and Vekemans, 2002), was used to verify the contribution of gradual mutations to the genetic structuring. The number of private alleles was calculated in CONVERT 1.3 (Glaubitz, 2004). The number of geneti-cally distinct samples clusters (k) was determined by a
Bayesian approach using STRUCTURE 2.3.4 (Pritchardet al., 2000), with five runs conducted with 1,000,000
repli-cates and a burn-in of 200,000, using the admixture model and the frequency of correlated alleles, without prior popu-lation information, with between one and 10 clusters (k)
and the most probable value being selected by the Evanno method in STRUCTURE HARVESTER 0.6.93 (Earl and von Holdt, 2012). The STRUCTURE software also permit-ted to calculate the proportional contribution of each indi-vidual to the clusters (Q – membership coefficient).
Spatial discontinuities in gene flow were evaluated by Bayesian clustering with a Hidden Gaussian Random Field (HGRF), run in TESS 2.3.1 (Chenet al., 2007), using the
mixed conditional auto-regressive model (CAR). Ten inde-pendent runs were conducted for each Kmax cluster
(be-tween two and 10 clusters) inferred from the analysis, with
200,000 sweeps, burn-in of 40,000, and the spatial interaction parameter (y) fixed at 0.6, as recommended by the authors. To identify the number of sample clusters pres-ent in the data, we plotted the deviance information crite-rion (DIC) produced for the comparison with Kmax and
selected the value ofKmaxwhen the DIC stabilized (Durand
et al., 2009) or when the Q matrix of posterior probabilities stabilized (no additional clusters apparent). The CLUMMP 1.12b program (Jakobsson and Rosenberg, 2007) was used to correct possible discrepancies between runs, by analyz-ing the Q values of the replicates produced by the STRUCTURE and TESS programs. Isolation by distance was used to identify barriers to dispersal of landscape by examining the relationship between the genetic differentia-tion (RST index) and geographic (Euclidean) distance
among the sample points, with 10,000 randomizations run in IBD 1.52 (Bohonak, 2002). The protocol of Funket al.
(2012) was used to delineate possible management units. Estimates of contemporary gene flow were obtained in BAYESASS+ 3.0.3 (Wilson and Rannala, 2003). Five independent runs with random seed values were conducted with 10,000,000 iterations and a burn-in of 1,000,000. These demographic analyses based on Bayesian inference tend to fall short when sample size is small. In this case, the analyses were conducted carefully by closely observing the stable probability values defined during the course of the analyses by two different methods (see below). Delta val-ues for the migration rates (mc), allele frequencies (A), and
endogamy (f) were adjusted (mc= 0.15; A = 0.70;f= 0.70)
to ensure that around 20–60% of the total changes would be accepted, as recommended by Wilson and Rannala (2003). Convergence was also measured by examining the log-probability in the TRACER 1.5 program (Rambaut and Drummond, 2007) to ensure the proper mixing of parame-ters. In this program, the formation of a plateau with regular oscillations (i.e. no persistent hills and valleys) indicates
good mixing and effective sampling from the posterior dis-tribution.
Mean long-term rates of migration (M) were esti-mated in MIGRATE-n 3.6 (Beerli and Felsenstein, 2001), which was approximately 4Ne in the past (Beerli, 2004).
This rate was estimated by M =mh/m, wheremhis the
mi-gration rate andmthe mutation rate. This program was also used to estimate effective population size (Q= 4Nem). A
mutation rate of 1.27 x 10⁻³per generation was considered
for the calculation ofmhand Ne, based on the estimates of
Bulutet al.(2009) for microsatellites in amphibians. The
estimates were based on the Brownian motion mutation model using a constant mutation rate and Bayesian infer-ence with five independent replicates, 3,000 recorded steps, 20 sampling increments, and a burn-in of 400 per chain, as proposed by the Slice distribution, and the prior distribution ofQ(0 100 10) and M (0 1000 100). Contemporary migra-tion (mc) was compared with historical levels (mh) using the
2002), running 10,000 permutations for the evaluation of all the routes analyzed together, and the routes for the northern, central, and southern portions of the geographic range of the species analyzed separately. The tendency for migration over time was evaluated bymc-mh, where values
close to zero indicate equivalent levels of historical and contemporary migration.
The BOTTLENECK 1.2.0.02 program (Cornuet and Luikart, 1996) was used to identify evidence of recent bot-tlenecks. Initially, a one-tailed signed rank Wilcoxon test was used to verify an excess of heterozygosity (He > Heq) in comparison with that expected in a mutation-drift equi-librium, which is sensitive enough to detect bottlenecks oc-curring at approximately 2–4 Ne generations (Piryet al.,
1999), using the mutational model most appropriate for the data, and the two-phase model (TPM) complemented with 70–90% of the stepwise mutation model (SMM). This range encompasses the most probable interval for amphib-ian microsatellites (Schlötterer, 2000), and varamphib-iance was set at 12, as recommended by Piryet al.(1999). A second test
based on the assumption that populations which have passed through bottlenecks are characterized by a reduced proportion of rare alleles (< 10%) due to the loss of these less common alleles, resulting in a “shifted mode distribu-tion”. This test is sensitive enough to detect bottlenecks oc-curring during the preceding 12 generations (Cornuet and Luikart, 1996), which would coincide with the period of most intense anthropogenic impacts. To guarantee the highest possible statistical power, the tests were conducted only on populations represented by samples of more than 10 individuals, with 10,000 replications.
Results
Analysis of the molecular markers
The combined analysis in CERVUS identified identi-cal genotypes (i.e.recapture) in only two populations. The highest recapture rate was recorded in Bauru, with three in-dividuals being recaptured (of the total of 27), with 24 sam-ples being used for the analyses. In contrast, only a single pair of identical genotypes was detected in the São Carlos population, with only 40 of the 41 samples being analyzed.
A total of 22 polymorphic loci were evaluated, al-though one locus,Pmoratoim5 could not be amplified from the samples obtained from the southern populations, two loci (Pmoratoim21 andPmoratoim24) presented an excess of unspecific bands, and a further two (Pmoratoim23 and
Pmoratoim25) had stutter bands, which hampered the inter-pretation of the genotypes in some populations. In order to avoid biases in the estimates of genetic diversity and popu-lation structure, these loci were excluded from the popula-tion analyses.
The 17 remaining loci were also amplified in the sam-ples from the Botucatu population. When analyzed in MICRO-CHECKER, no evidence of large allele dropout
was found in any of the loci, whereas null alleles were iden-tified in two loci in the Brotas population (Pmoratoim27 /r
= 0.078;Pmoratoim29 /r= 0.095) and one in the population
from São Carlos (Pmoratoim29 /r= 0.179). Evidence of
stuttering was found in one locus from Bauru (Pmoratoim13 /r= 0.103). Overall, significant evidence of genotyping errors was found in only four (7.84%) of the 51 tests (3 populations x 17 loci). The globalFSTvalues were
calculated in the FreeNA application, with the unadjusted value (0.196) being highly similar to the adjusted value (0.194). This led us to maintain these loci in the population analyses, given that small differences support the assump-tion that the estimates of genetic diversity and populaassump-tion differentiation would not be affected significantly by this degree of genotyping error. No significant linkage disequi-librium was detected between the pairs of loci, based on the analysis in GENEPOP (p > 0.0005, after Bonferroni correc-tion). Given these findings, all 17 independent loci were in-cluded in the population analyses.
Using a modified version of the extraction method described by Boomet al.(1990), it was possible to recover 15% of the genotypes from the Botucatu samples, that is, it was possible to amplify 34 genotypes from the 221 avail-able (17 loci tested in 13 individuals). At least one individ-ual was amplified in 10 of the loci, and seven of the 13 genotypes were recovered for the loci Pmoratoim16 and
Pmoratoim29. In contrast, forPmoratoim06,Pmoratoim07,
Pmoratoim08, Pmoratoim12, Pmoratoim15, and
Pmoratoim16, all the genotypes were empty. Nevertheless, the population was included in the subsequent analyses.
Within-population genetic diversity
Estimates of genetic diversity within populations of
P. moratoiobtained from the analysis of 17 independent
loci are presented in Table 1. None of the populations pre-sented a significant deviation from Hardy-Weinberg equi-librium, with the Bonferroni correction.
In the parameters least sensitive to sample size (i.e.,
AR and He), the highest levels of genetic diversity were
Analysis of inter-population diversity
The LOSITAN analysis based on the infinite alleles model identified balancing selection in locusPmoratoim15 (p = 0.002). Based on the stepwise mutation model, LOSITAN identified the markerPmoratoim6 (p = 0.978) as the most likely to have been affected by positive,i.e., direc-tional selection. The permutation test run in SPAGeDI de-tected a significant contribution (m> m, p = 0.000) of the stepwise mutations to population structuring, indicating that theRSTprovided the best fit for the data. Based on this
result, the most adequate LOSITAN output was that which determined that the locusPmoratoim6 is possibly under se-lection, and for this reason it was excluded from all subse-quent analyses.
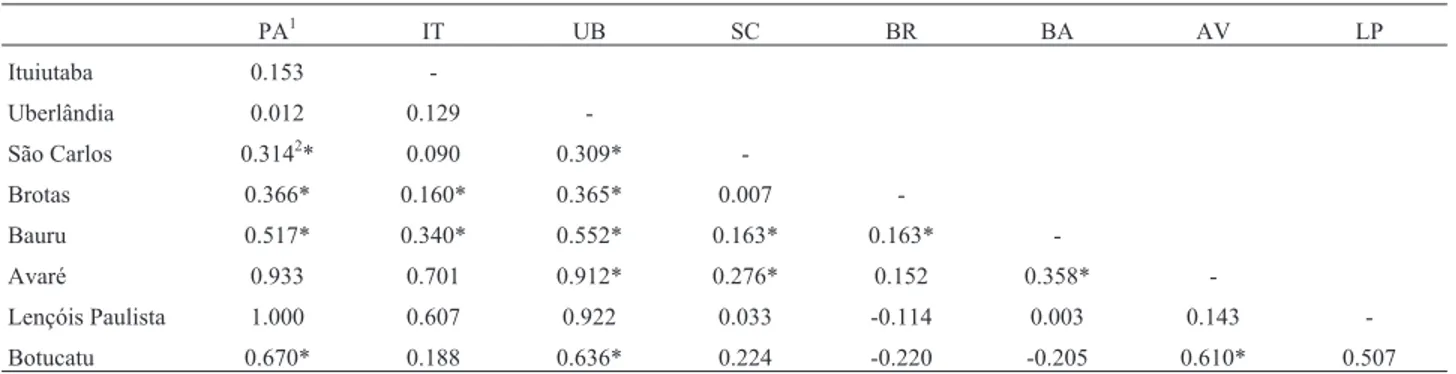
In the pairwise comparisons using theRST index of
population differentiation (Table 2) at significance levela = 0.05, the most significant level of divergence was found between the southern and northern populations, such as Avaré and Uberlândia (RST= 0.912 / p = 0.00), Botucatu
and Paranaiguara (RST= 0.670 / p = 0.01), and Botucatu and
Uberlândia (RST = 0.636 / p = 0.00). While many of the
comparisons with the population from Lençóis Paulista had highRSTvalues (e.g.,RST= 1.00 between Lençóis Paulista
and Paranaiguara), the results were not significant (p = 0.99) due to reduced sample size.
Overall, 44 of the 122 distinct alleles produced by the neutral markers were exclusive to one of the populations. The southern populations were characterized by reduced numbers of private alleles, with four being recorded in Bauru, two in Avaré and Botucatu, and one in Lençóis Paulista. In the northern portion, by contrast, nine private alleles were recorded in Brotas, eight in Uberlândia, and seven in Paranaiguara and São Carlos.
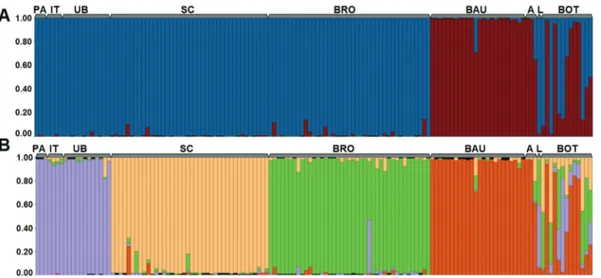
The STRUCTURE analysis identified two clusters representing the highest hierarchical level in the genetic structure of theP. moratoipopulations (DK = 1083, Figure 2A). A more subtle subdivision assumed four clusters (DK = 534, Figure 2B). The CLUMMP analysis indicated that
the convergence of the runs for bothkvalues was extremely
high (H’ = 0.999 fork= 2 and H’ = 0.999 fork= 4).
The principal structure of the data (k= 2) indicates a profound degree of structuring between the central (São Carlos and Brotas) + northern populations (Paranaiguara, Ituiutaba and Uberlândia) and the Bauru population, to the south, located on the left margin of the Tietê River (down-stream flow). The other southern populations (Avaré, Len-çóis Paulista, and Botucatu) presented a mixed distribution overlapping the two clusters (Q < 0.7). While the Botucatu population is characterized by an excess of empty geno-types, with few or no data being available for most individ-uals, it presented the same pattern of mixture with the geographically closest populations, that is, Avaré and Len-çóis Paulista, which indicates an adequate amount of infor-mative data. At k = 4, less profound structuring was detected, with the populations from Minas Gerais and Goiás forming a single cluster, three others clusters on the populations from São Carlos, Brotas, and Bauru, and the southern populations (Avaré, Lençóis Paulista, and Botu-catu) once again presenting a mixed pattern, with a slight tendency to group with the Bauru population (see Figure 2B).
Based on the initial STRUCTURE analyses, barriers to gene flow were added to the data input to represent the location of the Tietê River, which apparently represents the major barrier to the dispersal ofP. moratoipopulations. In
this analysis, the plateau of the DIC values for the 10 inde-pendent runs was reached whenKmax= 4, wherek= 2 andk
= 4 (Figure 3A, B) identified similar clusters to those de-tected by STRUCTURE. Following the correction by CLUMPP of the independent runs, the populations pre-sented a high membership coefficient (Q > 0.7) fork= 2 (H’
= 0.957), the exception being the individuals from the Botucatu population. Atk= 4 (H’ = 0.754), high Q values
were observed in all the individuals from the Paranaiguara, Ituiutaba, and Uberlândia populations, all from the same cluster, Bauru and Avaré (also from the same cluster), and the population from Brotas. Mid-range Q values (0.5–0.7)
Table 2- Indices of inter-population variation (RST) for pairwise comparisons of theP. moratoistudy populations.
PA1 IT UB SC BR BA AV LP
Ituiutaba 0.153
-Uberlândia 0.012 0.129
-São Carlos 0.3142* 0.090 0.309*
-Brotas 0.366* 0.160* 0.365* 0.007
-Bauru 0.517* 0.340* 0.552* 0.163* 0.163*
-Avaré 0.933 0.701 0.912* 0.276* 0.152 0.358*
-Lençóis Paulista 1.000 0.607 0.922 0.033 -0.114 0.003 0.143
-Botucatu 0.670* 0.188 0.636* 0.224 -0.220 -0.205 0.610* 0.507
1PA = Paranaiguara-GO; IT = Ituiutaba-MG; UB = Uberlândia-MG; SC = São Carlos-SP; BR = Brotas-SP; BA = Bauru-SP; AV = Avaré-SP; LP =
were obtained for the São Carlos and Lençóis Paulista, and also for the Botucatu population, but in individuals repre-senting distinct clusters. This analysis revealed an almost perfect differentiation between the population groups lo-cated on the left (southern) margin of the Tietê and the right (northern) margin of this river (Figure 3A, B). Exceptions were the Botucatu (at bothk= 2 andk= 4) and Lençóis Paulista (k= 4) populations which had individuals that were assigned to different clusters.
The analysis of isolation by distance, based on the pairwise comparison of all the populations detected a sig-nificant tendency (r= 0.638; p < 0.002). However, when
only the populations in the vicinity of the Tietê River
(within a radius of 80 km) are included in the analysis, that is, excluding the populations from Minas Gerais and Goiás, the isolation by distance was not significant (r= -0.222;p =
0.804).
Demographic analyses
The delta values of the BAYESASS runs were within the range expected for a pattern of convergence. Plots pro-duced by TRACER indicated that the chain was well mixed (results not shown), confirming that the convergence of runs has been reached and that the estimates of gene flow were probably reliable. In general, contemporary migration rates (Supplementary Material Table S1) are low (mc <
Figure 2- Population structure. Q plots were generated by the STRUCTURE program. These are based on a multilocus analysis of the nineP. moratoi
populations. Each vertical line represents an individual, and the percentage of the different colored segments in each line is proportional to the adhesion of the individual to each of thekgroups. (A) principal genetic structuring (k= 2), (B) weaker structuring (k= 4). PA = Paranaiguara; IT = Ituiutaba; UB = Uberlândia; SC = São Carlos; BRO = Brotas; BAU = Bauru; A = Avaré; L = Lençóis Paulista; BOT = Botucatu.
0.10), except for three significant one-way routes between Uberlândia and Ituiutaba (15% of migrants between popu-lations 119 km apart), Uberlândia and Paranaiguara (10% of migrants, distance of 243 km), and Bauru and Avaré (12% of migrants, distance of 59 km). The highest rates of self-recruitment were found in the central populations, São Carlos and Brotas.
As for historic migration using the 95% confidence intervals (CI), the most significant routes (> 1%) were be-tween Brotas and Bauru (0.017; CI:.0.000 – 0.037), Brotas and Uberlândia (0.016; CI: 0.000 – 0.035) and Brotas and São Carlos (0.016; CI: 0.000 – 0.036), and between São Carlos and Brotas (0.015; CI: 0.000 – 0.035). The largest population-scaled mutation rate was recorded for the north-ern population from Ituiutaba (Q= 1.14; CI: 0.00 – 2.80), and the smallest, in the southern population from Avaré (Q = 0.49; CI: 0.00 – 0.97). Based on the formulaQ= 4Nem,
the Ne for each population was 205 (CI: 0 – 525) for
Paranaiguara, 224 (CI: 0 – 551) for Ituiutaba, 108 (CI: 0 – 433) for Uberlândia, 211 (CI: 0 – 524) for São Carlos, 216 (CI: 0 – 537) for Brotas, 118 (CI: 0 – 420) for Bauru, 96 (CI: 0 – 420) for Avaré, 211 (CI: 0 – 485) for Lençóis Paulista, and 146 (CI: 0 – 472) for Botucatu.
No significant divergence was detected between the
mcandmhvalues for the populations and routes analyzed as
a whole (r = -0.01, p = 0.64), although there was a marked tendency for positive values (i.e.,mc> mh) except for the
Brotas to São Carlos, São Carlos to Brotas, and Brotas to Bauru routes (mh>mc). Similarly, no significant difference
was found between contemporary and historic migration patterns in the northern (r = -0.28, p = 0.40, with a positive tendency) and southern populations (r = 0.25, p = 0.23, also with a positive tendency), although migration rates were significantly higher in the past in the central populations (r = 0.98, p = 0.03, with a negative tendency).
No evidence of recent decline was detected in any of the populations using either the one-tailed Wilcoxon test or the shifted mode, with the exception of the now extinct pop-ulation from Botucatu. Significant results were obtained for both tests, using the TPM model with 70% and 90% SMM (Wilcoxon p = 0.05 and shifted mode = 11% of the rare al-leles), and no significant bottleneck one-tailed Wilcoxon: p = 0.15) was detected in the case of the SMM model.
Discussion
The populations located in the southern portion of the geographic distribution ofP. moratoi, that is, on the left
margin of the Tietê River, presented lower levels of genetic diversity in comparison with the other populations. While most of these southern populations are represented by small samples, which may explain part of this difference, it is im-portant to note that the Bauru population, represented by more than 20 individuals, was characterized by low levels of diversity, which is typical of the region. In addition,
de-spite the small size of the samples from the northern locali-ties of Paranaiguara (n = 3) and Ituiutaba (n = 4), the fact that these populations presented high levels of diversity contradicted possible sampling effects.
It is interesting to note that some southern popula-tions (e.g.Avaré and Lençóis Paulista, pers. obs.) show
signs of drastic decline, while others (i.e., Botucatu) have
become extinct. This suggests that the reduced indices of diversity recorded in this region may be related to small populations sizes, a characteristic also observed in the esti-mates of historic population size. Inferences on immigra-tion rates obtained in MIGRATE are generally not influ-enced by sample size, although the confidence interval tends to be larger in samples with fewer individuals (10 in-dividuals per population – Beerli, 2004). However, the high Nevalue recorded in a single southern population (Lençóis
Paulista) may have been related to the small sample size (only one individual), which probably affected the reliabil-ity of the estimates provided by MIGRATE. Smaller popu-lations tend to be more susceptible to extinction resulting from stochastic processes, which may explain the extinc-tions observed in the southern sector. Differences in inter-population diversity have also been recorded in the Euro-pean tree-frog,Hyla arborea, which is not considered
en-dangered in southeastern Europe, whereas the populations in the western portion of the distribution appear to be more vulnerable, with marked population decline and low levels of genetic diversity (Arenset al., 2006; Dubeyet al., 2009).
In addition to its low genetic diversity, the Botucatu population also presented high levels of endogamy. Evi-dence of a recent bottleneck was also found in this popula-tion. Jim and Caramaschi (1980) analyzed specimens from this population and found only a limited amount of varia-tion in traits such as body size and coloravaria-tion. This was the onlyin vivostudy of this population, however, and there is
no unequivocal evidence of anomalies that might represent the effects of inbreeding depression, which may have con-tributed to the disappearance of this population by reducing the adaptive potential of the individuals. Nonetheless, the low level of genetic diversity found in the present study and the evidence for endogamy indicate that the population would probably not have been viable over the long term. In addition, as the population was located within an urban per-imeter, it seems likely that it was effectively isolated from the others, leading to high rates of inbreeding. In fact, the area occupied by the species in Botucatu has been impacted by a series of anthropogenic processes, including the drain-age of wetlands, introduction of exotic species and grazing animals, urbanization, and pollution (Rolim, 2009), all of which presumably contributed to the decline inP. moratoi
popu-lation was similar to that found in other southern popula-tions (and was assigned to the same clusters), which does support the reliability of the few genotypes analyzed.
Despite the genetic divergence observed between the southern populations and those from the northern and cen-tral sectors of the species’ distribution, the fact that the markerPmoratoim5 was not amplified in the southern pop-ulations reinforces the differences encountered in the other analyses (e.g.,RST, STRUCTURE, TESS). The Tietê River
effectively separates the clusters (see TESS data), and its role in the structuring of the populations is reinforced by the non-significant isolation by distance found among the pop-ulations located in the vicinity of this river. An analysis of the morphological characteristics of theP. moratoi
popula-tions found little divergence, except for subtle differences in the coloration of the specimens (Costa, 2012). The speci-mens from Bauru are dark gray with black spots, and have a velvety sheen which distinguishes them from all other pop-ulations. Morphometrically, three groups were identified: Botucatu, Brotas + São Carlos, and Bauru + Avaré + Len-çóis Paulista. This is similar to thek= 2 results obtained
from the STRUCTURE and TESS programs, excluding the populations from Minas and Goiás, which were not in-cluded in the study. As for the differences in phenotypic traits, see Costa (2012), the employment of the hyper-variable microsatellite markers detected considerable vari-ation among populvari-ations, in contrast with Fortiet al.(2016)
who used a more conservative marker (the 16S gene). The differentiation of the Botucatu population seen in this analysis was based on the much lower mean dimen-sions. Jim (2002) noted that the Botucatu region represents and “island” of colder climate related to its latitude and high altitude (> 800 m), where temperatures can reach be-low 0 °C (Engea, 1990). This feature of the region may have contributed to the unique morphometric characteris-tics of the localP. moratoipopulation (Costa, 2012).
The spatial location of the main barriers to gene flow, as identified by our analysis, closely matches the current course of one of the main rivers in the region. The genetic evidence indicates that the Tietê River constitutes a major barrier to the dispersal of these toads and may also have played an important zoogeographic role in the past, either as a river or associated geological features. In another spe-cies of the same genus,P. boiei, a phylogenetic analysis
based on the molecular analysis of mitochondrial and nu-clear sequences also detected a major genetic division be-tween populations on opposite banks of the Tietê River (Amaroet al., 2012). In a study of the herpetofauna of the
Brazilian Amazon, Moraeset al.(2016) found that rivers
are important barriers to dispersal, in particular for amphib-ians.
Two other major rivers also separateP. moratoi
pop-ulations. One is the Grande River, which separates the Minas Gerais population from all others, and the Paranaíba River, which separates the Paranaiguara population in
Goiás (see Figure 1). All these rivers are part of the Paraná basin (Souzaet al., 2005), and were formed during the
up-per Pleistocene (Stevaux and Santos, 1998). However, the two rivers in the northern sector of the species’ range ap-pear to have played a less prominent role in the structuring of theP. moratoipopulations, suggesting these rivers might
be either a relatively recent or a semi-permeable barrier. The subtle subdivision (k= 4) found among nearby
populations was expected given the philopatry of amphibi-ans to their breeding sites and reduced vagility (Beebee, 2005). Together, these limit gene flow and may result in fine scale structuring, that is, even over distances of less than 10 km (Shafferet al., 2000; Lampert et al., 2003).
However, some species do have considerable dispersal ca-pacity (Pyke and White, 2001; Funket al., 2005), even in
areas with high levels of anthropogenic impact (Arrudaet al., 2011). In this case, susceptibility to fragmentation is
highly species-specific and will depend on the vagility of the species, the permeability of the matrix, and historic population size and structure, all of which impede reliable generalizations (Wiens, 1997; Galbusera et al., 2004;
Cushman, 2006; Luoyet al., 2007).
The reduced effective population sizes and diversity of the southern populations suggest that they are peripheral, based on the analyses and predictions of Lawton (1993), Vucetich and Waite (2003), and Garneret al.(2003). The
demographic characteristics of peripheral populations are more likely to suffer impacts, especially from climatic ex-tremes (Lesica and Allendorf, 1995).
The central populations (São Carlos and Brotas) pre-sented the highest rates of self-recruitment and signifi-cantly lower contemporary gene flow in comparison with historic migrations (mh>mc/ r = 0.98, p = 0.03, with a
nega-tive tendency), despite the reduced distance between them (22 km) and the absence of riverine barriers. The opposite pattern was found between other populations (mh<mc). In
the specific case of São Carlos, anthropogenic impact is the highest of any of the populations analyzed, and is character-ized by a mosaic of sugarcane plantations (22% soil cover-age) and areas of regenerated forest interspersed with small remnant islands of native vegetation (Rudorffet al., 2004;
Carvalho Jret al., 2010). Even in the southern areas, for
ex-ample, soil coverage by sugarcane plantations is no more than 10% (Rudorffet al., 2004). In fact, the Brazilian state
of São Paulo, where the central sector is located, has the lowest level of protection of the Cerrado biome, with only 13% of the original vegetation remaining (Sano et al.,
2007). Agricultural fragmentation may increase random drift (Johanssonet al., 2007), affecting both neutral genetic
variability and adaptive traits. However, few amphibian studies have focused on the role of anthropogenic pro-cesses, such as urbanization and agriculture, which gener-ally (see exceptions Youngquist and Boone, 2014; Rodrí-guezet al., 2015) reduce vagility, genetic diversity (e.g.,
2007), survival rates and geographic distribution (Raxworthy and Nussbaum, 2000; Vallan, 2002), with an overall increase in landscape resistance (Goldberg and Waits, 2010).
Our study indicates thatP. moratoiis vulnerable to
anthropogenic processes, given that the removal of the na-tive vegetation for the implantation of plantations in the central sector has contributed to the reduction in the dis-persal of these toads (mh>mc). On the other hand, it is also
possible to infer that, as the central and northern popula-tions are larger, they are less vulnerable to extinction result-ing from short-term stochastic processes, in contrast with the Botucatu population, which is now extinct. Levels of genetic diversity appear to persist due to the relatively re-cent process of population fragmentation, although with ongoing isolation and resulting increase in genetic drift over the long term, a loss of genetic diversity and increase in endogamy will be expected, especially in the central pop-ulations.
Implications for conservation
Based on the extension of the geographic distribution ofP. moratoi(> 70,000 km2), and our findings on effective
population size (approximately 1,500 individuals) and the number of adult individuals (< 250) in each population, we recommend the reclassification of the conservation status of the species according to the relevant IUCN (2016) ria. Rather than Critically Endangered (CR), based on crite-rion B1ab (iii, v), we recommend the reclassification ofP. moratoias Vulnerable (VU), in accordance with criteria
A2a and C2a (i). In this case, while less preoccupying, the species is still considered to be under some threat of extinc-tion, given the evidence of decline in the southern popula-tions and the reduced numbers of individuals.
The anuran fauna of the Cerrado is still very poorly known (Diniz-Filhoet al., 2004), and it seems likely that
additional surveys will reveal the presence of additional populations, especially in the northern portion of the range ofP. moratoi, where relatively high levels of genetic
diver-sity were found.
Notwithstanding, the unique genetic characteristics of the southern populations and their reduced levels of ge-netic diversity associated with small numbers, endogamy, and population decline, all reinforce the need for high prior-ity conservation measures in this region. In addition to in-creasing the probability of extinction through stochastic processes, reduced genetic diversity in amphibians has been associated with reduced fitness and neutral diversity (Andersenet al., 2004; Lesbarrèreset al., 2005), which fur-ther reinforces our preoccupation with the soufur-thern P. moratoipopulations.
The sum of the evidence presented here indicates the need for three principal conservation measures: (i) the defi-nition of two management units, one consisting of the southern populations, on the left margin of the Tietê River
in São Paulo, and the other of all the other populations. This primary division was reinforced by STRUCTURE (k= 2),
which re-emphasizes the need for the separate management of these two units (Moritz and Faith, 1998); (ii) due to the levels of population decline and extinction found in the southern populations, we recommend that conservation management policies focus on the protection of habitats, especially through the creation of reserves (state and fed-eral) and the promotion of connectivity, supported by de-mographic and genetic monitoring; and (iii) the collection of data on the fitness of these populations, based on molec-ular markers and phenotypic traits.
As the present analyses do not provide estimates of the divergence times of the different management units, we would recommend the application of a more systematic phylogeographic approach based on additional molecular markers (nuclear and mitochondrial) for a more reliable definition of the patterns and the timing of the diversifica-tion of the different lineages. We would also recommend the establishment ofex situpopulations with individuals
from the southern localities (as per the suggestion of Woodworthet al., 2002), based on appropriate
manage-ment measures (i.e., maintenance of levels of genetic
diver-sity, prevention of endogamy, and minimization of adapta-tions to captivity) with the aim of preserving these unique genetic stocks. The southern populations may be at the limit of viability due to the marked effects of drift, the reduced capacity to respond to selective pressures, and the low probability of any increase in genetic variability due to a rescue effect from other populations.
Acknowledgments
We thank the Fundação de Amparo à Pesquisa do Estado de São Paulo (FAPESP) for financial support (FAPESP Grants 2010/06915-2 and 2010/08291-6). We are especially grateful to the Brazilian Federal Environ-ment Institute (IBAMA) for authorizing the transportation of biological samples (salivary mucous cells) through spe-cial license 25538-1. We would also like to thank the São Paulo Forestry Institute (Process SMA no. 012.611/2010), Luiz Carlos de Almeida Neto (director of the Bauru Botani-cal Garden), and Duratex S.A. for authorizing fieldwork.
References
Amaro RC, Rodrigues MT, Yonenaga-Yassuda Y and Carnaval AC (2012) Demographic processes in the montane Atlantic rainforest: Molecular and cytogenetic evidence from the en-demic frog Proceratophrys boiei. Mol Phylogenet Evol 62:880-888.
Andersen LW, Fog K and Damgaard C (2004) Habitat fragmenta-tion causes bottlenecks and inbreeding in the European tree frog (Hyla arborea). Proc R Soc Lond B Biol Sci
Antao T, Lopes A, Lopes RJ, Beja-Pereira A and Luikart G (2008) LOSITAN: A workbench to detect molecular adaptation based on aFST-outlier method. BMC Bioinformatics 9:323. Arens P, Bugter R, van’t Westende W, Zollinger R, Stronks J, Vos CC and Smulders MJM (2006) Microsatellite variation and population structure of a recovering Tree frog (Hyla arborea
L.) metapopulation. Conserv Genet 7:825-835.
Arens P, van der Sluis T, van’t Westende WPC, Vosman B, Vos CC and Smulders MJM (2007) Genetic population differen-tiation and connectivity among fragmented Moor frog (Rana arvalis) populations in The Netherlands. Landscape Ecol 22:1489-1500.
Arruda MP, Morielle-Versute E, Silva A, Schneider MPC and Gonçalves EC (2011) Contemporary gene flow and weak genetic structuring in Rococo toad (Rhinella schneideri) populations in habitats fragmented by agricultural activities. Amphibia-Reptilia 32:399-411.
Arruda MP, Costa WP, Silva CC and Recco-Pimentel SM (2012) Development of 22 polymorphic microsatellite loci for the critically endangered Morato’s digger toad,Proceratophrys moratoi. Int J Mol Sci 13:12259-12267.
Beebee TJC (2005) Conservation genetics of amphibians. Hered-ity 95:423-427.
Beerli P and Felsenstein J (2001) Maximum likelihood estimation of a migration matrix and effective population sizes in n subpopulations by using a coalescent approach. Proc Natl Acad Sci U S A 98:4563-4568.
Beerli P (2004) Effect of unsampled populations on the estimation of population sizes and migration rates between sampled populations. Mol Ecol 13:827-836.
Bohonak AJ (2002) IBD (isolation by distance): A program for analyses of isolation by distance. J Hered 93:154-155. Bonnet E and Van de Peer Y (2002) Zt: A software tool for simple
and partial Mantel tests. J Comput Graph Stat 7:1-12. Boom R, Sol CJ, Salimans MM, Jansen CL, Wertheim-van Dillen
PME and van de Noorda J (1990) Rapid and simple method for purification of nucleic acids. J Clin Microbiol 28:495-503.
Brasileiro CA, Martins IA and Jim J (2008) Amphibia, Anura, Cycloramphidae,Odontophrynus moratoi: Distribution ex-tension and advertisement call. Check List 4:382-385. Brookfield JFY (1996) A simple new method for estimating null
allele frequency from heterozygote deficiency. Mol Ecol 5:453-455.
Bulut Z, McCormick CR, Gopurenko D, Williams RN, Bos DH and DeWoody (2009) Microsatellite mutation rates in the eastern tiger salamanderAmbystoma tigrinum tigrinum)
dif-fer 10-fold across loci. Genetica 136:501-504.
Carvalho Jr RR, Kleinsorge JMD and Fusinatto LA (2010)
Odontophrynus moratoiJim and Caramaschi, 1980: Filling gaps. Discovery of a new population in the state of São Paulo, southeastern Brazil. Check List 7:36-37.
Cechin S and Martins M (2000) Eficiência de armadilhas de queda (pitfall traps) em amostragens de anfíbios e répteis no Brasil. Rev Bras Zool 17:729-740.
Chapuis MP and Estoup A (2007) Microsatellite null alleles and estimation of population differentiation. Mol Biol Evol 24:621-631.
Chen C, Durand E, Forbes F and François O (2007) Bayesian clus-tering algorithms ascertaining spatial population structure:
A new computer program and a comparison study. Mol Ecol Notes 7:747-756.
Costa WP (2012) Variação Populacional de Proceratophrys moratoi(Jim e Caramaschi, 1980) (Amphibia: Anura) no Estado de São Paulo. M.Sc. Thesis, Instituto de Biociências, Universidade Estadual Paulista, Botucatu, 62 pp.
Cornuet JM and Luikart G (1996) Description and power analysis of two tests for detecting recent population bottlenecks from allele frequency data. Genetics 144:2001-2014.
Creste S, Tulmann Neto A and Figueira A (2001) Detection of simple sequence repeat polymorphism in denaturing polyacrylamide sequencing gels by silver staining. Plant Mol Biol Rep 19:299-306.
Cushman SA (2006) Effects of habitat loss and fragmentation on amphibians: A review and prospectus. Biol Conserv 128:231-240.
Diniz-Filho JAF, Bini LM, Vieira CM, De Souza MC, Bastos RP and Brandão D (2004) Spatial patterns in species richness and priority areas for conservation of anurans in the Cerrado region, Central Brazil. Amphibia-Reptilia 25:63-75. Dubey S, Ursenbacher S, Pellet J and Fumagalli L (2009) Genetic
differentiation in two European tree frog (Hyla arborea)
metapopulations in contrasted landscapes of Western Swit-zerland. Amphibia-Reptilia 30:127-133.
Durand E, Jay F and Gaggioti OE (2009) Spatial inference of ad-mixture proportions and secondary contact zones. Mol Biol Evol 26:1963-1973.
Earl DA and von Holdt BM (2012) STRUCTURE HARVESTER: A website and program for visualizing STRUCTURE output and implementing the Evanno method. Conserv Genet Res 4:359-361.
Engea (1990) Avaliações, Estudos do Patrimônio e Engenharia LTDA. Levantamento e Análise dos Quadros Ambientais e Proposições Físico Territoriais de Zoneamento Ambiental para APA Corumbataí - Botucatu - Tejupá, Perímetro Botu-catu. SMA, SP/CPLA, São Paulo, vol. 2.
Excoffier IG and Schneider S (2006) ARLEQUIN 3.1: An inte-grated software package for population genetics data analy-sis. Evol Bioinform Online 1:47-50.
Forti LR, Costa WP, Martins LB, Nunes-de-Almeida CHL and Toledo LF (2016) Advertisement call and genetic structure conservatism: Good news for an endangered Neotropical frog. PeerJ 4:e2014.
Funk WC, Greene AE, Corn PS and Allendorf FW (2005) High dispersal in a frog species suggests that it is vulnerable to habitat fragmentation. Biol Lett 1:13-16.
Funk WC, McKay JK, Hohenlohe PA and Allendorf FW (2012) Harnessing genomics for delineating conservation units. Trends Ecol Evol 27:489-496.
Galbusera P, Githiru M, Lens L and Matthysen E (2004) Genetic equilibrium despite habitat fragmentation in an Afrotropical bird. Mol Ecol 13:1409-1421.
Garner TWJ, Angelone S and Pearman PB (2003) Genetic deple-tion in Swiss populadeple-tions ofRana latastei: Conservation im-plications. Biol Conserv 114:371-376.
Glaubitz JC (2004) CONVERT: A user-friendly program to refor-mat diploid genotypic data for commonly used population genetic software packages. Mol Ecol Notes 4:309-310. Goldberg CS and Waits LP (2010) Comparative landscape
Goudet J (1997) FSTAT: A Program to Estimate and Test Gene Diversities and Fixation Indices. 2.8. Université de Lausan-ne, Switzerland.
Hardy OJ and Vekemans X (2002) SPAGeDi: A versatile com-puter program to analyse spatial genetic structure at the indi-vidual or population levels. Mol Ecol Notes 2:618-620. Hartl DL and Clark AG (1989) Principles of Population Genetics.
2nd ed. Sinauer Associates, Sunderland, 565 p.
IUCN (2016) Guidelines for Using the IUCN Red List Categories and Criteria. Version 12. Prepared by the Standards and Pe-titions Subcommittee, 101 p.
Jakobsson M and Rosenberg NA (2007) CLUMPP: A cluster matching and permutation program for dealing with label switching and multimodality in analysis of population struc-ture. Bioinformatics 23:1801-1806.
Jim J (2002) Distribuição Altitudinal e Estudo de Longa Duração de Anfíbios da Região de Botucatu, Estado de São Paulo. Tese de Livre-Docência, Instituto de Biociências de Botu-catu, Universidade Estadual Paulista, BotuBotu-catu, 343 p. Jim J and Caramaschi U (1980) Uma nova espécie de
Odontophrynus da região de Botucatu, São Paulo, Brasil
(Amphibia, Anura). Rev Bras Biol 40:357-360.
Johansson M, Primmer CR, Sahlsten J and Merilä J (2005) The in-fluence of landscape structure on occurrence, abundance and genetic diversity of the common frog,Rana temporaria. Glob Change Biol 11:1664-1679.
Johansson M, Primmer CR and Merilä J (2007) Does habitat frag-mentation reduce fitness and adaptability? A casa study of the common frog (Rana temporaria). Mol Ecol
16:2693-2700.
Lampert KP, Rand AS, Mueller UG and Ryan MJ (2003) Fine-scale genetic pattern and evidence for sex-biased dispersal in the túngara frog, Physalaemus pustulosus. Mol Ecol 12:3325-3334.
Lawton JH (1993) Range, population abundance and conserva-tion. Trends Ecol Evol 8:409-413.
Lesbarrères D, Primmer SR, Laurila A and Merilä J (2005) Envi-ronmental and population dependency of genetic variabil-ity-fitness correlations in Rana temporaria. Mol Ecol
14:311-323.
Lesica P and Allendorf FW (1995) When are peripheral-popu-lations valuable for conservation. Conserv Biol 9:753-760. Luoy D, Habel JC, Schmitt T, Assmann T, Meyer M and Müller P
(2007) Strongly diverging population genetic patterns of three skipper species: The role of habitat fragmentation and dispersal ability. Conserv Genet 8:671-681.
Marshall TC, Slate J, Kruuk LEB and Pemberton JM (1998) Sta-tistical confidence for likelihood-based paternity inference in natural populations. Mol Ecol 7:639-655.
Martins LB and Giaretta AA (2012) Advertisement calls of two species ofProceratophrys(Anura: Odontophrynidae) from
Minas Gerais, Brazil, with comments on their distribution, taxonomy and conservation status. S Am J Herpetol 7:203-212.
Mittermeier RA, Gil PR, Hoffman M, Pilgrim J, Brooks T, Mitter-meier CG, Lamoreux J and da Fonseca GAB (2005) Hotspots Revisited: Earth’s Biologically Richest and Most Endangered Terrestrial Ecoregions. Conservation Interna-tional, Washington, DC, 392 p.
Moraes LJCL, Pavan D, Barros MC and Ribas CC (2016) Com-bined influence of riverine barriers and flooding gradient on
biogeographical patterns of amphibians and squamates in South-eastern Amazonia. J Biogeogr 43:2113-2124. Moritz C and Faith DP (1998) Comparative phylogeography and
the identification of genetically divergent areas for conser-vation. Mol Ecol 7:419-429.
Noël S, Ouellet M, Galois P and Lapointe FJ (2007) Impact of ur-ban fragmentation on the genetic structure of the eastern red-backed salamander. Conserv Genet 8:599-606. Pidancier N, Miguel C and Miaud C (2003) Buccal swabs as a
non-destructive tissue sampling method for DNA analysis in amphibians. Herpetol J 13:175-178.
Piry S, Luikart G and Cornuet JM (1999) BOTTLENECK: A computer program for detecting recent reductions in the ef-fective population size using allele frequency data. J Hered 90:502-503.
Pritchard JK, Stephens M and Donnelly P (2000). Inference of population structure using multilocus genotype data. Genet-ics 155:945-959.
Pyke GH and White AR (2001) A review of the biology of the green and golden bell frogLitoria aurea. Aust Zool
31:563-598.
Raxworthy CJ and Nussbaum RA (2000) Extinction and extinc-tion vulnerability of amphibians and reptiles in Madagascar. Amphib Reptile Conserv 2:15-23.
Rice WR (1989) Analyzing tables of statistical tests. Evolution 43:223-225.
Rodríguez A, Börner M, Pabijan M, Gehara M and Haddad CFB (2015) Genetic divergence in tropical anurans: Deeper phylogeographic structure in forest specialists and in topo-graphically complex regions. Evol Ecol 29:765-785. Rolim DC (2009) Bioecologia de Odontophrynus moratoi
(Amphibia, Anura, Cycloramphidae). M.Sc. Thesis, Insti-tuto de Biociências, Universidade Estadual Paulista, Botu-catu, 77 p.
Rolim DC, Martinez RAM, Almeida SC, Ubaid FK, Maffei F and Jim J (2010) Amphibia, Anura, Cycloramphidae,
Proceratophrys moratoi(Jim and Caramaschi, 1980): Dis-tribution extension and new altitudinal record in state of São Paulo, Brazil. Check List 6:576-578.
Rousset F (2008) GENEPOP’007: A complete re-implementation of the GENEPOP software for Windows and Linux. Mol Ecol Resour 8:103-106.
Rudorff BFT, Berka LMS, Xavier AC, Moreira MA, Duarte V and Rosa VGC (2004) Estimativa de Área Plantada com Cana-de-Açúcar em Municípios do Estado de São Paulo Por Meio de Imagens de Satélites e Técnicas de Geoproces-samento: Ano safra 2003/2004. Instituto Nacional de Pes-quisas Espaciais, São José dos Campos, 47 p.
Sano EE, Rosa R, Brito JLS and Ferreira LG (2007) Mapeamento de Cobertura do Bioma Cerrado: Estratégias e Resultados. Embrapa Cerrado, Planaltina, 33 p.
Schlötterer C (2000) Evolutionary dynamics of microsatellite DNA. Chromosoma 109:365-371.
Scott Jr NJ and Woodward BD (1994) Surveys at breeding sites. In: Heyer WR, Donnelly MA, McDiamind RW, Hayek LAC and Foster MS (eds) Measuring and Monitoring Biological Diversity: Standard Methods for Amphibians. Smithsonian Institution Press, Washington, DC, pp 118-124.
(Anura,Bufonidae) based on single-strand conformation polymorphism analysis (SSCP) and mitochondrial DNA se-quence data. Mol Ecol 9:245-257.
Slatkin M (1995) A measure of population subdivision based on microsatellite allele frequencies. Genetics 139:457-462. Souza CRG, Suguio, K, Oliveira MAS and Oliveira PE (2005)
Quaternário do Brasil. Editora Holos, Ribeirão Preto, 382 p. Stevaux JC and Santos ML (1998) Palaeohydrological changes in
the upper Parana river, Brazil, during the Late Quaternary: A facies approach. In: Benito G, Baker VR and Gregory KJ (eds) Palaeohydrology and Environmental Change. John Wiley and Sons, London, pp 273-285.
Vallan D (2002) Effects of anthropogenic environmental changes on amphibian diversity in the rainforest of eastern Madagas-car. J Tropical Ecol 18:725-742.
van Oosterhout C, Hutchinson WF, Wills DPM and Shipley P (2004) MICRO-CHECKER software for identifying and correcting genotyping errors in microsatellite data. Mol Ecol Notes 4:535-538.
Vucetich JA and Waite TA (2003) Spatial patterns of demography and genetic processes across the species’ range: Null hy-potheses for landscape conservation genetics. Conserv Genet 4:639-645.
Wiens JA (1997) Metapopulation dynamics and landscape ecol-ogy. In: Hanski IA and Gilpin ME (eds) Metapopulation Bi-ology: Ecology, Genetics, and Evolution. Academic Press, New York, pp 43-68.
Wilson G and Rannala B (2003) Bayesian inference of recent mi-gration rates using multilocus genotypes. Genetics 163:1177-1191.
Woodworth LM, Montgomery ME, Briscoe DA and Frankham R (2002) Rapid genetic deterioration in captive populations:
Causes and conservation implications. Conserv Genet 3:277-288.
Yeh FC, Yang R and Boylet T (1997) POPGENE Version 1.32: Software Microsoft Window-Based Freeware for Popula-tion Genetic Analysis. University of Alberta, Alberta. Youngquist MB and Boone MD (2014) Movement of amphibians
through agricultural landscapes: The role of habitat on edge permeability. Biol Conserv 175:148-155.
Internet Resources
Conservation International (2011) Biological diversity in the Cerrado. In: Cutler JC (ed) Encyclopedia of Earth. Washing-ton: Environmental Information Coalition, National Council
for Science and the Environment,
http://www.eoearth.org/view/article/150638/ (November 25, 2013).
Cruz CAG and Caramaschi U (2004)Proceratophrys moratoi. In:
IUCN 2013. IUCN Red List of Threatened Species. Version 2013.1, http://www.iucnredlist.org (August 27, 2013). Lazar I and Lazar I (2010) Gel Analyzer 2010a: Freeware 1D gel
electrophoresis image analysis software, http://www.gelanalyzer.com.
Rambaut A and Drummond AJ (2007) Tracer. Version 1.5., http://tree.bio.ed.ac.uk/software/tracer.
Supplementary Material
The following online material is available for this article: Table S1 – Estimates of recent and historic migration.
Associate Editor: Antonio Matteo Solé Cava