Evaluation of Leprosy Epidemiology in 12
Countries of the Americas, 198CH9831
C.
LOMBARDI*To assess the leprosy situation prevailing in 12 countries
of
Latin America and the Caribbean in 2980-1983, the authors reviewed data on eight indicators-four relat- ing specifically to leprosycases
andfour
to general health conditions. On the basisof scores derived from these indicators, the 12 countries were classified into three groups wherein the leprosy endemic appeared to be declining, stationary, or increas- ing. Countries
of
the first group, where the leprosy endemic appeared to be receding, exhibited generally favorable leprosy-specific indicators and general health indica-tors, and the findings generally agreed with those
of
prior leprosy prevalence sur- veys. Similarly, those in the third group, where the endemic seemed to be increasing, showed generally unfavorable leprosy-specific indicatorsand
general health indica- tors plusgeneral
agreement with prior leprosyprevalence
surveys. In contrast, the results obtained for the three countries where the leprosy endemic seemed “station- ary” differedsubstantially
porn one country to the next-but in all cases the “sta- tionary” situation appeared to depend less upon a stable equilibrium than upon interaction of opposing trends.T
he limited information available sug- gests leprosy was introduced into the American Continent by settlers and explorers arriving from areas of Europe where the disease was endemic and subsequently by people brought over as slaves from highly endemic areas of Africa.Once established in the Americas, the disease slowly found its own pattern of geographic distribution in response to various factors-including climate, other environmental conditions, and the de- mographic, socioeconomic, and cultural circumstances prevailing in different places.
Historical analysis of leprosy trends in Europe, especially Norway, and more re-
This article was also published in Spanish in the Bokttn de Zu Oficina Sanitaria Panamericana. Vol. 105. No. 1,1988, ;p. 20-34.
Trofessor, Department of Epidemiology, School of Public Health, University of Sgo Paulo, Brazil.
cently in Japan, has clearly delineated the connection between endemic levels and
socioeconomic development. Specifi-
cally, this analysis has shown that a pop- ulation’s general living conditions and health status strongly infhrence the inten- sity of transmission, the effectiveness of the health system, and the epidemiologic picture of the disease (I, 2).
Demographic factors such as intense and unregulated urban growth, and op- erational factors such as the extent of control program coverage and effective- ness (whether or not these programs are integrated into the primary health care system) are emerging as important vari- ables in leprosy epidemiology. Also, in recent years the resistance of M. leprae
to
traditional dapsone treatment regimens has introduced a new factor into the dis- ease’s epidemiologic profile, necessitat- ing widespread adoption of new treat-
ment regimens based on multidrug
chemotherapy.
For these reasons, among others, we
felt it would be useful to employ specific leprosy indicators in association with general indicators to evaluate leprosy epidemiology in the Americas.
IWWERIALS AND METHODS
Twelve countries of the Americas were selected as being representative of the hemisphere’s various geographic regions (exclusive of the United States and Ca- nada), the diverse populations of the continent, and registered leprosy cases. The 12 countries selected on the basis of these criteria were Argentina, Brazil, Co- lombia, Costa Rica, Cuba, the Dominican Republic, Ecuador, Guyana, Mexico, Pa- raguay, Trinidad and Tobago, and Vene- zuela. As of 1983 these countries ac-
counted for roughly 80% of the
population in those parts of the Americas outside the United States and Canada where leprosy was endemic, and for 92% of all officially registered leprosy cases in the Americas (3-7).
Leprosy prevalences per 100,000 inhab- itants that were found in these 12 coun- tries by four previous surveys are shown in Table 1.
Because of the known influence of gen- eral living standards and health levels on the distribution of leprosy, a method was sought for evaluating the epidemiologic situation in the 12 selected countries by examining certain specific leprosy indica- tors together with certain general health indicators (22-14). The specific indicators used were as follows:
1. Leprosy prevalence (registered cases per 100,000 inhabitants), a specific indicator useful for assessing the magnitude of the problem that is strongly influenced by past and pres- ent case registration procedures. 2. Leprosy incidence (cases detected an-
3.
4.
nually per 100,000 inhabitants), an epidemiologic indicator of obvious value in assessing the current risk of contracting leprosy and the inten- sity of prior transmission.
Leprosy incidence in children (cases de- tected annually in the 1-14 year age group per 100,000 children), an indi- cator used for evaluating the inten- sity of pediatric transmission.
Le,~rosy disability rate (the proportion of newly detected leprosy cases with disability in a given year), an opera- tional indicator for evaluating the ef- fectiveness of efforts to obtain early diagnoses.
We also used four general health indi- cators, these being life expectancy at birth, infant mortality, communicable disease deaths (the proportion of all deaths attributed to the causes listed in Section I of the International Classifica- tion of Diseases, ninth revision, a figure influenced by the population’s age struc- ture and the quality of death certificates), and infant DPT vaccination (the propor- tion of all infants receiving three DPT vaccinations, an indicator relating to health service productivity that assesses immunization program coverage).
We sought to obtain average values of all these indicators from the sources cited for the years 1980 through 1983 (3-6). When appropriate data could not be ob- tamed for this period, information from the last year with available data within this period was used, or an estimate for the 1980-1985 period was employed. Base data for the leprosy figures and the resulting indicators are shown in Tables 2 and 3.
Average values were then calculated for each of these eight indicators, and re- lative values of one, two, or three were assigned to each indicator as follows: lep- rosy prevalence and communicable dis-
Table 1. Apparent leprosy prevalences (cases per 100,000 inhabitants) in 12 countries of the Americas, according to works published in 1957, 1959,1977, and 1983.
Author of work, Cases per 100,000 inhabitants in:
year of publication, Costa Dominican Trinidad
and reference Argentina Brazil Colombia Rica Cuba Republic Ecuador Guyana Mexico Paraguay and Tobago Venezuela Bica et al., 1957 (8) 48.8 112.3 75.6 23.9 67.1 11.7 4.3 292.9 40.5 132.3 130.3 164.9
Souza Lima, 1959 (9) 5 1 202 72 47 72 9 4 280 42 143 140.0 164
Brubaker, 1977 (IO) 37.5 125.6 82.1 26.0 49.7 53.3 40.9 105.2 25.0 186.8 82.8 77.6
Motta and Borges,
1983 (I 1) 42.9 148.9 69.1 26.1 58.8 87.3 26.2 58.6 21.9 141.1 30.5 100.0
Table 2. Average values for population data and annual registered leprosy cases in the 12 selected countries as of 1980-I 983.”
Population and leprosy case data in:
Costa Dominican Trinidad
Argentina Brazil Colombia Rica Cuba Republic Ecuador Guyana Mexico Paraguay and Tobago Venezuela Total population (in
thousands) 28,930 125,708 26,973 2,304 9,766 5,666 8,799 892 72,132 3,320 1,075 14,519
Child population (O-14
years, in thousands) 7,340 50,754 10,898 882 3,604 2,698 3,987 358 33,081 1,419 353 6,122
Total no. of registered
leprosy cases 11,675 191,292 20,612 588 5,726 5,039 2,368 597 15,915 4,881 501 13,348
Leprosy cases detected in
one year (average) 1,027 16,806 897 46 337 356 92 91 586 293 28 353
Leprosy cases detected in children O-l 4 in one
year (average) 19 1,491 72 16 9 88 13 38 30 13 5 27
Leprosy cases with disability detected in
one year (average) 11 -b 214 6 -b 30 6 6 78 47 4 45
Sources: Pan American Health Organization (3-6).
“When data for the entire 1980-l 983 period were not available, the figures corresponding to the most recent year of the cited period were used; and if the latter were not available either, then existing estimates for the 1980-l 985 period were employed.
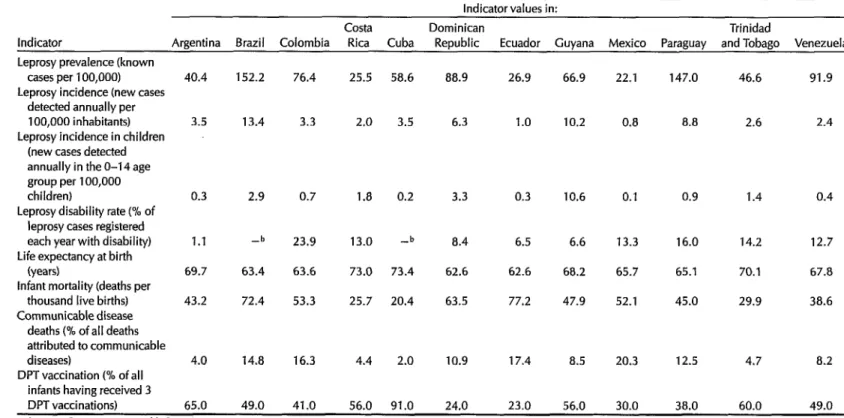
Table 3. Average annual values of four specific leprosy indicators and four general health indicators in the 12 selected countries as of 1980-l 983: Indicator values in:
Costa Dominican Trinidad
Indicator Argentina Brazil Colombia Rica Cuba Republic Ecuador Guyana Mexico Paraguay and Tobago Venezuela Leprosy prevalence (known
cases per 100,000) Leprosy incidence (new cases
detected annually per 100,000 inhabitants) Leprosy incidence in children
(new cases detected annually in the O-14 age group per 100,000 children)
Leprosy disability rate (% of leprosy cases registered each year with disability) Life expectancy at birth
(years)
Infant mortality (deaths per thousand live births) Communicable disease
deaths (% of all deaths attributed to communicable diseases)
DPT vaccination (% of all infants having received 3 DPT vaccinations)
40.4 152.2 76.4
3.5 13.4 3.3
0.3 2.9 0.7
1.1 -b
69.7
43.2
63.4
72.4
23.9
63.6
53.3
4.0 14.8
49.0
16.3 4.4 2.0 10.9 17.4 8.5 20.3 12.5 4.7 8.2
65.0 41.0 56.0 91.0 24.0 23.0 56.0 30.0 38.0 60.0 49.0 25.5 58.6 88.9 26.9
2.0 3.5 6.3 1.0
1.8 0.2
13.0 -b
73.0 73.4
25.7 20.4
3.3 0.3
8.4 6.5
62.6 62.6
63.5 77.2
66.9 22.1 147.0 46.6 91.9
10.2 0.8 8.8 2.6 2.4
10.6 0.1 0.4
6.6 13.3
0.9 1.4
16.0 14.2
65.1 70.1
45.0 29.9
12.7
68.2 65.7 67.8
47.9 52.1 38.6
Sources: Pan American Health Organization (3-6).
“When data for the entire 1980-l 983 period were not available, the figures corresponding to the most recent year of the cited period were used; and if the latter were not available either, then existing estimates for the 1980-l 985 period were employed.
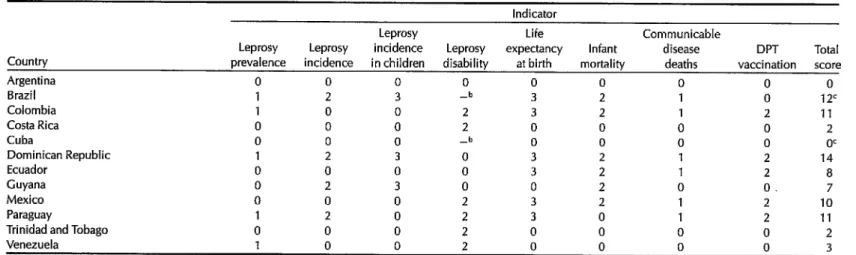
ease death were assigned a value of one; leprosy incidence, leprosy disability, in- fant mortality, and infant DPT vaccina- tion were assigned a value of two; and leprosy incidence in children and life ex- pectancy at birth were assigned a value of three. The value for each indicator was assigned to each country where the data showed the indicator figure to be less fa- vorable than the average, and the coun- try’s total score was derived by adding up the assigned values (Table 4).
The weights assigned to the various in- dicators were derived from their appar- ent importance in either (a) specific eval- uation of leprosy epidemiology and control or (b) assessment of the popula- tion’s general health status. Clearly, this weighting is somewhat arbitrary, but on the whole it is in line with the literature on the subject (12, 23, 15, 16).
With regard to the scoring concept, scoring systems are commonly used to assess risks in fields such as maternal and child health. We know of no instance in which general indicators of public health have been incorporated into scoring sys- tems of this kind. However, in view of the increasing integration of leprosy pro- grams into general public health pro- grams and the known influence of gene- ral socioeconomic and health conditions on persistence of the endemic, we felt it appropriate to apply a scoring system that incorporated such indicators for evaluation of epidemiologic situations (15-21).
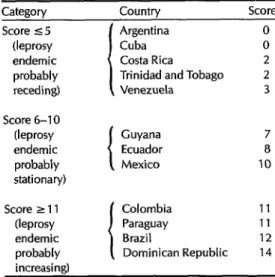
On the basis of the total scores re- ceived, the countries were placed in one of the three following groups: (1) coun- tries with scores of five or less: Leprosy endemic probably receding during 1980- 1983; (2) countries with scores of six to 10: Leprosy endemic probably “station- ary” during 1980-1983; and (3) countries with scores of 11 or more: Leprosy en- demic probably increasing during 1980- 1983 (Table 5).
RESULTS AND COMMENTS
Countries Where the Leprosy
Endemic Was Probably Receding
Argentina: Surveys conducted since the 1950s have generally shown overall prev- alences below 50 cases per 100,000 inhab- itants, which makes the country an area of moderate endemicity according to
World Health Organization (WHO)
guidelines (22).
Our data indicate the leprosy endemic was receding in 1980-1983, Argentina be- ing one of two countries with a total score of 0. This observation is consistent with survey findings indicating a decline in leprosy prevalence since the 1950s (see Table 1).
Cuba: This country also has a leprosy prevalence in the intermediate range, with Table 1 data suggesting a decline since the 1950s. Our data, which give Cuba a total score of 0, are consistent with this picture.
Regarding the lack of leprosy disability data (see Table 4), even if Cuba were found to be above the average, the result- ing score of 2 would still place it among those countries where the leprosy en- demic appears to be declining.
Costa Rica: Previous surveys generally indicated a moderate and stable leprosy prevalence. Our assessment showed fa- vorable (zero) values for all indicators ex- cept that relating to the proportion of di- agnosed cases with disability.
Trinidad and Tobago: The leprosy prev- alence here has declined since the 1950s from high to moderate levels (see Table 1). Like Costa Rica, the country had favo- rable (zero) values for all indicators ex- cept that relating to disability.
Venezuela: Prior surveys have pointed to a notable decline in the high leprosy
Table 4. Indicator value9 and scores derived for the 12 selected countries from the figures shown in Table 3. Indicator
Leprosy Life Communicable
Leprosy Leprosy incidence Leprosy expectancy Infant disease DPT Total Country prevalence incidence in children disability at birth mortality deaths vaccination score
Argentina 0 0 0 0 0 0 0 0 0
Brazil 1 2 3 -b 3 2 1 0 12c
Colombia 1 0 0 2 3 2 1 2 11
Costa Rica 0 0 0 2 0 0 0 0 2
Cuba 0 0 0 -b 0 0 0 0 OC
Dominican Republic 1 2 3 0 3 2 1 2 14
Ecuador 0 0 0 0 3 2 1 2 8
Guyana 0 2 3 0 0 2 0 0. 7
Mexico 0 0 0 2 3 2 1 2 10
Paraguay 1 2 0 2 3 0 1 2 11
6 Trinidad and Tobago 0 0 0 2 0 0 0 0 2
i? Venezuela 1 0 0 2 0 0 n
r
0 3 is vaccination; assigned indicator value of aAssigned indicator value of l-leprosy prevalence and communicable disease deaths; assigned indicator value of Uepro 3-leprosy incidence in children and life expectancy at birth. ,
sv incidence. leorosvdisabilitv. , ,, infant mortality, and DPT
bNo data.
Table 5. Classification of the 12 selected (aside from the relatively high leprosy
countries into three categories according to their prevalence in Venezuela) was the propor- scores.
Cateaorv Countrv Score Score 5 5
(leprosy endemic probably receding) Score 6-10 (leprosy endemic probably stationary) Score 2 11 (leprosy endemic probably increasing1
Argentina Cuba Costa Rica Trinidad and Tobago Venezuela
Guyana Ecuador Mexico
Colombia 11
Paraguay 11
Brazil 12
Dominican Republic 14 8 10
prevalences of the 1950s (see Table 1). However, our data showed an average prevalence in 1980-1983 (91 cases per 100,000) that was still above the average of 70 per 100,000 in the 12 selected coun- tries. The only other indicator not yield- ing a favorable (zero) value was the pro-
portion of diagnosed cases with
disability. However, this unfavorable finding could have been influenced by the fact that leprosy disability is diag- nosed and treated at all levels of care un- der Venezuela’s control program-a pro- cedure not followed in any of the 11 other countries and one that could account for the high percentage of patients with re- corded disability.
. . .
&on of newly diagnosed leprosy c&es with disability. Of course, this indicator is strongly affected by whether or not the leprosy control program was directing its attention to diagnosing disability. It was known to do so in Venezuela, a circum- stance partly accounting for the high fig- ures observed in that country. The rea- sons for the high percentages of cases with disability in Costa Rica and Trinidad and Tobago are less clear, more informa- tion about such things as the clinical forms of the detected cases being re- quired in order to assess this matter. Also noteworthy is the fact that basic informa- tion about the proportion of diagnosed cases with disability was not available for Cuba.
Another significant point is that all the countries except Venezuela exhibited prevalences below the 12-country aver- age, and all had either low levels of ende- micity or a downward trend with regard to past prevalences.
Countries Where the Leprosy
Endemic Was Probably “Stationary”
Guyana:
Past surveys have shown asubstantial decline in the prevalence of leprosy from a high level to an intermedi- ate one in recent decades (see Table 1). Besides an above-average incidence of leprosy, the country exhibited unfavor- able data for two indicators, both child- related, these being leprosy incidence among children and infant mortality.
Ecuador:
The available data appear openOn the whole, the 1980-1983 results for to question. For one thing, the two sur- the countries in this group were similarly veys conducted in the 1950s and noted in favorable with regard to the four specific Table 1 showed very low prevalences, leprosy indicators and the four general while the two conducted later showed health indicators, and were also in agree- substantially higher intermediate-level ment with prior prevalence survey data. prevalences. In addition, our 1980-1983 Indeed, the sole unfavorable indicator data showed Ecuador to have below av-
erage (favorable) values for all four lep- rosy indicators and above average (unfa- vorable) values for all four general health indicators. It seems likely that this inter- nal inconsistency can be attributed to ar- tifacts generated by operational factors in Ecuador’s leprosy control program.
Mexico: Leprosy prevalence has been declining in Mexico since the 1950s and now stands at relatively low levels. De- spite this general trend, however, there was little agreement between our leprosy and general health indicators-all the lep- rosy indicators except leprosy disability appearing favorable and all the general health indicators appearing unfavorable. These findings could have a variety of ex- planations, one probably important fac- tor being the leprosy control program’s lack of integration into the general health care system.
. . .
Ecuador and Mexico showed a clear discrepancy between scores for specific leprosy indicators and general health in- dicators. In contrast, Guyana exhibited generally favorable indicator values aside from a relatively high leprosy incidence and unfavorable child-related indicators.
It thus seems likely that operational factors had an important influence in the first two countries, while epidemiologic factors associated with leprosy transmis- sion levels played a key role in Guyana. In all three cases, it seems reasonable to conclude that the apparently stationary status of the endemic derived not so much from a stable equilibrium as from interaction of opposing trends.
Countries Where the Leprosy
Endemic Was Probably Increasing
Colombia:
In general, past surveys haveshown an intermediate leprosy preva-
lence that may have declined slightly since the 1950s (Table 1). As of 1980-1983, unfavorable values for all four general health indicators and two leprosy indica- tors suggested an unfavorable situation. Within this context, the favorable scores for low leprosy incidence and low lep-
rosy incidence among children seem
likely to be artifacts derived from poor integration of the leprosy control pro- gram into the general health system.
Paraguay:
This country has had a highleprosy prevalence since the 1950s (Table 1). Regarding our eight 1980-1983 indica- tors, favorable scores were obtained for only two, both relating to the child popu- lation (leprosy incidence in children and infant mortality). As in Guyana, it seems likely that epidemiologic factors associ- ated with leprosy transmission were mainly responsible for this finding.
Brazil: Like Paraguay, Brazil has had a high leprosy prevalence since the 1950s (Table 1). Regarding our 1980-1983 data, Brazil had unfavorable values for all the indicators except infant DPT vaccination. The country also accounted for 70% of all registered leprosy cases in the 12 selected countries and for 80% of all the new lep- rosy cases diagnosed in these countries during 1980-1983. While the proportion of newly diagnosed cases with disability in the study period is unknown, a favora- ble score would not have changed the country’s classification.
Dominican Republic: Previous surveys have indicated an upward trend from low prevalences in the 1950s to interme- diate prevalences in the 1970s and 1980s (Table 1). Except for the proportion of newly diagnosed leprosy cases with dis- ability (an indicator influenced by the control program’s degree of discrimina- tion and sophistication), the values ob-
tained for all our indicators using 1980- 1983 data were unfavorable.
. . .
These countries where the endemic is probably increasing seem similar with re- spect to both leprosy-specific and general health indicator scores, and also with re- gard to trends in leprosy’s long-term prevalence. Nevertheless, Brazil consti- tutes a special case because of the enor- mous importance of its contribution to the epidemiologic profile of leprosy in the Americas, the highly irregular distribu- tion of leprosy within Brazil’s vast and varied territory, and the complexity of Brazil’s extensive health system-a com- plexity that increases the difficulty of ana- lyzing the leprosy problem.
CONCLUDING REMARKS
As may be seen from the foregoing, the leprosy endemic in the Americas is highly diverse. This diversity arises from epidemiologic factors, including vari- ations in the intensity of transmission, as well as from the nature and effectiveness of control measures.
However, it has proved difficult to ob- tain reliable statistical data on the leprosy situation in particular areas, and hence the soundness of criteria commonly used to estimate endemic levels is question- able. Improving systems for collecting and analyzing basic epidemiologic data on leprosy is therefore a matter that de- serves attention. It is particularly impor- tant that such systems apply unified stan-
dards so that effective comparisons can be made between specific indicators in
different areas (14,23).
With regard to the work reported here, two of the specific leprosy indicators em- ployed seem especially deserving of fur- ther study. These indicators are the pro-
portion of newly diagnosed leprosy cases with disability and the recorded inci- dence of leprosy cases among children, the first because of the insight it provides into the success of case detection and control efforts, and the second because of its relevance to epidemiologic trends.
Also, it would appear highly worth- while to make a more thorough study of criteria that could be used to evaluate the leprosy situation-criteria reflecting eval- uation of the endemic as well as general health and socioeconomic indicators.
In general, it appears that the leprosy situations in the countries where the en- demic seemed to be receding are fairly similar, and the same can be said in most countries where the endemic is increas- ing. However, the leprosy situations do not appear similar in those countries where the endemic seems more or less stationary, these situations apparently in- volving opposing trends and in some cases aberrent data.
Overall, certain basic changes in the Americas, most notably intense urban- ization and attempted implementation of the primary health care strategy (in which leprosy control may be integrated to a greater or lesser degree) need to be considered in undertaking efforts to more clearly define the true epidemio- logic situation (17). Also, the advent of new multiple drug treatment regimens now coming into use in the Americas de- mands quick development of monitoring systems that can evaluate the impact of these regimens (13, 22, 22). In addition, because leprosy strikes mostly at the so- cioeconomically deprived and because it stigmatizes its victims, epidemiologic study of relevant social factors is of cen- tral importance.
By way of general recommendations, the following steps appear advisable:
l Adoption of the OMSLEP leprosy
patient registration and reporting
system (23) by PAHO’s Member Countries;
l Formation of an advisory working
group to examine unified criteria for the establishment of treatment regi- mens in the countries of the Region;
l Pursuit of epidemiologic research-
including descriptive studies (espe- cially historical study of relevant fac- tors, retrospective study of long- term trends, and disability incidence
and prevalence surveys); operational
studies of such things as health ser-
vice delivery models, integration of
the primary health care system, as- similation of leprosy control into the social security system, and health care models that incorporate disabil- ity prevention; and identification of high-risk groups and risk factors (in-
cluding socioenvironmental, demo-
graphic, and sociocultural factors); and
l Promotion of training through such
actions as designing teaching mod- ules for in-service training of basic health services personnel, participat- ing in leprosy control programs, and developing a course in leprosy con- trol epidemiology for those in charge of leprosy control programs through- out the Region.
REFERENCES
Irgens, L.M. Leprosy in Norway. Lepr Rev 51 (Suppl l):l-130,198O.
Saikawa, K. Effect of rapid socioeconomic development on the frequency of leprosy in a population. Lepr Rev 52 (Suppl 1):X7-195,1981.
Pan American Health Organization. An-
nual Reporf offhe Direcfor, 1984. PAHO Of-
ficial Document 201. Washington, DC,
1985.
Pan American Health Organization. Lep- rosy in the Americas. PAHO Epidemiologi- cal Bulletin 4(6):1-7,1983.
5. 6. 7. 8. 9. 10. 11. 12. 13. 14. 15.
Organization Panamericana de la SaIud. Estimativas de poblacion de 10s pa&es de la AMRO, 1974 a 1983. Washington, DC, 1985.
Organization Panamericana de la SaIud. Relatorios de trabajo HPT-LEP-1. PAI-IO
mimeographed document. Washington,
DC, 1980-1983.
Motta, C.I? The Epidemiological Situation of Leprosy in the Americas. Paper pre- sented at the Symposium on the Epidemi- ology of Leprosy, Geilo, Norway, 1981. Lqpr Reu 52(Suppl1):61-68,198l.
Bica, A.N., J. Roman, and A. Saenz. El problema de la lepra en las Americas. BoZ Of Sanif Panam 42(6):548-556, 1957. Sousa Lima, L. La lepra en las Americas. In: Organization Panamericana de la Sa- lud. Seminario sobre el Control de la Lepra, Belo Horizonfe, Brasil, 30 de junio-7 de julio de 2958. PAHO Scientific Publication 41. Washington, DC, 1959, pp. 472-493. Brubaker, M.L. Estado de la lepra en las
Americas. In: Organization Panameri-
cana de la SaIud. IV Seminario Panameri- cane sobre el Confrol de la Lepra. PAHO Sci- entific Publication 344. Washington, DC, 1977, pp. 84-98.
Motta, C.P., and M.V Borges. Leprosy in the Americas. In: Pan American Health Organization. Bolivar’s Bicentennial Sem- inar on Leprosy Research and Control, Caracas, 1983. Washington, DC, 1983, pp. 72-94.
Laurenti, R., M.H.I? MeIIo Jorge, M.L. Lebdo, and S.L.D. GotIieb. Esfafisficas de Satide. Editora Pedagogica Universitarial Editora de Universidade de Sao PauIo, SBo PauIo, 1985.
World Health Organization. Epidemiol- ogy of leprosy in relation to control. WHO Technical Report Series, No. 716. Geneva, 1985.
Lechat, M.F., and M. Vanderveken. Indi- cadores epidemioldgicos basicos para la vigiIancia de la lucha contra la lepra. Or-
ganizacion Panamericana de la SaIudl
Organization MundiaI de la SaIud. Serie de publicaciones sobre desarrollo tecnolo- gico en salud, No. 84138. Washington, DC, 1984.
Fortney, J.A., and E .W. White Horne. The development of an index of high-risk pregnancy. Am J Obsfef GynecoZ143(5):505, 1982.
16. Haeri, A.D., J. South, and J. Naldrett. A scoring system for identifying pregnant patients with a high risk of perinatal mor- tality. I Obstet Gynaec &if Cwlth 81(7):536, 1974.
17. Organization Panamericana de la Salud. Usos y perspectivas de la epidemiologfa. Serie de publicaciones sobre desarrollo tecnologico en salud, No. 84-47. Wash- ington, DC, 1984.
18. Alvarenga, A.T. 0 conceit0 de risco na
area materno-infantil: Consideracbes
tebricas, metodoldgicas e de aplicacIo.
Doctoral thesis. Faculdade de Saude
Publica da Universidade de Sao Paula, SHo Paulo, 1984.
19. Backett, E.M., A.M. Davies, and A. Pe- trosbarvazian. 0 enfoque de risco na as- sist&ncia h satide: Corn especial refe&ncia
a satide materno-infantil, inclusive plane- jamento familiar. PAHO Scientific Publi- cation 491. Organizacao Panamericana da Sadde, Washington, DC, 1985.
20. Edwards, L.E., I. Barrada, R.W. Tatreau, and E.Y. Hakanson. A simplified antepar- turn risk-scoring system. Obsfef Gynecol 54(2):238, 1979.
21. Nesbitt, R.E.L., and R.H. Aubry. High- risk obstetrics: II. Value of semiobjective grading system in identifying the vulnera- ble group. Am J Obstet Gynecol103(3):973- 975,1965.
22. World Health Organization. A Guide to Leprosy Control. Geneva, 1980.
23. Lechat, M.F., C.B. Misson, and J. Walter.
OMSLEP, Recording and Reporting Sys-
tem for Leprosy Patients. World Health Organization, Geneva, 1983.
International Meeting to be Held on Lung Health
A World Conference on Lung Health will be held from 20 to 24 May 1990 in Boston, Massachusetts. The conference is a unique collaborative effort combining the annual meeting of the American Lung Association/
American Thoracic Society and the quadrennial meeting of the Interna- tional Union Against Tuberculosis and Lung Disease. The latter is the only international voluntary organization dedicated to the fight against respira- tory disease and has membership in 113 countries. The conference will present an opportunity for scientists, clinicians, and public health educa- tors from around the globe to exchange vital information about the preven- tion and control of lung disease. Themes discussed will be of international interest and will be presented in a variety of interactive sessions. Simulta- neous interpretation into French, Spanish, and English will be provided for selected sessions. For more information write to Richard I’. Grimes, Di- rector, World Conference on Lung Health, American Lung Association, 1740 Broadway, New York, NY 10019-4374, USA.