Validation of Clinical Indicators of Imbalanced
Nutrition: Less Than Body Requirements in
Early Childhood
Iane Ximenes Teixeira MD, Marcos Venícios de Oliveira Lopes PhD
⁎
,
Larissa Castelo Guedes Martins MD, Camila Maciel Diniz RN,
Angélica Paixão de Menezes RN, Naiana Pacífico Alves RN
Nursing Department at Federal University of Ceará, Fortaleza, Ceará, Brazil
Received 24 November 2014; revised 12 February 2015; accepted 23 February 2015
Key words:
Nursing diagnosis; Nutritional status; Pediatrics;
Diagnostic accuracy
This is a clinical validation study of the nursing diagnosis of imbalanced nutrition: less than body requirements based on the diagnostic accuracy measures. Measures of sensitivity and specificity were calculated based on the latent class analysis method using a random effects model in a sample of 123 children between 0 and 6 years old. The prevalence of the diagnosis was estimated to be 27.6% using the latent class model. Indicators that exhibited the best measures of diagnostic accuracy included insufficient interest in food and satiety immediately upon ingesting food. A total of seven clinical indicators were validated clinically.
© 2016 Elsevier Inc. All rights reserved.
BEST CLINICAL PRACTICE depends on the ability to identify clear, precise and accurate clinical indicators that represent the phenomena that delimit the body of knowledge of a profession. In this context, nursing diagnoses represent the human responses of individuals for whose care nurses are directly responsible. To this end, the identification of a nursing diagnosis depends on defining characteristics (signs and symptoms) externalized by patients and represents clinical indicators that should be validated in specific populations. These clinical validation processes allow the nursing diagnoses to be refined after identifying the diagnostic accuracy of each clinical indicator and to expand the evidence supporting such diagnoses.
Unbalanced nutrition is one of the most frequent nursing diagnoses among vulnerable populations, including children (Lima, de, Motta, Santos, & Silva, 2004; Ribeiro, Silva, Guerra, & Lima, 2011), adults (Lamb, Parr, Lamb, & Warren,
2009; Lucena et al., 2011; Rocha, Maia, & Silva, 2006), and the elderly (Almeida et al., 2008). However, most of the studies only describe the prevalence of unbalanced nutrition without describing any processes to clinically validate this phenome-non as a nursing diagnosis.
The NANDA International (NANDA-I) taxonomy lists 21 diagnoses in the domain Nutrition, and the nutritional imbalance states are represented by three such diagnoses: imbalanced nutrition: less than body requirements, obesity and overweight (Herdman & Kamitsuru, 2014). Many articles have focused on increased nutrient intake in response to the global obesity epidemic. However, few clinical validation studies have been developed for the nursing diagnosis corresponding to nutritional imbalance even though nutritional deficiencies are prevalent in many countries, especially in developing or underdeveloped countries.
Unbalanced nutrition poses considerable risks for human beings. Famine and unbalanced nutrition contribute to the premature death of mothers, infants and children in early childhood as well as to poor physical and mental
⁎Corresponding author: Marcos Venícios de Oliveira Lopes, PhD.
development in young (Brundtland, 2000). Around the world, approximately 115 million children are underweight. Furthermore, growth delay, which is considered an indicator of chronic malnutrition, hinders the development of 171 million children under 5 years (World Health Organization, 2014). Moreover, in developed countries, the costs of hospitalization are increased when patients exhibit malnu-trition (Elia, Russell, & Stratton, 2010).
Thus, early and accurate detection of an imbalance in the metabolic requirements due to inadequate nutrient intake is the first step in minimizing the immediate and late effects of malnutrition. The literature describes a number of signs and symptoms that characterize nutritional energy and protein deficiency as well as deficiencies of various vitamins and minerals: pale inner tongue and lips, lack of energy, loss of appetite, growth inhibition, bone abnormalities, delayed growth, apathy, dry skin, dry and brittle hair, abdominal and/or lower limb edema, loss of taste, irritability, excessive crying, infections, diarrhea, skin lesions, hair loss, slow thinking, neurological damage, and impaired wound healing (Knudsen, 2012).
Most of these signs and symptoms are associated with extremely severe conditions of malnutrition. However, the identification of clinical indicators in the early stages of nutritional imbalance can assist in the early identification of this phenomenon and aid in clinical screening work. The NANDA-I defines imbalanced nutrition: less than body requirements as insufficient nutrient intake to meet metabolic needs (Herdman & Kamitsuru, 2014). In principle, this diagnosis reflects pre-clinical malnutrition, especially if compared with the definition of malnutrition presented by the World Health Organization, which describes a nutritional deficiency (Blössner & De Onis, 2005).
On the NANDA-I taxonomy, imbalanced nutrition: less than body requirements exhibits 22 defining characteristics, including the following: abdominal cramping; abdominal pain; alteration in taste sensation; body weight 20% or more below ideal weight range; capillary fragility; diarrhea; excessive hair loss; food aversion; food intake less than the recommended daily allowance (RDA); hyperactive bowel sounds; insufficient information; insufficient interest in food; insufficient muscle tone; misinformation; misperception; pale mucous membranes; perceived inability to ingest food; satiety immediately upon ingesting food; sore buccal cavity; weakness of muscles required for mastication; weakness of muscles required for swallowing; and weight loss with adequate food intake (Herdman & Kamitsuru, 2014).
The defining characteristics described by NANDA-I are similar to the signs and symptoms associated with more severe nutritional problems, although there is not a complete equivalence between the clinical indicators. In addition, some defining characteristics seem to refer to etiologic factors, such as misperception and misinformation. Furthermore, signs and symptoms often associated with nutritional changes are not included in the list of defining characteristics, such as irritability, slow thinking, excessive crying, dry and brittle hair, dry skin, and abdominal and/or lower limb edema.
The lack of important clinical indicators and/or the confounding of the cause–effect relationship between the elements that make up a diagnosis impair the diagnostic inference and subsequent decision making, leading to poor health outcomes. Furthermore, the prevalence of this diagnosis may be underestimated and lead clinicians to prioritize other supposedly more prevalent diagnoses. Thus, the present study aimed to validate the clinical indicators of the nursing diagnosis of imbalanced nutrition: less than body requirements in early childhood. Specifically, this study aimed to estimate the prevalence of the diagnosis and the frequency of its clinical indicators.
Methods
Design and Sample
This study is a clinical validation study based on measures of diagnostic accuracy for clinical indicators of the nursing diagnosis imbalanced nutrition: less than body requirements in early childhood. The study was developed in a non-governmental organization (NGO) that works to combat child malnutrition in northeastern Brazil. Data collection began after the necessary approvals by the ethics committee of the institution responsible for research and the consent of the parents or guardians to the terms of consent.
To estimate the sample size, we used the formula n = [Zα
2.Se.(1 – Se)]/(L2.P) (Zhou, Obuchowski, & McClish,
2012). The sample size was set at 123 children and was calculated assuming a confidence level of 95% (Zα), sensitivity (SE) of 80% and a precision of estimates (L) of 10%. For prevalence (P), the estimated value of 0.5 was used, suggesting that at least 50% of the population under study exhibited a positive diagnosis, given that no studies that have identified this parameter. Children between 0 and 6 years old were included in the study. Children were excluded if they exhibited cerebral palsy, signs of infection or any indication of hospitalization due to clinical instability.
Data Collection
For data collection, an instrument was developed based on the defining characteristics of the nursing diagnosis
“Imbalanced Nutrition: less than body requirements”, according to the NANDA-I Taxonomy (Herdman & Kamitsuru, 2014) and on the relevant literature about the theme. The instrument for data collection also included sociodemographic data and six other clinical indicators described in the literature as signs and symptoms indicative of childhood nutritional deficiency that were not listed by NANDA-I as defining characteristics of the diagnosis.
both to defining characteristics cited in the NANDA-I taxonomy and to the other six signs and symptoms identified in the literature. Data collection was performed by physical examination of the child, interview with their parents or guardians for obtaining the information about sociodemo-graphic data and symptoms, and an analysis of medical records. The defining characteristic capillary fragility was not evaluated because during a pilot test on 5% of the total sample, most children did not tolerate the test that detected its presence (lace testing). Thus, 27 clinical indicators related to the nursing diagnosis of imbalanced nutrition: less than body requirements (21 defining characteristics and 6 clinical signs identified in the literature) were evaluated. Operational definitions were constructed for each clinical indicator according to the literature.
Data Analysis
Data were statistically analyzed with the support of R software version 2.12.1. The descriptive analysis included the calculation of absolute frequencies, percentages, mea-sures of central tendency and dispersion. Confidence intervals of 95% were calculated for the proportions of categorical variables. The Lilliefors test was applied to check the adherence to the normal distribution. The association between clinical indicators and socio-demographic data were analyzed by applying the chi-square test for independence or Fisher's exact test according to the expected frequency of each category. The prevalence ratios (PR) and their respective 95% confidence intervals were used to measure the magnitude of the relationship between clinical indicators and categorical variables of interest. The Mann–Whitney test was applied to assess differences in quantitative variables between children with and without clinical indicators.
The method of latent class analysis (LCA) was used to calculate the measures for diagnostic accuracy for each clinical indicator by and interpreted in accordance with the specialized literature (Lopes, Silva, & Araújo, 2012). LCA is a statistical technique based on the assumption that an unobserved variable (latent) determines the associations between observed variables (Collins & Lanza, 2010). A model with two latent classes with random effects was used to calculate the sensitivity and specificity with 95% confidence intervals (Qu, Tang, & Kutner, 1996). Random effects were included in the model by considering the local dependency that exists between clinical indicators. The likelihood ratio test (G2) was applied to verify the goodness
of fit of the latent class models. A clinical indicator was considered statistically significant if at least one of its confidence intervals (either for sensitivity or specificity) was above 0.5.
Because of the large number of clinical indicators, an initial latent class model with all indicators was initially adjusted and referred to as the null model. From this model, clinical indicators that exhibited the worst performance, assessed in the first instance by the non-statistical signifi-cance of confidence intervals and in a second instances as the
smallest area under the receiver operator curve (average of values from sensitivity and specificity), were sequentially removed from the dataset. A new latent class model was built such that it exhibited good fit according to the G2test. From the set to
the total sample model, three other models were adjusted for gender, age and duration of follow-up at the institution. For all analyses, we used a significance level of 5%.
Results
Clinical Indicators and Demographic Variables
The distribution of children by gender was uniform (53.7 vs. 46.3%). The majority of children did not attend school (63.4%), and at least half of the children were under 35 months of age. In addition, the children's families comprised an average of five members, and the average follow-up time at the NGO was 14.07 months (SD: 19.24) (Table 1).Table 2lists only 23 of the 27 evaluated clinical indicators because the variables excessive hair loss, insufficient informa-tion, misinformainforma-tion, and abdominal and/or lower limb edema were not identified in the sample. The most frequent clinical indicator in the study was food intake less than RDA (48.8%), followed by irritability (48.0%), satiety immediately upon ingesting food (37.4%) and insufficient interest in food (33.3%). None of the clinical indicators were related to the gender of the child. Three clinical indicators exhibited a statistically significant association school attendance; school children exhibited an increase of approximately 70% in the frequency of abdominal pain (PR = 1.68; 95% CI: 1:06–2.66; p = 0.040) and 80% in the frequency of perceived inability to ingest food (PR = 1.78; 95% CI: 1.10–2.88; p= 0.040). Moreover, the frequency of hyperactive bowel sounds exhibited an increase of 44% among children who were not attending school (PR = 1:44; 95% CI: 1:12–1.85;p = 0.046). Insufficient interest in food was more commonly observed in older children (mean ranks: 73.65 vs. 56.18; p = 0.010), and a similar relationship was observed for the
Table 1 Demographic data of the sample.
Variables n % 95% CI
1. Gender
Male 66 53.7 44.47 62.61
Female 57 46.3 37.38 55.52
2. Attends school
Yes 45 36.6 28.22 45.79
No 78 63.4 54.20 71.77
Mean SD Median IQR p-Valuea Age (months) 35.20 19.24 35.00 33 0.050 Number of family
members
5.52 2.21 5.00 2 b0.001
Follow-up time in NGO (months)
14.07 12.10 12.00 17 b0.001
indicator perceived inability to ingest food (mean ranks: 80.74 vs. 59.00;p= 0.020).
The indicators misperception and dry skin were more frequent in children from larger families (mean ranks: 80.66 vs. 58.59; p = 0.012/mean ranks: 73.58 vs. 56.63; p = 0.013, respectively). However, family size was smaller among children who had the clinical indicator irritability (mean ranks: 54.70 vs. 68.73;p= 0.027). Follow-up by the NGO was statistically higher among children who had dry and brittle hair (mean ranks: 77.95 vs. 56.15;p= 0.003).
Diagnostic Accuracy Based on Latent Class Analysis
The final latent class model included seven clinical indicators, as shown inTable 3. The indicators insufficient interest in food and satiety immediately upon ingesting food exhibited the best sensitivity (85.02 and 76.22%, respectively), demonstrating a relationship with the initial spectra of the diagnosis of imbalanced nutrition: less than body requirements from the sample under study. Moreover, the clinical indicators food aversion, weakness of muscles required for swallowing, perceived inability to ingest food, and alteration in taste sensation exhibited specificity values above 90%, indicating that these were good indicators to confirm the presence of anursing diagnosis of imbalanced nutrition. The prevalence of the nursing diagnosis imbalanced nutrition: less than body requirements was estimated by the latent class model to be 27.6% (95% CI: 19.7–35.5%).
Latent class models adjusted for gender exhibited small differences in measures of diagnostic accuracy. The clinical indicator perceived inability to ingest food was statistically significant only for female children, whereas the alteration in taste sensation was significant only for male children. Other indicators exhibited similar measures of diagnostic accuracy between genders (Table 4).
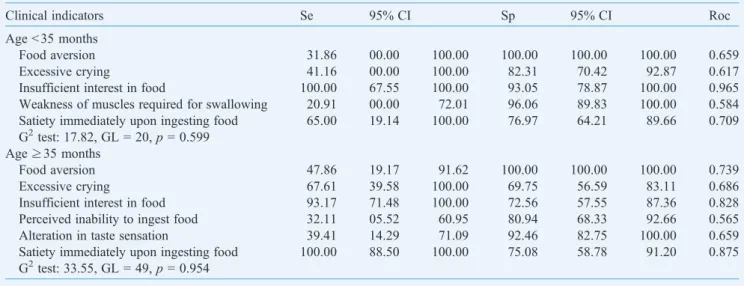
Some differences in the measures of accuracy were also identified when comparing children older than 3 years with those who were younger. The clinical indicator weakness of muscles required for swallowing was significant only for younger children, whereas the clinical indicators perceived inability to ingest food and alteration in taste sensation were significant only for older children (Table 5).
Finally, the data regarding the sensitivity and specificity of clinical indicators related to follow-up at the NGO revealed that the clinical indicator excessive crying was only statistically significant in the adjusted model for children followed less than 1 year in service. On the other hand, the satiety immediately upon ingesting food was statistically significant only for children with longer follow-up times (Table 6).
Discussion
In underserved communities, families may experience a shortage of financial resources for food, and the family income may be used to purchase foods that are unsuitable to children's development (Frota, Pasco, Bezerra, & Martins, 2009). This characteristic is corroborated by the results found in this study, where the most frequent clinical indicator was food intake less than the recommended daily allowance (48.8%). This fact reflects the idea that despite the reduction in malnutrition rates in recent years, children do not seem to be receiving adequate nutrition due to a preference for industrialized products that are more practical for mothers. Unfortunately, in addition to causing malnutrition in underserved communities, this preference for industrialized foods has contributed to the transition from malnutrition to obesity in developed countries.
The second most frequent clinical indicator was irritabil-ity, which was present in almost half of the sample. Corroborating the data found in our study, Frota, Mota, Albuquerque, Silveira, and Oliveira (2011) noted that irritability was associated with the presence of other signs and symptoms of malnutrition, such as easy crying, apathy, attention deficit hyperactivity, restless sleep, and poor language, in families of malnourished children. Similar findings were reported in the study of Barbosa, Martins, Silva, and Carvalho (2005), who described the perceptions of pain by the mothers of malnourished children.
In a recent study that addressed the transition from malnutrition to obesity,Soares et al. (2013)also described a strong association between irritability and other clinical
Table 2 Clinical indicators of the nursing diagnosis of imbalanced nutrition: less than body requirements in early childhood.
Clinical indicators n % 95% CI
Food intake less than recommended daily allowance (RDA)
60 48.8 39.72 57.91
Irritability 59 48.0 38.94 57.12
Satiety immediately upon ingesting food
46 37.4 28.97 46.62
Insufficient interest in food 41 33.3 25.24 42.47 Body weight 20% or more below ideal
weight range
40 32.5 25.51 41.63
Dry skin 39 31.7 23.77 40.79
Excessive crying 38 30.9 23.04 39.95
Diarrhea 34 27.6 20.14 36.55
Dry and brittle hair 33 26.8 19.43 35.70 Pale mucous membranes 30 24.4 17.29 33.11
Abdominal pain 26 21.1 14.50 29.61
Slow thinking 21 17.1 11.11 25.14
Alteration in taste sensation 10 16.7 8.70 28.97
Misperception 19 15.4 9.78 23.32
Perceived inability to ingest food 17 13.8 8.48 21.48 Hyperactive bowel sounds 15 12.2 7.21 19.61
Food aversion 11 8.9 4.77 15.79
Weakness of muscles required for swallowing
11 8.9 4.77 15.79
Abdominal cramping 9 7.3 3.61 13.82
Sore buccal cavity 6 4.9 1.99 10.76
Insufficient muscle tone 3 2.4 0.63 7.50 Weakness of muscles required for
mastication
1 0.8 0.04 5.11
indicators, including continual weeping associated with hunger. This condition was considered a warning sign for the possible clinical worsening of malnutrition.Costa Junior and Zannon (1997)previously described in their study the functional and structural effects of malnutrition on the nervous system. Such effects include the loss of the acquisition of behaviors and academic performance in individuals as well as changes in behavior related to the mother–child interaction and to the child's ability to explore the environment.
The high frequency of the clinical indicator abdominal pain observed in this study can be considered a warning sign for intestinal parasites, especially if we compare the age of the children assessed with data obtained from other studies. For example,Biscegli et al. (2009)evaluated the nutritional status and the prevalence of intestinal parasites in children aged 7 to 78 months of age enrolled in a nursery and found that the 25 to 60 months-old age group most affected by intestinal parasites. In another study conducted with children between 2 and 6 years of age, the prevalence of intestinal parasites was 36.7% (Castro et al., 2005). Enteroparasites
aggravate malnutrition and, in more serious medical conditions, can lead to the death of the child.
No study or plausible justification was found for the relationship between the number of family members and the clinical indicators misperception and dry skin. It is possible that these relationships are clinically spurious. Furthermore, the term misperception seems to indicate an etiologic factor for nutritional imbalance, suggesting that more people are needed to find lower costing and higher quantities of food. Often, cheap foods can represent lower nutritional quality and/or compositions rich in carbohydrates and poor in other nutrients (Mink, Evans, Moore, Calderon, & Deger, 2010). Unfortunately, these foods produce a feeling of satiety, inducing a belief of being well fed.
Another important point in the present study was the more frequent occurrence of the clinical indicators insufficient interest in food and perceived inability to ingest food among older children. A study conducted in Portugal to validate a questionnaire designed to investigate the feeding behavior of children identified that emotional eating and food selectivity
Table 3 Sensitivity (Se), specificity (Sp) and area under the ROC curve (Roc) of clinical indicators for imbalanced nutrition: less than body requirements estimated by latent class analysis.
Clinical indicators Se 95% CI Sp 95% CI Roc
Food aversion 32.40 14.13 54.32 100.00 97.94 100.00 0.662
Excessive crying 63.96 44.85 85.94 81.71 71.42 91.66 0.728
Insufficient interest in food 85.02 65.50 100.00 86.37 75.98 95.92 0.856
Weakness of muscles required for swallowing 25.08 09.45 45.45 97.21 92.26 100.00 0.611
Perceived inability to ingest food 28.40 11.26 47.45 91.74 85.05 97.47 0.600
Alteration in taste sensation 27.22 11.08 47.30 94.65 88.66 100.00 0.609
Satiety immediately upon ingesting food 76.22 56.56 100.00 77.40 66.76 87.74 0.768 G2test: 75.59,df= 108,p= 0.992
Table 4 Sensitivity (Se), specificity (Sp) and area under ROC curve (Roc) of clinical indicators for imbalanced nutrition: less than body requirements estimated by latent class analysis and adjusted by gender.
Clinical indicators Se 95% CI Sp 95% CI Roc
Gender = female
Food aversion 16.13 00.00 41.78 100.00 95.85 100.00 0.580
Excessive crying 68.26 39.27 100.00 86.18 71.70 100.00 0.772
Insufficient interest in food 74.00 46.29 100.00 91.57 75.30 100.00 0.827
Weakness of muscles required for swallowing 21.51 00.00 53.51 100.00 95.49 100.00 0.607 Perceived inability to ingest food 27.06 04.85 58.88 97.48 89.60 100.00 0.622 Satiety immediately upon ingesting food 72.39 47.06 100.00 80.37 63.67 96.29 0.763 G2test: 28.84,df= 44,p= 0.962
Gender = male
Food aversion 42.27 16.50 78.31 100.00 96.11 100.00 0.711
Excessive crying 60.48 31.09 99.99 81.83 68.90 94.49 0.711
Insufficient interest in food 88.49 66.67 100.00 84.60 69.41 99.99 0.865
Weakness of muscles required for swallowing 26.42 05.47 50.85 95.75 87.66 100.00 0.610
Alteration in taste sensation 33.47 10.87 66.66 98.59 92.10 100.00 0.660
increased with age (Viana & Sinde, 2008). Thus, older children exhibited a greater ability provide reasons for their refusals to parents as well as to establish the limits of their food tolerance. On the other hand, no study on the perceived inability to ingest food was found.
From the final ACL model, we determined that the clinical indicators satiety immediately upon ingesting food and insufficient interest in food exhibited high sensitivity values denoting good diagnostic accuracy for the identification of imbalanced nutrition: less than body requirements at an early stage. These findings are corroborated by the study ofPerosa, Carvalhaes, Benicio, and Silveira (2011), which compared the maternal strategies for feeding between mothers of malnour-ished children and eutrophic children. The authors realized that, despite using similar strategies, in a feeding taking an average or
20–40 minutes, eutrophic children tended to complete the meal, whereas malnourished children did not tend to finish the meal. The authors concluded that malnourished children exhibit a significant lack of appetite, exhibiting greater resistance to maternal attempts to feed them.
We also noted that the clinical indicators food aversion, weakness of muscles required for swallowing, perceived inability to ingest food, and alteration in taste sensation exhibited specificity values above 90%, indicating a strong ability to confirm the presence of the nursing diagnosis in question. In other words, considering the sample under study, the absence of these clinical indicators was related to the absence of unbalanced nutrition: less than body requirements.
With respect to the estimated 27.6%, prevalence of the diagnosis imbalanced nutrition: less than body requirements,
Table 5 Sensitivity (Se), specificity (Sp) and area under ROC curve (Roc) of clinical indicators for imbalanced nutrition: less than body requirements estimated by latent class analysis and adjusted by age.
Clinical indicators Se 95% CI Sp 95% CI Roc
Ageb35 months
Food aversion 31.86 00.00 100.00 100.00 100.00 100.00 0.659
Excessive crying 41.16 00.00 100.00 82.31 70.42 92.87 0.617
Insufficient interest in food 100.00 67.55 100.00 93.05 78.87 100.00 0.965
Weakness of muscles required for swallowing 20.91 00.00 72.01 96.06 89.83 100.00 0.584 Satiety immediately upon ingesting food 65.00 19.14 100.00 76.97 64.21 89.66 0.709 G2test: 17.82, GL = 20,p= 0.599
Age≥35 months
Food aversion 47.86 19.17 91.62 100.00 100.00 100.00 0.739
Excessive crying 67.61 39.58 100.00 69.75 56.59 83.11 0.686
Insufficient interest in food 93.17 71.48 100.00 72.56 57.55 87.36 0.828
Perceived inability to ingest food 32.11 05.52 60.95 80.94 68.33 92.66 0.565
Alteration in taste sensation 39.41 14.29 71.09 92.46 82.75 100.00 0.659
Satiety immediately upon ingesting food 100.00 88.50 100.00 75.08 58.78 91.20 0.875 G2test: 33.55, GL = 49,p= 0.954
Table 6 Sensitivity (Se), specificity (Sp) and area under ROC curve (Roc) of clinical indicators for imbalanced nutrition: less than body requirements estimated by latent class analysis and adjusted by follow-up time in NGO.
Clinical indicators Se 95% CI Sp 95% CI Roc
Follow-up timeb12 months
Food aversion 37.32 11.93 78.06 100.00 95.34 100.00 0.686
Excessive crying 12.40 00.00 35.40 84.73 72.81 94.24 0.485
Insufficient interest in food 66.12 38.85 100.00 81.37 67.65 94.27 0.737
Weakness of muscles required for swallowing 37.32 11.86 78.06 100.00 95.75 100.00 0.686 Perceived inability to ingest food 37.32 11.58 74.28 100.00 95.17 100.00 0.686
Alteration in taste sensation 83.31 59.30 100.00 83.07 67.86 99.99 0.831
G2test: 34.34, GL = 48,p= 0.931 Follow-up time≥12 months
Food aversion 29.03 07.46 59.60 100.00 100.00 100.00 0.645
Insufficient interest in food 100.00 81.87 100.00 89.33 72.65 100.00 0.946
Weakness of muscles required for swallowing 11.94 00.00 29.85 93.43 84.63 100.00 0.526
Perceived inability to ingest food 26.50 05.17 51.90 85.62 74.27 95.97 0.560
Alteration in taste sensation 32.74 08.76 62.77 92.49 83.07 100.00 0.626
one notices a significant reduction in child malnutrition rates today, which is gradually being replaced by an increase in the rates of overweight and obesity in all age groups.Moreira and Goldani (2010) posit that this nutrition transition is characterized by rapidly changing nutritional standards associated with changes in the quantity and quality of the diet, which are related to economic, demographic, environ-mental and cultural changes in the last 40 years.
Although seven clinical indicators were identified, the results presented in this study should be viewed with discretion because the sample exhibited an overall low prevalence of imbalanced nutrition, which influences the measures of sensitivity and specificity calculated from the latent class models. This imbalance between classes (prevalence of diagnosis) has been reported as one of the limitations of this type of analysis (Swanson, Lindenberg, Bauer, & Crosby, 2012).
In addition, the children included in this study fell on a narrow clinical spectrum, characterized by mild malnutrition. The literature also highlights that measures of diagnostic accuracy may be influenced by the clinical spectrum of the phenomenon under study. Thus, the diagnosis imbalanced nutrition: less than body requirements may exhibit other relevant clinical indicators among children with more severe levels of malnutrition. However, the validated indicators may assist nurses in identifying nutritional imbalance in the early stages.
Acknowledgments
Funding: National Council for Scientific and Technological Development–CNPQ.
References
Almeida, M. A., Aliti, G. B., Franzen, E., Thomé, E. G. R., Unicovsky, M. R., Rabelo, E. R., et al. (2008). Prevalent nursing diagnoses and interventions in the hospitalized elder care.Latin-American Journal of N u r s i n g, 16, 707–711, h t t p : / / d x . d o i . o r g/ 1 0 . 1 5 9 0 / S 0 1 0 4 -11692008000400009.
Barbosa, L. C., Martins, M. C., Silva, V. A. G., & Carvalho, Q. C. M. (2005). Pain in undenourished children: The mother's perception. Latin-American Journal of Nursing,13, 596–598,http://dx.doi.org/10.1590/ S0104-11692005000400020.
Biscegli, T. S., Romera, J., Candido, A. B., Santos, J. M., Candido, E. C. A., & Binotto, A. L. (2009). Estado nutricional e prevalência de enteroparasitoses em crianças matriculadas em creche. Revista Paulista de Pediatria,27, 289–295, http://dx.doi.org/10.1590/S0103-05822009000300009.
Blössner, M., & De Onis, M. (2005).Malnutrition: Quantifying the health impact at national and local levels.Geneva: World Health Organization (WHO Environmental Burden of Disease Series, No. 12).
Brundtland, G. H. (2000). Nutrition and infection: Malnutrition and mortality in public health.Nutrition Reviews,58, S1–S4,http://dx.doi. org/10.1111/j.1753-4887.2000.tb07797.x.
Castro, T. G., Novaes, J. F., Silva, M. R., Costa, N. M. B., Franceschini, S. C. C., Tinôco, A. L. A., et al. (2005). Caracterização do consumo alimentar, ambiente socioeconômico e estado nutricional de pré-escolares de creches municipais.Revista de Nutrição, 18, 321–330, http://dx.doi.org/10.1590/S1415-52732005000300004.
Collins, L. M., & Lanza, S. T. (2010).Latent class and latent transition analysis: With applications in the social behavioral, and health sciences.Hoboken: Wiley.
Costa Junior, A. L., & Zannon, C. M. L. C. (1997). Desnutrição e desenvolvimento comportamental: Questões metodológicas.Estudos de Psicologia, 2, 263–276, http://dx.doi.org/10.1590/S1413-294X1997000200003.
Coutinho, J. G., Gentil, P. C., & Toral, N. (2008). A desnutrição e obesidade no Brasil: O enfrentamento com base na agenda única de nutrição.
Cadernos de Saúde Pública,24, 332–340,http://dx.doi.org/10.1590/ S0102-311X2008001400018.
Elia, M., Russell, C. A., & Stratton, R. J. (2010). The skeleton in the closet: Malnutrition in the community Malnutrition in the UK: Policies to address the problem. Proceedings of the Nutrition Society, 69, 470–476,http://dx.doi.org/10.1017/S0029665110001746.
Frota, M. A., Mota, R. M. A., Albuquerque, C. M., Silveira, V. G., & Oliveira, I. C. L. (2011). Crianças desnutridas: Percepção da família quanto ao cuidado.Ciência, Cuidado e Saúde,10, 233–239,http://dx. doi.org/10.4025/cienccuidsaude.v10i2.10007.
Frota, M. A., Pasco, E. M. G., Bezerra, M. D. M., & Martins, M. C. (2009). Má alimentação: Fator que influencia na aprendizagem de crianças de uma escola pública.Revista de APS,12, 278–284.
Herdman, T. H., & Kamitsuru, S. (Eds.). (2014).NANDA International Nursing Diagnoses: Definitions & classification 2015–2017. Oxford:
Wiley-Blackwell.
Knudsen, J. B. (Ed.). (2012).Malnutrition: Risk factors, health effects and prevention (Nutrition and Diet Research Progress). Hauppauge: Nova Science Publishers.
Lamb, C. A., Parr, J., Lamb, E. I. M., & Warren, M. D. (2009). Adult malnutrition screening, prevalence and management in a United Kingdom hospital: Cross-sectional study.British Journal of Nutrition,
102, 571–575,http://dx.doi.org/10.1017/S0007114509236038. Lima, M. C., Motta, M. E. F. A., Santos, E. C., & Silva, G. A. P. (2004).
Determinants of impaired growth among hospitalized children: A case– control study.São Paulo Medical Journal,122, 117–123,http://dx.doi. org/10.1590/S1516-31802004000300008.
Lopes, M. V. O., Silva, V. M., & Araújo, T. L. (2012). Methods for establishing the accuracy of clinical indicators in predicting nursing diagnoses.International Journal of Nursing Knowledge,23, 134–139, http://dx.doi.org/10.1111/j.2047-3095.2012.01213.x.
Lucena, A., de, F., Santos, C. T., Pereira, A. G. S., Almeida, M. A., Dias, V. L. M., et al. (2011). Clinical profile and nursing diagnosis of patients at risk of pressure ulcer. Latin-American Journal of Nursing, 19, 523–530,http://dx.doi.org/10.1590/S0104-11692011000300011. Mink, M., Evans, A., Moore, C. G., Calderon, K. S., & Deger, S. (2010).
Nutritional imbalance endorsed by televised food advertisements.
Journal of the American Dietetic Association,110, 904–910, http:// dx.doi.org/10.1016/j.jada.2010.03.020.
Moreira, M. E. L., & Goldani, M. Z. (2010). A criança é o pai do homem: Novos desafios para a área de saúde da criança. Ciência & Saúde Coleti va, 15, 321–327, ht tp://dx.doi.org/10.1590/S1413-81232010000200002.
Nichols, B. L. (2014). Malnutrition in developing countries: Clinical assessment. Retrieved August 21, 2014 fromhttp://www.uptodate.com/ contents/malnutrition-in-children-in-developing-countries-clinical-assessment
Perosa, G. B., Carvalhaes, M. A. B. L., Benicio, M. H. D. A., & Silveira, F. C. P. (2011). Estratégias alimentares de mães de crianças desnutridas e eutróficas: Estudo qualitativo mediante observação gravada em vídeo.
Ciência & Saúde Coletiva,16, 4455–4464,http://dx.doi.org/10.1590/ S1413-81232011001200018.
Qu, Y., Tang, M., & Kutner, M. H. (1996). effects models in latent class analysis for evaluation accuracy of diagnostic tests. Biometrics, 52, 797–810,http://dx.doi.org/10.2307/2533043.
Renner, F., Gottfried, J. A., Rossato, D. D., Gressler, M. A., Rosso, R., Corbellini, R., et al. (2013).Caso extremo de desnutrição kwashiorkor marasmática em Moçambique.Boletim Científico de Pediatria,2, 54–68.
Rocha, L. A., Maia, T. F., & Silva, L. F. (2006). Diagnósticos de enfermagem em pacientes submetidos à cirurgia cardíaca. Revista Brasileira de Enfermagem, 59, 321–326, http://dx.doi.org/10.1590/ S0034-71672006000300013.
Soares, L. R., Pereira, M. L. C., Mota, M. A., Jacob, T. A., Silva, V. Y. N. E., & Kashiwabara, T. G. B. (2013). The transition from malnutrition for obesity.Brazilian Journal of Surgery and Clinical Research,5, 64–68.
Swanson, S. A., Lindenberg, K., Bauer, S., & Crosby, R. D. (2012). A Monte Carlo investigation of factors influencing latente class
analysis: An application to eating disorder research. International Journal of Eating Disorders,45, 677–684,http://dx.doi.org/10.1002/ eat.20958.
Viana, V., & Sinde, S. (2008).O comportamento alimentar em crianças: Estudo de validação de um questionário numa amostra portuguesa (CEBQ).Análise Psicológica,26, 111–120.
World Health Organization (2014). Nutrition: Challenges. Retrieved August 13, 2014 fromhttp://www.who.int/nutrition/challenges/en/ Zhou, X., Obuchowski, N. A., & McClish, D. K. (2012).Statistical methods