Original Article
Artigo Original
Correspondence address: Leonardo Wanderley Lopes Departamento de Fonoaudiologia, Centro de Ciências da Saúde, Cidade Universitária – Campus I, Castelo Branco, João Pessoa (PB), Brazil, CEP: 58051-900.
E-mail: [email protected]
Received: 10/01/2013
Study carried out at Department of Speech and Hearing Therapy, Universidade Federal da Paraíba – UFPB – João Pessoa (PB), Brazil.
(1) Department of Speech and Hearing Therapy, Universidade Federal da Paraíba – UFPB – João Pessoa (PB), Brazil. (2) Graduate course of Speech and Hearing Therapy, Universidade Federal da Paraíba – UFPB – João Pessoa (PB), Brazil.
Conlict of interests: nothing to declare. Leonardo Wanderley Lopes1
Débora Pontes Cavalcante2
Priscila Oliveira da Costa1
Descritores
Voz Disfonia Percepção Auditiva Acústica Avaliação
Keywords
Voice Dysphonia Auditory Perception Acoustics Evaluation
Severity of voice disorders: integration of perceptual
and acoustic data in dysphonic patients
Intensidade do desvio vocal: integração de dados
perceptivo-auditivos e acústicos em pacientes disfônicos
ABSTRACT
Purpose: To analyze the correlation between acoustic measures and intensity of vocal deviation, and its discriminatory power in detecting the presence of vocal change, classifying the severity of the deviation and differencing the type of predominant voice. Methods: The sample comprised 186 patients with dysphonia. The vocal deviation from the vowel /ε/ was evaluated by consensus between three speech language pathologists, using a Visual Analog Scale. We extracted the mean and standard deviation (SD) of the fundamental frequency (F0), jitter, shimmer, and Glottal-to-Noise Excitation Ratio (GNE). Results: Mean F0 was negatively correlated with the degree of roughness and positively with the degree of tension. The F0 SD was positively correlated with the overall, roughness, tension, and instability grades. The jitter and shimmer were positively correlated with all perceptual parameters. Only the GNE distinguished between healthy and dysphonic voices and rated the degree of breathiness. The shimmer separated rough voices from not rough voices. The mean F0 was helpful to determine the degree of phonatory tension and to separate rough voices from breathy and strained voices. Conclusion: There is a correlation between the acoustic and auditory perceptual measures. The shimmer, the GNE, and F0 SD can be used to detect roughness, breathing, and strain, respectively. The GNE and mean F0 are useful to classify the degree of breathiness and strain, respectively. The mean F0 distinguished between rough, breathy, and strained voices, with rough voices more severe compared to the other two.
RESUMO
INTRODUCTION
Voice is multidimensional(1) and its production is related to anatomic, physiological, emotional, organic, environmental, and behavioral features. Voice evaluation, therefore, must be based on these principles, with mapping of voice production and correlation with such features for one to take a truly com-prehensive view of dysphonia.
The purpose of voice evaluation is to analyze voice quality, that is, whether the voice is healthy or not; to diagnose voice disorders, to monitor any disease or function progression, to evaluate prognosis, and to identify possible risks to develop a disorder(2).
Overall, studies on voice evaluation and diagnosis have attempted to answer three essential clinical questions(2): what is the measure to determine presence/absence of any voice disorder (diagnosis)? Is there evidence that the test used in evaluation can determine the nature (etiology) of a voice dis-order? What is the measure capacity to determine the severity of a voice disorder?
In a study(3) conducted with experienced speech language pathologists in the United States, all the 53 interviewees re-ported using auditoryperceptual measurements in voice evalu-ation followed by analysis of body posture and movements, and by dynamic voice evaluation. These subjective methods were substantially more used than objective evaluations by acoustic measurements only.
However, in a systematic review, most studies (60%) on voice evaluation in patients with voice disorders used acoustic measurements and focused on presence/absence of a disorder (78%). Few articles (18%) have investigated the ability of a measurement to measure the severity of voice disorder(2). Also, most studies have used an image of larynx as reference to deine the presence of a voice disorder.
Therefore, one may infer that, irst, one of the main appli-cations of an evaluation measure is to judge the effectiveness of a treatment made available, which may include absence of a disease that has been previously diagnosed and reduction of severity level. Second, facing the variety of etiologic factors and manifestations of a voice disorder, the larynx image may not always be used as reference for the presence/absence of voice disorders, eitherin initial diagnosis or pre- and post-intervention evaluations, once voice disorders are also characterized by different adjustments of the vocal tract that cannot be seen at laryngoscopy.
Auditory-perceptual evaluation is known to pres-ent a considerable dificulty level, once the judgmpres-ent of parameters depends on many subjective factors, such as personal references of the evaluator, scale used and respec-tive sensibility and speciicity, attention, and fatigue of the listener(1,4,5). However, this is the most widely used tool in voice quality assessments.
Considering the need for further studies investigating the capacity of acoustic measurements to determine the severity of voice disorder, and the lack of studies taking auditory–percep-tual analysis as reference for the presence or absence of a voice disorder(2,4-6), the aim of this study was to assess the correlation
between acoustic measurements and vocal disorder, as well as the discriminatory power of measurements in the detection of voice changes, severity of disorder, and differentiation of predominant voice type.
METHODS Study design
This is a quantitative, explanatory, cross-sectional ield study approved by the research ethics committee of the Center for Health Sciences of Universidade Federal da Paraíba (UFPB), protocol no. 52492/12. All participants signed the informed consent form to authorize the use of their data.
Sample
The sample was composed of 186 patients with dyspho-nia of both genders, aging 19–60 years (116 women and 70 men), assisted in the Voice Laboratory of Department of Speech and Hearing Therapy of UFPB from August 2012 and March 2013.
Patients more than 18 years and less than 65 years of age, with voice complaints and who had been through evaluation of larynx and had a report with diagnosis, were recruited to participate in the sample. Patients with cognitive or neurologic disorders that could impair recordings were excluded. The study group had patients with normal larynx, benign lesions of the vocal folds (nodules, cysts, polyps), primary muscle tension dysphonia, and unilateral vocal fold paralysis.
Material
An HP laptop was used to record voices, along with a Logitech headset microphone and the software FonoView 4.6h (CTS Informática). Sampling rate was 44.100 Hz.
Procedures
Data were collected in a silent room, with environmental noises below 50 dBNPS, measured with a digital sound pres-sure level indicator. The microphone was placed at a distance of 10 cm from patients’ lips.
Audio recordings were made upon patients’ irst evaluation, before voice therapy, in 5-minute-long sessions where they were asked to sustain the vowel sound /ε/ for as long as possible, at
maximum phonation time.
Afterwards, the voice samples were edited using the software Sound Forge 10.0 for initial and final seconds of sound emissions to be deleted, thereby preserving a minimum of 3 seconds of each recording. Normalization was made by the feature “normalize” in the software Sound Forge, peak level mode, aiming at standardization of audios at -6 and 6 dB.
deviation, hoarseness level (HL), breathiness level (AL), strain level (SL), and instability level (IL): closest to 0, small deviation changes; closest to 100, large deviations. This assessment was consensual and made by three voice specialists.
Voice analyses were carried out in a silent room. Evaluators were irst oriented to consider voices healthy when they were socially acceptable, produced naturally, without effort or noises, in stable condition at sound emission. They were also instructed to make a correlation between hoarseness and presence of vi-bration irregularity, brethiness and audible air escape, muscle tension and perception of voice strain, instability and pres-ence of voice quality, frequency, and/or intensity luctuation. They were previously trained with anchor stimuli of adequate sound production and vocalizations with different levels of deviation, as well as predominantly hoarse, breathy, strained, and unstable voices.
Each vocalization was presented three times in a sound box at a comfortable intensity for evaluators. Then, they identiied presence or absence of voice deviations, predominant type of deviated voice (hoarse, breathy, strained, or unstable), and deviation level.
In the end of auditory-perceptual analysis, 10% of voice samples were randomly repeated to assess consensual evalu-ation by Cohen’s Kappa coeficient. Kappa value was 0.80, indicating agreement between evaluators. Intra-evaluator Kappa value was 0.79, which also indicated agreement.
Afterwards, the numerical scale was compared to the VAS, where level 1 (0–35.5 mm) was related to normal variations in voice quality, level 2 (35.6–50.5 mm) mild-to-moderate devia-tion, level 3 (50.6–90.5 mm) moderate deviadevia-tion, and level 4 (90.6–100 mm) severe deviation(7).
Acoustic measurements were made in the software VoxMetria, 4.7h (CTS Informática) voice quality measure-ment mode. Mean and SD at fundameasure-mental frequency (F0), jitter, shimmer, and Glottal-to-Noise Excitation Ratio (GNE) of the sustained vowel were used in the evaluation.
Reference values in the software for F0, jitter, shimmer, and GNE SD were 0.2 Hz, 0.6, 6.5, and 0.5%, respectively. As to F0, jitter, and shimmerSD, values above the aforementioned are considered an alteration. Conversely, for GNE, the values below 0.5 are considered an alteration.
Data analysis
Descriptive statistical analysis was carried out for all variables analyzed, as well as correlation inference analysis with Spearman’s test to identify the severity of voice de-viation (dede-viation, mild, moderate, and severe) and acoustic measurements.
Correlation coeficients are used to assess and quantify the linear relationship between two variables, that is, if variables change in conjunction and to which level. Correlation coef-icient varies from -1 to 1, where negative values indicate that variables change in inverse proportion whereas positive ones indicate change in the same proportion.
Values of 0.1–0.3 were considered to represent weak correlation in this study; values between 0.4 and 0.6 were considered moderate; values above 0.7 can be considered as strong correlation(8).
Analysis of variance test was used to compare acoustic measurements according to the level of vocal deviation and predominant type of voice by post hoc analysis, using Scheffé test.
To categorize acoustic measures according to its discrimi-natory power compared to the presence or absence of vocal deviation, measures with mean value between adequate (level 1) and deviated (levels 2, 3 and 4).
Vocal deviation severity was classiied according to acoustic measures with mean values presenting differences between levels 1 and 2, levels 2 and 3, and levels 3 and 4.
All analyses were made using the software Statistical Package for the Social Sciences (SPSS) 2.0, with signiicance level set at 0.05.
RESULTS
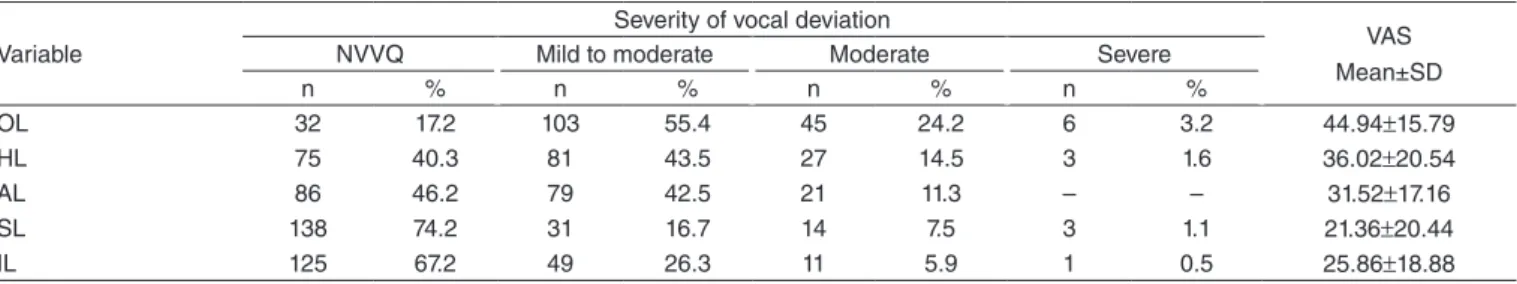
Prevalence of healthy voices was 17.2% (n=32), as 55.4% (n=103) presented mild deviation, 24.2% (n=45) moderate deviation, and 24.2% (n=45) severe deviation (Table 1).
Regarding predominant voice type, hoarseness (51.3%, n=80) was the most common pattern in patients with voice deviation, followed by air escape (28.8%, n=45), strain (12.8%, n=20), and instability (7.1%, n=11) levels (Table 2).
Mean F0 was negatively associated with HL (p=0.019) and positively related to SL (p=0.03) (Table 3). F0 SD, however, was positively associated with OL (p<0.001), HL (p<0.001), and IL (p<0.001) (Table 3).
Jitter was positively related to OL (p<0.001), HL (p<0.001), AL (p<0.001), SL (p<0.001), and IL (p<0.001). Shimmer pre-sented the same correlation to OL (p<0.001), HL (p<0.001), AL (p=0.027), SL (p<0.001), and IL (p<0.001) (Table 3).
GNE was negatively related to OL (p<0.001), HL (p<0.001), AL (p<0.001), and IL (p<0.001) (Table 3).
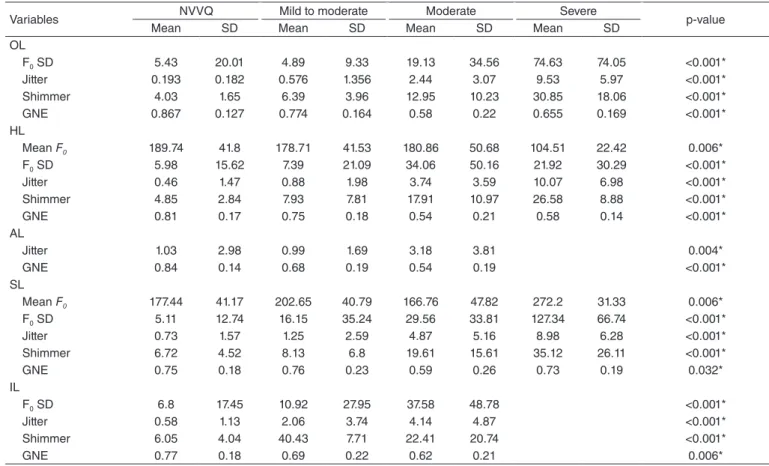
Comparison between groups related to OL of voice deviation presented differences for F0 SD (p<0.001), jitter(p<0.001), shim-mer(p<0.001), and GNE(p<0.001) (Table 4). However, in post hoc analysis only GNE could distinguish adequate voices (level 1) and deviated voices: levels 2 (p=0.090), 3 (p<0.001), and 4 (p=0.062).
Regarding voice hoarseness, all parameters were shown different (Table 4). In post hoc analysis, shimmer was the only measure that could distinguish hoarse voices, that is, distinguish level 1 from levels 2 (p<0.05), 3 (p<0.001), and 4 (p<0.001).
Comparison between groups showed that air escape param-eter differed from mean values for jitter (p=0.004) and GNE (p<0.001) (Table 4).
Comparison between groups showed differences between strain patterns and mean F0 (p=0.006), F0 SD (p<0.001), jitter (p<0.001), shimmer (p<0.001), and GNE(p=0.032) (Table 4). Mean F0 was shown reliable to determine phonatory SL in post hoc analysis, distinguishing voices without strain features (level 1) from mildly deviated voices (p=0.039), mildly devi-ated voices from moderately devidevi-ated voices (p=0.008), and moderately voices from severely deviated voices (p=0.002). F0 SD was able to distinguish adequate voices from voices with strain levels 2 (p=0.009), 3 (p=0.002), and 4 (p<0.001).
Comparison of instability levels showed differences between mean values for F0 SD (p<0.001), jitter(p<0.001), shimmer (p<0.001), and GNE(p=0.006) (Table 4). However, in post hoc analysis, none of the measurements met the cri-teria established as reliable for diagnosis and monitoring of voice changes.
Comparing groups according to predominant voice type among deviated voices, mean F0 (p<0.001) and GNE (p=0.039) values were found to be different (Table 5). In post hoc analysis,
mean F0 value was able to distinguish hoarse and breathy voices (p<0.001), with higher values for breathy voices. Differences were also found between hoarse and strained voices (p=0.002), with higher values for strained voices.
DISCUSSION
Association of auditory–perceptual and acoustic evaluations is of utmost importance to identify voice quality, voice devia-tion levels, and treatment or surgical results(9).
Acoustic measurements are able to determine changes in voice quality, as a relation between laryngeal abnormalities and severity of voice disorders is expected(6).
In this context, this study was aimed at analyzing the cor-relation between acoustic measurements and severity of voice disorders, and at identifying the discriminatory power of such measures to detect presence of vocal deviations, to classify the severity of disorder, and to distinguish predominant voice types.
There was a weak correlation between mean F0 and audito-ry-perceptual data, which show patients with higher HLs have low voices, whereas those with higher phonatory tension levels also have higher voices.
The negative correlation between mean F0 and hoarseness may be justiied by the direct relation between presence of hoarse and vocal fold vibration irregularity, which may result from small edemas, vasodilation, fatigue, voice misuse, and abuse(10). Therefore, nodules, polyps, and edemas, which cause increase in mass of the vocal folds and vibratory irregularity, may decrease fundamental frequency, thus making voice pitch lower(11,12).
Variable
Severity of vocal deviation
VAS Mean±SD
NVVQ Mild to moderate Moderate Severe
n % n % n % n %
OL 32 17.2 103 55.4 45 24.2 6 3.2 44.94±15.79
HL 75 40.3 81 43.5 27 14.5 3 1.6 36.02±20.54
AL 86 46.2 79 42.5 21 11.3 – – 31.52±17.16
SL 138 74.2 31 16.7 14 7.5 3 1.1 21.36±20.44
IL 125 67.2 49 26.3 11 5.9 1 0.5 25.86±18.88
Table 1. Distribution of voice parameters according to overall, hoarseness, air escape, strain, and instability levels
Caption: NVVQ = normal variability of voice quality; VAS = Visual Analog Scale; OL = overall level; HL = hoarseness level; AL = air escape level; SL = strain level; IL = instability level; SD = standard deviation
Table 2. Description of predominant voice types in patients with vocal deviation
Voice type n %
Hoarse 80 51.3
Breathy 45 28.8
Strained 20 12.8
Unstable 11 7.1
Total 156 100
Variables
Severity of voice deviation
OL HL AL SL IL
Correlation p-value Correlation p-value Correlation p-value Correlation p-value Correlation p-value
Mean F0 0.67 0.37 -0.17 0.019* 0.06 0.46 0.16 0.03* 0.03 0.71
F0 SD 0.48 <0.001* 0.31 <0.001* -0.01 0.86 0.49 <0.001* 0.37 <0.001*
Jitter 0.66 <0.001* 0.53 <0.001* 0.18 0.014* 0.47 <0.001* 0.46 <0.001*
Shimmer 0.68 <0.001* 0.56 <0.001* 0.16 0.027* 0.49 <0.001* 0.55 <0.001*
GNE -0.44 <0.001* -0.39 <0.001* -0.55 <0.001* -0.08 0.261 -0.19 0.01*
Table 3. Correlation of voice deviation and acoustic parameters
*Significant values (p≤0.05) – Spearman’s correlation test
In the correlation found between mean F0 and phonatory tension, it is important to note that frequency is determined by vocal fold tension, among other factors, which is con-trolled by laryngeal muscles, namely cricothyroid muscle(13). Patients presenting phonatory tension, therefore, usually have contraction of extrinsic and intrinsic muscles, with more longitudinal tension in the vocal folds, subglottic pressure, and vocal tract tightening, causing an increase in glottic cycles per second and, consequently, increase in fundamental frequency(14).
Although in literature(15) OL and HL are the parameters mostly related to F0, in our study phonatory tension and hoarseness were more related to F0. Similar indings have been reported in studies(16,17) conducted with children, being phona-tory tension, OL, and HL mostly related to F0.
In our study, F0 SD presented slight positive relation to OL of voice deviation and phonatory tension level, as well as a weak positive correlation to hoarseness and instability levels. Voices presenting the more severe deviations and higher hoarseness, strain, and instability levels also presented higher F0 SD values.
Considering physiology, F0 SD is directly related to the vocal fold neuromuscular conditions and vibration regularity. Acoustic and perceptual features are directly related to the timekeeping of sound emissions. Therefore, as vocal fold histological changes interfere with glottic vibration patterns, especially mucosal wave, causing a deviation in vocal production, correlation between perceptual features and F0 SD can be justiied
(11,15).
Jitter and shimmer values were positively related to all auditory-perceptual features, with higher values in voices for severe deviations.
Variables Hoarseness Air escape Strain Instability p-value
Mean SD Mean SD Mean SD Mean SD
Mean F0 166.13 43.66 198.48 36.43 200.09 41.95 187.17 40.4 <0.001*
GNE 0.73 0.19 0.69 0.2 0.81 0.19 0.81 0.15 0.039*
Table 5. Comparison of acoustic measurements with predominant voice type
*Significant values (p≤0.05) – ANOVA
Caption: SD= standard deviation; F0 = fundamental frequency; GNE = Glottal-to-Noise Excitation Ratio
Variables NVVQ Mild to moderate Moderate Severe p-value
Mean SD Mean SD Mean SD Mean SD
OL
F0 SD 5.43 20.01 4.89 9.33 19.13 34.56 74.63 74.05 <0.001*
Jitter 0.193 0.182 0.576 1.356 2.44 3.07 9.53 5.97 <0.001*
Shimmer 4.03 1.65 6.39 3.96 12.95 10.23 30.85 18.06 <0.001*
GNE 0.867 0.127 0.774 0.164 0.58 0.22 0.655 0.169 <0.001*
HL
Mean F0 189.74 41.8 178.71 41.53 180.86 50.68 104.51 22.42 0.006*
F0 SD 5.98 15.62 7.39 21.09 34.06 50.16 21.92 30.29 <0.001*
Jitter 0.46 1.47 0.88 1.98 3.74 3.59 10.07 6.98 <0.001*
Shimmer 4.85 2.84 7.93 7.81 17.91 10.97 26.58 8.88 <0.001*
GNE 0.81 0.17 0.75 0.18 0.54 0.21 0.58 0.14 <0.001*
AL
Jitter 1.03 2.98 0.99 1.69 3.18 3.81 0.004*
GNE 0.84 0.14 0.68 0.19 0.54 0.19 <0.001*
SL
Mean F0 177.44 41.17 202.65 40.79 166.76 47.82 272.2 31.33 0.006*
F0 SD 5.11 12.74 16.15 35.24 29.56 33.81 127.34 66.74 <0.001*
Jitter 0.73 1.57 1.25 2.59 4.87 5.16 8.98 6.28 <0.001*
Shimmer 6.72 4.52 8.13 6.8 19.61 15.61 35.12 26.11 <0.001*
GNE 0.75 0.18 0.76 0.23 0.59 0.26 0.73 0.19 0.032*
IL
F0 SD 6.8 17.45 10.92 27.95 37.58 48.78 <0.001*
Jitter 0.58 1.13 2.06 3.74 4.14 4.87 <0.001*
Shimmer 6.05 4.04 40.43 7.71 22.41 20.74 <0.001*
GNE 0.77 0.18 0.69 0.22 0.62 0.21 0.006*
Table 4. Comparison of acoustic measurements with severity of voice deviation
*Significant values (p≤0.05) – ANOVA
Studies have reported(18,19) that jitter relects OL of voice deviation, a sensible measure to detect voice quality deviation, which justiies higher values in most deviated voices consider-ing all perceptual features.
Studies(6,20-22) combining the number of acoustic features and data from laryngeal examinations suggested that jitter and shimmer can be strong predictors of voice disorders, being able to detect mild changes that would normally go unnoticed in perceptual analysis.
Studies(18,19) have compared patients before and after voice therapy and reported a moderate correlation between acoustic features (jitter, shimmer, and harmony-noise ratio) and percep-tual analysis. The strongest correlation was found between OL and jitter and shimmer.
In our study, F0 mean and SD values, jitter, shimmer, and GNE were different as to voice deviation levels. However, in post hoc analysis and considering criteria established to deine a measurement as reliable to categorize healthy or deviated voices and deviation levels, GNE was the only measure able to distinguish healthy and deviated voices. No measure could classify voice deviation severity.
HL was shown different for mean values of all acoustic measurements. Only shimmer was reliable to distinguish hoarse voices. No measure was reliable to classify severity of hoarse-ness at voice production.
In general, jitter and shimmer are used to describe hoarse-ness found at perceptual evaluation and vibratory irregularity to the physiological extent, whereas noise measurements are used as indicators of air escape and inadequate glottal closure(6,18,23-27). A study reported auditory parameters for hoarseness to be related to shimmer(28).
Considering air escape at voice production, although mean jitter and GNE values were different, post hoc analysis proved GNE reliable to classify the intensity of air escape and distin-guish breathy voices from healthy voices, according to criteria established in our study.
GNE measures additional noises at sound production, re-gardless of noises caused by glottal mechanism. It indicates the origin of voice production, coming from vocal fold vibration or air low in the vocal tract. It can show different values in different phonatory adjustments, different voice deviations(23). GNE may be considered a more reliable measurement because, unlike jitter and shimmer, it does not require previous estimates of fundamental frequency, which is very dificult in cases of severe laryngeal and voice deviations(23–25).
Literature(23) mentions to use of noise measurements in voice assessment and triage once they have good relation to perceptual analysis, as found in our study. Studies(23,26) combining different acoustic parameters to describe deviated voices have shown GNE is the most reliable measurement in independent analyses, for it allows one to distinguish normal and deviated voices.
GNE is directly related to hoarseness and air escape at voice production, two of the most reliable parameters for perceptual evaluation. Therefore, based on our indings, we can say that GNE is reliable to diagnose voice changes, to detect and clas-sify air escape at voice production.
Phonatory tension parameter presented differences in mean values of all acoustic measurements. In post hoc analysis, and considering previously established criteria, mean F0 was reli-able to determine intensity of voice strain, whereas F0 SD could distinguish normal voices from strained voices.
Increase in muscle tension can cause unbalance in the system and, as a consequence, dificulty in voice production control, which causes fundamental frequency to oscillate and increases F0 SD values.
A study(29) using excised larynges investigated changes in subglottic pressure by comparing nonlinear dynamics with disturbance measurements. A signiicant increase in subglottic pressure caused irregularities in vibration, bifurcation, hoarse-ness, and inadequate voice effort. Thus, excessive phonatory tension with increase in subglottic pressure or vocal tract tightening can also result in vibration irregularity, relected in F0 SD values.
As to phonatory instability, F0 mean and SD,jitter, shim-mer, and GNE differed. However, in post hoc analysis, these measurements did not meet criteria of voice deviation presence and classiication.
Finally, comparing acoustic measurements with predomi-nant voice type in cases of vocal deviation, hoarse voices dif-fered from breathy and strained voices in F0 values, as hoarse voices had lower pitches compared to the others. This can be justiied by the following: increase in intrinsic and extrinsic muscles tightening in strained voices, causing rigidity in the whole system, increasing pressure, and decreasing contact on vocal folds, resulting in a smaller portion of the organ vibrating in cases of underlying glottic closure in breathy voices, both causing voice to be higher. However, hoarseness is directly related to presence of lesion on the vocal fold free edge, caus-ing voice to be lower(12).
The biggest challenge in clinical practice and research is to understand which tool is the best to assess and correlate acoustic measurements to the perceptual and physiological extents(23,26). Based on our indings, we can say that there is a correlation between acoustic and auditory-perceptual measurements in quantiication of voice deviations. Considering reliability of acoustic parameters to determine presence or absence of voice changes, GNE was reliable to identify normal and altered voices and to distinguish breathy and non-breathy voices, whereas shimmer identiied presence or absence of hoarseness, and F0 SD was able to identify strained voices.
Regarding effectiveness of acoustic measurements to pre-dict voice deviation severity, GNE was able to identify ALs, whereas mean F0 was able to measure phonatory tension levels.
Overall, measurements that classify voices as healthy or altered, especially as to OL such as GNE, can be used in procedures for triage and diagnosis of voice disorders, while measurements able to identify the severity of disorder can be reliable for voice monitoring during voice therapy.
CONCLUSION
deviated voices, and to identify and classify AL. Shimmer may be used to diagnose presence of voice hoarseness. Mean F0 is reliable to classify the intensity of phonatory tension, whereas F0 SD can be used to diagnose voice strain at vocalization. Mean F0 was able to distinguish hoarse, breathy, and strained voices, and hoarseness was considered the most severe com-pared to the others.
*LWL, DPC, and POC were in charge of the study design and development. LWL was responsible for data collection, result analysis, and paper inal review. DPC was responsible for data collection and result analysis; POC was in charge of data tabulation, statistical analysis, and paper review.
REFERENCES
1. Dejonckere PH, Bradley P, Clemente P, Cornut G, Crevier-Buchman L, Friedrich G, et al. A basic protocol for functional assessment of voice pathology, especially for investigating the eficacy of (phonosurgical) treatments and evaluating nem assessment techniques. Eur Arch Otorhinolaryngol. 2001;258(2):77-82.
2. Roy N, Barkmeier-Kraemer J, Eadie T, Sivasankar MP, Mehta D, Paul D, et al. Evidence-based clinical voice assessment: a systematic review. American Journal of Speech-Language Pathology [cited 2013 Set 13]. Available from: http://ajslp.asha.org/papbyrecent.dtl
3. Behrman A. Common practices of voice therapists in the assessment of patients. J Voice. 2005;19(3):454-69.
4. Maryn Y, Roy N, De Bodt M, Cauwenberge PV, Corthals P. Acoustic measurement of overall voice quality: a meta-analysis. J Acoust Soc Am. 2009;126(5):2619-34.
5. Martens JW, Versnel H, Dejonckere PH. The effect of visible speech in the perceptual rating of pathological voices. Arch Otolaryngol Head Neck Surg. 2007;133(2):178-85.
6. Brockmann M, Drinnan MJ, Storck C, Carding P. Reliable jitter and shimmer measurements in voice clinics: the relevance of vowel, gender, vocal intensity, and fundamental frequency effects in a typical clinical task. J Voice. 2011;25(1):44-53.
7. Yamasaki R, Leão S, Madazio G, Padovani M, Azevedo R, Behlau M. Correspondência entre escala analógico visual e a escala numérica na avaliação perceptivo-auditiva de vozes. In: 16º Congresso Brasileiro de Fonoaudiologia; 2008 Set. 24-27; Campos do Jordão: Sociedade Brasileira de Fonoaudiologia; 2008.
8. Dancey C, Reidy J. Estatística sem matemática para psicologia: usando SPSS para Windows. Porto Alegre: Artmed; 2006.
9. Uloza V, Verikas A, Bacauskiene M, Gelzinis A, Pribuisiene R, Kaseta M, et al. Categorizing normal and pathological voices: automated and perceptual categorization. J Voice. 2011;25(6):700-8.
10. McAllister A, Sederholm E, Sundberg J. Perceptual and acoustic analysis of vocal registers in 10-year-old children. Logoped Phoniatr Vocol. 2000;25(2):63-71.
11. Jotz GP, Cervantes O, Settani FAP, Angelis EC. Acoustic measures for the detection of hoarseness in children. Int Arch Otorhinolaryngol. 2006;10(1):14-20.
12. Pontes PAL, Vieira VP, Gonçalves MIR, Pontes AAL. Características das vozes roucas, ásperas e normais: análise acústica espectrográica comparativa. Rev Bras Otorrinolaringol. 2002;68(2):182-8.
13. Lind K, Wermke K. Development of the vocal fundamental frequency of spontaneous cries during the irst 3 months. Int J Pediatr Otorhinolaryngol. 2002;64(2):97-104.
14. Van Houte E, Van Lierde K, Claeys S. Pathophysiology and treatment of muscle tension dysphonia: a review of the current knowledge. J Voice. 2011;25(2):202-7.
15. McAllister A, Sederholm E, Ternström S, Sundberg J. Perturbation and hoarseness: a pliot study of six children’s voices. J Voice. 1996;10(3):252-61.
16. Lee EK, Son YI. Muscle tension dysphonia in children: voice characteristics and outcome of voice therapy. Int J Pediatr Otorhinolaryngol. 2005;69(7):911-7.
17. Lopes LW, Lima ILB, Almeida LNA, Cavalcante DP, Almeida AAF. Severity of voice disorders in children: correlations between perceptual and acoustic data. J Voice. 2012;26(6):819.e7-12.
18. Speyer R, Wieneke GH, Dejonckere PH. Documentation of progress in voice therapy: perceptual, acoustic, and laryngostroboscopic indings pretherapy and posttherapy. J Voice. 2004;18(3):325-40.
19. Ma EPM, Yu EML. Multiparametric evaluation of dysphonic severity. J Voice. 2005;20(3):380-90.
20. Zhang Y, Jiang JJ. Acoustic analysis of sustained and running voices from patients with laryngeal pathologies. J Voice. 2008;22(1):1-9.
21. Ortega J, Cassinello N, Dorcatto D, et al. Computerized acoustic voice analysis and subjective scaled evaluation of the voice can avoid the need for laryngoscopy after thyroid surgery. Surgery. 2009;145(3):265-71. 22. Gelzini A, Verikas A, Bacauskiene M. Automated speech analysis applied
to laryngeal disease categorization. Comput Methods Programs Biomed. 2008;91(1):36-47.
23. Godino-Llorente JI, Osma-Ruiz V, Sáenz-Lechón N, Vilda-Gómez P, Blanco-Velasco M, Cruz-Roldán F. The effectiveness of the glottal to noise excitation ratio for the screening of voice disorders. J Voice. 2010;24(1):47-56. 24. Madazio G, Leão S, Behlau M. The phonatory deviation diagram: a
novel objective measurement of vocal function. Folia Phoniatr Logop. 2011;63(6):305-11.
25. Fröhlich M, Michaelis D, Strube HW, Kruse E. Acoustic voice analysis by means of the hoarseness diagram. J Speech Lang Hear Res. 2000;43(3):706-20.
26. Michaelis D, Fröhlich M, Strube HV. Selection and combination of acoustic features for the description of pathologic voices. J Acoust Soc Am. 1998;103(3):1628-39.
27. Eadie TL, Baylor CR. The effect of perceptual training on inexperienced listeners’ judgments of dysphonic voice. J Voice. 2006;20(4):527-44. 28. Zraick RI, Wendel K, Smith-Olinde L. The effect of speaking task
on perceptual judgment of the severity of dysphonic voice. J Voice. 2005;19(4):574-81.