ISSN: 1809-4430 (on-line) www.engenhariaagricola.org.br
1 Universidade Federal de Lavras/ Lavras - MG, Brasil.
Received in: 8-25-2017
Doi:http://dx.doi.org/10.1590/1809-4430-Eng.Agric.v38n2p 173-179/2018
CLIMATE CHANGE AND RURAL WORKERS THERMAL COMFORT: HISTORICAL AND
FUTURE IMPACTS
André L. N. Amaro
1, Tadayuki Yanagi Junior
2*, Sílvia de N. M. Yanagi
1, Gabriel A. E S. Ferraz
1,
Alessandro T. Campos
12*Corresponding author. Universidade Federal de Lavras/ Lavras - MG, Brasil. E-mail: [email protected]
KEYWORDS
human
biometeorology,
human thermal
comfort, THI, time
series
ABSTRACT
The aim of the present research was to propose a bioclimatic mapping to classify the
thermal comfort and discomfort of rural workers within the state of Minas Gerais,
considering historical and future scenarios. Monthly historical series (1976-2014) of
minimum, mean and maximum temperature-humidity index (THI), determined through
the values of air temperature (minimum, mean and maximum) and relative humidity from
48 weather stations located in the state of Minas Gerais were used to analyze the trends
through Mann-Kendall and linear regression assays. The bioclimatic mapping of human
comfort, obtained via geostatistical analysis, was developed as a function of the minimum,
medium and maximum THI for the historical period (1976-2014) and future scenario
(2024). Results indicate an overall trend of increasing in thermal discomfort conditions
throughout the mesoregions of the state of Minas Gerais during the weather seasons,
being more incisive in summer and spring.
INTRODUCTION
Climate change can generate negative impacts on human beings, especially workers in some agribusiness activities that require higher metabolic activ ity. Impacts of the thermal environ ment on humans have been widely studied because of the harmfu l effects on performance and health (Ou et al., 2014) and, under extreme conditions, leading to death (Loughnan et al., 2010).
Under heat stress conditions, humans present changes in physiological parameters, such as increases in heart rate, body temperature, blood pressure, and sweat production (Shen & Zhu, 2015). Heat-related disorders such as sunstroke, cramps and exhaustion have also been reported (Zheng et al., 2012). Extreme conditions of cold stress also cause health problems (McMichael et al., 2006). Indexes of the thermal environ ment have been used to generate bioclimatic maps applied to the analysis of the effect of the external environ ment on humans (Park et al., 2014). A mong the various indexes, the temperature and humid ity index (THI) (Tho m, 1959) has been widely used
to classify the level of thermal comfort of humans, in view of the easy obtaining of meteorological data used as input into the equation.
In this context, the goal of the present study was to propose a bioclimatic zoning to classify the thermal comfo rt and discomfort of rural workers in the State of Minas Gerais, using the temperature and humidity index (THI), considering a historical period and a future scenario.
MATERIAL AND MET HODS
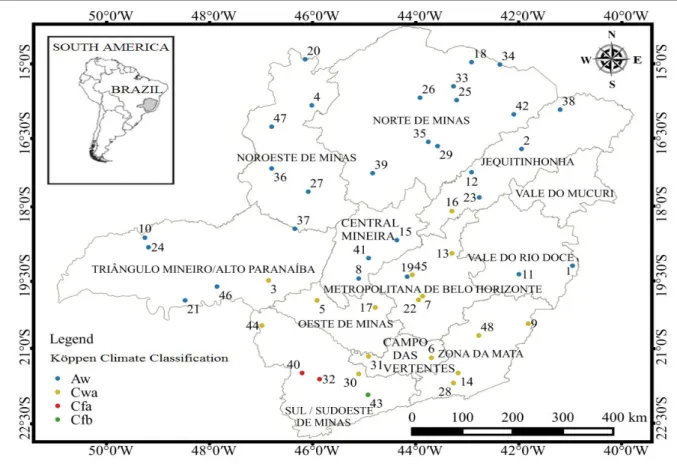
FIGURE 1. Location of the weather stations used in the present study.
The State of Minas Gerais has an area of approximately 7% of the Brazilian territory, with 582,586 km² and wide climatic variab ility (Tonietto et al., 2006). The average values of annual precipitation vary from 700 to 1,100 mm in the driest regions (north, northeast and east) and from 1,200 to 1,500 mm in the rain ier regions (South, Triângulo Mineiro, northwest and Serra do Espinhaço and Mantiqueira) (Mello & Viola, 2013). In the
lower regions of north and east of the State, the monthly average temperatures reach 27°C, while in the higher regions are observed temperatures around 13°C.
The weather stations used in this study are listed in Table 1, and the historical series of tdb,min, tdb,mean, tdb,max and RH were of 39 years, covering the period fro m 1976 to 2014.
TABLE 1. Conventional weather stations and their respective elevation.
N° Station Elev. (m) N° Station Elev. (m) N° Station Elev. (m)
1 Aimorés 83 17 Div inópolis 788.35 33 Mocambinho 452
2 Araçuaí 289 18 Espinosa 596.64 34 Monte Azul 625
3 Araxá 1.024 19 Florestal 749 35 Montes Claros 652
4 Arinos 519 20 Formoso 840 36 Paracatu 712
5 Bambuí 661 21 Frutal 544 37 Patos de Minas 940
6 Barbacena 1.126 22 Ibirité 815 38 Pedra Azu l 648.91
7 Belo Horizonte 915 23 Itamarandiba 1.097 39 Pirapora 505
8 Bo m Despacho 695 24 Ituiutaba 560 40 Poços de caldas 1.15
9 Caparaó 843 25 Janaúba 516 41 Pompéu 691
10 Capinópolis 620.6 26 Januária 474 42 Salinas 471
11 Caratinga 610 27 João Pinheiro 760.36 43 São Lourenço 953
12 Carbonita 736 28 Juiz de Fora 940 44 São S. do Paraiso 820
13 C do Mato Dentro 652 29 Juramento 648 45 Sete Lagoas 732
14 Coronel Pacheco 435 30 Lambari 878 46 Uberaba 737
15 Curvelo 672 31 Lavras 919 47 Unaí 460
16 Diamantina 1.296 32 Machado 873 48 Viçosa 712
THI was calculated through the (Equation 1) (Thom, 1958), based on tdb,min, tdb,mean, tdb,max (°C) and dew point temperature (tdp), that was determined by (Equation 2) (Vianello & Alves, 2012) as a function of the actual water vapor pressure (e, hPa).
(1)
where,
THI – temperature and humidity index (THI, dimensionless);
tdb – air dry-bulb temperature, °C; tdp – air dew-point temperature, °C,
(2) where,
e – actual water vapor pressure, hPa.
Historic al series trend analysis
The trends of the historical series of THImin, THImean, THImax over a period of 39 years, for each studied station, were verified using the non-parametric Mann-Kendall test (Mann, 1945; Mann-Kendall, 1975) proposed by Sneyers (1975), and the linear regression analysis, methodologies commonly used (Minuzzi, 2010, Ávila et al., 2014, Tian et al., 2016).
The non-parametric Mann-Kendall test considers that, since there is stability of the time series (Hypothesis H0), the succession of values occurs independently and the probability distribution remains unchanged (simp le random series).
A time series will p resent a tendency of increase or decrease of a certain variable if the value of the Mann-Kendall coefficient is positive (MK> 0) or negative (MK <0), respectively. For this purpose, the Z test should be applied at the 5% level of significance, wh ich provides Z0.975 = 1.96. It is rejected H0 if the Mann-Kendall test,
│MK│>Z1-α/2, is greater than 1.96, indicating a significant trend in the data time series (AVILA et al., 2014). The S statistic was determined by (Equation 3), where n is the number of observations, Xj and Xi are the sequential values of the data and sgn (ϕ) is the signal function. The signal function assumes a value of 1 if ϕ > 0; 0 if ϕ = 0; and -1 if ϕ < 0.
(3)
According to Kendall (1975), assuming the hypothesis that the data are identically distributed and independent, the average and the variance of the Z statistic are given by (Equations 4 and 5), respectively. The m is the number of associated classification groups, each one associated with a ti, wh ich corresponds to the THI values of the historical series of THImin, THImean and THIma x.
(4)
(5)
The value of Z can be calculated as follo ws:
The linear regression analysis was applied to obtain trends through the parametric significance t test over the
angular coefficient () (Longobardi & Villani, 2010). This test considered the linear regression between the random variable Y (THI series) and time (X). The trend for a period of 10 years (2024) was calcu lated using the
adjusted linear equations, multiplying β by 10.
Bioclimatic zoning
The bioclimatic zoning was carried out through the interval maps of THImin, THImean and THImax for the State of Minas Gerais, considering the historical period fro m 1976 to 2014, and indicating trends for 2024, a decade after the end of the data historical series.
Statistical analysis and linear regression were performed by the R program (R Develop ment Core Team, 2014). The creation of the maps was made by the ArcGIS for Desktop 10.4 program, through its extensions, Spatial Analyst and Geostatistical Analyst. The spatial dependence of the THI in the State of Minas Gerais was analyzed by means of the semivariogram ad justment using the OLS method, adjusting the spherical model, and the interpolation was carried out using ordinary kriging (Ferraz et al., 2015).
The zones of thermal comfort and discomfort for rural workers were defined considering that the rural workers exert moderate activities, with metabolic rate of 175 W, working stand-up, with movement of arms and legs and the use of light clothes, that is, with thermal resistance of 0.09°C W m-2 (Oliveira et al., 2006).
The thermal environ ments were classified as
comfort (THI <74), hot (74≤THI <79), very hot (79≤THI<84) and extremely hot (THI≥84) (Lamberts et
al., 1997; Oliveira et al., 2006). Thermal discomfort begins in the hot environment and can cause health problems and
reduce rural workers’ performance. The very hot
environment indicates danger and can cause serious effects to health and the extremely hot environment can cause very serious health risks.
RES ULTS AND DISCUSS ION
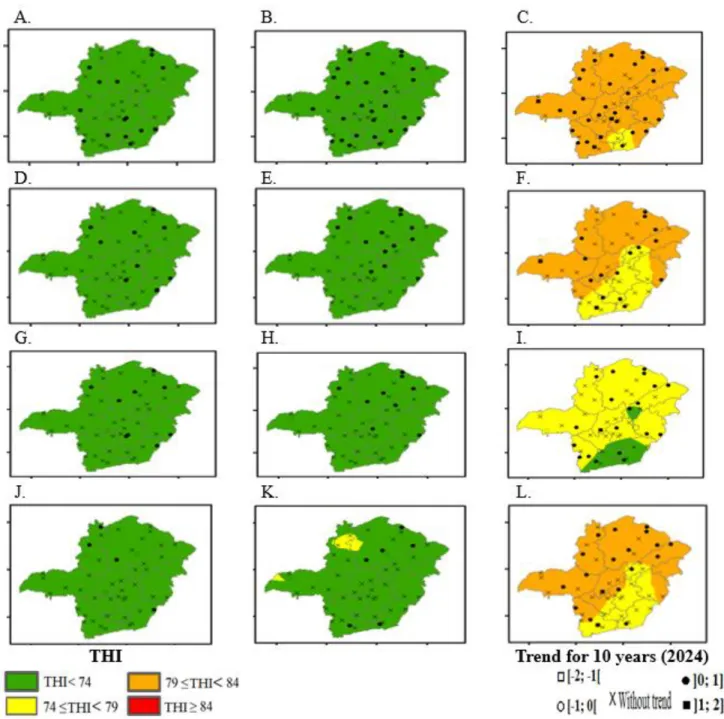
FIGURE 2. Variation of the minimu m, med iu m and maximu m temperature and humid ity index (THI) (summer: (A), (B) and (C), respectively; fall: (D), (E) and (F), respectively; winter: (G), (H) and (I), respectively; spring: (J), (K) and (L), respectively), for the period from 1976 to 2014, in the evaluated municipalities of the State of Minas Gerais, and their THI trends for a decade (2024).
In relation to the average historical values of THImax, it can be observed that only during the winter period (Figure 2I), part of the mesoregions of South/Southwest of Minas Gerais, Campos das Vertentes, Zona da Mata, West of Minas Gerais and Belo Horizonte Region, Jequitinhonha and Vale do Rio Doce presented comfo rt conditions (THI <74). The other mesoregions
were classified as hot (74 ≤ THI <79) or very hot (79 ≤
THI <84) for winter and other seasons. The very hot areas have expanded throughout the seasons, fro m winter to summer and declin ing in fall (Figures 2C, 2F, 2I, 2L); similar to what was observed by Oliveira et al. (2006).
Thus, periods with thermal conditions classified as
hot (74 ≤ THI <79) and very hot (79<THI≤ 84) were
observed at all seasons in the State of Minas Gerais for THImax, corroborating with Oliveira et al. (2006). Therefore, minor or serious health problems, in addition to the reduction in the performance of rural workers are expected. It is emphasized that, hourly variations of the THI can cause situations of thermal discomfort (Buriol et al., 2015), intensifying the discomfort.
The comfort classification verified for THImín in the four seasons in the historical period (1976-2014) d id not change in 2024 (Figure 3), although tendencies of increase and reduction of these values were observed (Figures 2A, 2D, 2G, 2J).
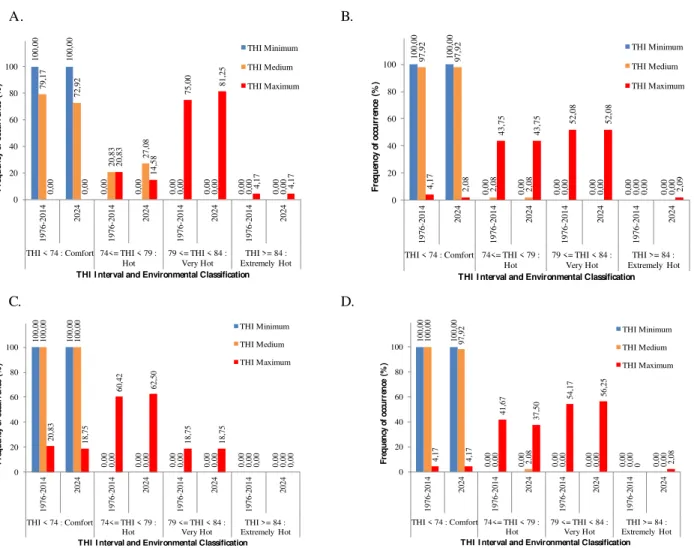
summer, fall, winter and spring seasons were 6.25%, 0.00%, 0.00% and 2.08%, respectively. These percentages of reduction were consequently added to the condition of the thermal environment classified as hot (Figure 3). Reduction on 6.25% of the situation classified as hot and increase of very hot situation was verified for THImax (Figure 3A) in the summer season.
In the fall, it was observed the decrease of occurrences of THImax values for co mfort conditions of 2.09 (Figure 3B). Consequently, it was observed a 2.09% increase in the extremely hot classification for THImax when comparing the 2024 scenario with the historical period (1979-2014). A. B. 10 0, 00 10 0, 00 0, 00 0, 00 0, 00 0, 00 0, 00 0, 00 79 ,1 7 72 ,9 2 20 ,8 3 27 ,0 8 0, 00 0, 00 0, 00 0, 00 0, 00 0, 00 20 ,8 3 14 ,5 8 75 ,0 0 81 ,2 5 4, 17 4, 17 0 20 40 60 80 100 19 76-20 14 20 24 19 76-20 14 20 24 19 76-20 14 20 24 19 76-20 14 20 24
THI < 74 : Comfort 74<= THI < 79 : Hot
79 <= THI < 84 : Very Hot
THI >= 84 : Extremely Hot
F re q u en cy o f o cc u rr en ce ( % )
THI I nterval and Environmental Classification THI Minimum THI Medium THI Maximum 10 0, 00 10 0, 00 0, 00 0, 00 0, 00 0, 00 0, 00 0, 00 97 ,9 2 97 ,9 2 2, 08 2, 08 0, 00 0, 00 0, 00 0, 00 4, 17 2, 08 43 ,7 5 43 ,7
5 52,0
8
52
,0
8
0,
00 2,09
0 20 40 60 80 100 197 6-20 14 20 24 197 6-20 14 20 24 197 6-20 14 20 24 197 6-20 14 20 24
THI < 74 : Comfort 74<= THI < 79 :
Hot 79 <= THI < 84 : Very Hot Extremely HotTHI >= 84 :
F re q u en cy o f o cc u rr en ce ( % )
THI I nterval and Environmental Classification THI Minimum THI Medium THI Maximum C. D. 10 0, 00 10 0, 00 0, 00 0, 00 0, 00 0, 00 0, 00 0, 00 10 0, 00 10 0, 00 0, 00 0, 00 0, 00 0, 00 0, 00 0, 00 20 ,8 3 18 ,7 5 60 ,4 2 62 ,5 0 18 ,7 5 18 ,7 5 0, 00 0, 00 0 20 40 60 80 100 197 6-20 14 20 24 197 6-20 14 20 24 197 6-20 14 20 24 197 6-20 14 20 24
THI < 74 : Comfort 74<= THI < 79 :
Hot 79 <= THI < 84 : Very Hot Extremely HotTHI >= 84 :
F re q u en cy o f oc cu rr en ce ( % )
THI I nterval and Environmental Classification THI Minimum THI Medium THI Maximum 10 0, 00 10 0, 00 0, 00 0, 00 0, 00 0, 00 0, 00 0, 00 10 0, 00 97 ,9 2 0,
00 2,08
0, 00 0, 00 0, 00 0, 00 4, 17 4, 17 41 ,6 7 37 ,5 0 54 ,1 7 56 ,2 5
0 2,08
0 20 40 60 80 100 19 76-20 14 20 24 19 76-20 14 20 24 19 76-20 14 20 24 19 76-20 14 20 24
THI < 74 : Comfort 74<= THI < 79 :
Hot 79 <= THI < 84 : Very Hot Extremely HotTHI >= 84 :
F re q u en cy o f oc cu rr en ce ( % )
THI I nterval and Environmental Classification THI Minimum
THI Medium
THI Maximum
FIGURE 3. Variation of the occurrence frequency of THImin, THImed and THIma x in the seasons of (A) su mmer, (B) fall, (C) winter and (D) spring, for the period fro m 1976 to 2014 and for the year 2024, in the evaluated municipalities of the state o f Minas Gerais
The trend analysis indicates, in general, the increase of the occurrence frequency of the hot classification in summer and spring for THImean and THIma x, when comparing the 2024 scenario with the historical period (1979-2014). So, it was verified the increase of the extremely hot condition in autumn and spring. This profile due to climatic changes increases human discomfort especially in summer, fall and spring, in which the sums of THImax occurrences classified as very hot and extremely hot are 85.42%, 54.16% and 58.33 %, (Figure 3), respectively. The increase in human discomfort due to climate change was also verified by Potchter & Ben-Shalo m (2013).
Zhang et al. (2014) reco mmended the upper limits of tdb and RH of 29.2°C and 50% (THI = 77.1) and 28.0°C and 70% (THI = 77.4) so that 90% of people can be satisfied in circulation spaces in a hot and humid area of China. The satisfaction level of 73% was obtained for tdb
and RH of 31.0°C and 50% (THI = 79.5) and of 29.5°C and 70% (THI = 79.4).
Changes in the thermal environ ment are related to declining work capacity (Dunne et al., 2013) and to the increased incidence of cardiovascular diseases (Ezekowitz et al., 2013) and mental disorders (Vaneckova & Bambrick, 2013). The absence of actions to mitigate the thermal environ ment on humans can cause reduction of performance and increase of diseases, a situation that can be aggravated by climate changes.
CONCLUS IONS
The bioclimatic zoning of the temperature and humid ity index (THI) for the State of Minas Gerais indicated the occurrence of hot conditions (74 ≤ THI <79)
when analyzing the THImean in the summer and fall and
very hot conditions (79 <THI ≤ 84) and extremely hot
conditions (THI>84) fo r THImax throughout the year, except in the winter.
Trend analysis applied to the time series indicates worst conditions in 2024.
ACKNOWLEDGEMENTS
To the Federal Un iversity of Lavras (UFLA ), FAPEMIG, CAPES and CNPq for financial support.
REFERENCES
Ávila LF, Mello CR, Yanagi SNM, Neto OBS (2014) Tendências de temperaturas mín imas e máximas do ar no Estado de Minas Gerais. Pesquisa Agropecuária Brasileira 49(4):247-256.DOI: 10.1590/S0100-204X2014000400002 Buriol GA, Estefanel V, Righi EZ, Bressan VC (2015) Conforto térmico para os seres humanos nas condições de amb iente natural em Santa Maria, RS, Brasil. Ciência Rural 45(2):223-230. DOI: http://d x.doi.org/10.1590/0103-8478cr20131537
Dunne JP, Stouffer RJ, Hohn JG (2013) Reductions in labour capacity fro m heat stress under climate warming. Nature Climate Change 3(6):563-566. DOI:
http://dx.doi.org/10.1038/nclimate1827
Ezekowitz JA, Bakal JA, Westerhout CM, Giugliano RP, White H, Keltai M, Prabhakaran D, Tricoci P, Werf FV, Califf RM, Newby LK, Armstrong PW (2013) The relationship between meteoro logical conditions and index acute coronary events in a global clinical trial.
International Journal of Cardio logy 168(3):2315-2321. DOI: https://doi.org/10.1016/j.ijcard.2013.01.061
Ferraz GAS, Silva FM, Oliveira MS, Avelar RC, Sales RS (2015) Variabilidade espacial da dose de P2O5 e K2O para adubação diferenciada e convencional em lavoura cafeeira. Coffee Science 10(3):346-356.
Hjort J, Suomi J, Käyhko J (2016) Extre me urban-rural temperatures in the coastal city of Turku, Fin land: Quantification and visualization based on a generalized additive model. Science of the Total Environ ment 569(1)507–517.DOI:
https://doi.org/10.1016/j.scitotenv.2016.06.136
Kendall MG (1975) Rank correlation methods. London, Charles Griffin. 210p.
Lamberts R, Dutra L, Pereira FOR(1997)Eficiência energética na arquitetura. São Pau lo, PW. 192p.
Lee H, Mayer H, Chen L (2016) Contribution of trees and grasslands to the mitigation of hu man heat stress in a residential district of Freiburg, Southwest Germany. Landscape and Urban Planning 148(1)37-50. DOI: https://doi.org/10.1016/j.landurbplan.2015.12.004 Longobardi A, Villani P (2010) Trend analysis of annual and seasonal rainfall time series in the Mediterranean area. International Journal of Climatology 30(10):1538-1546. DOI: https://doi.org/10.1002/joc.2001
Loughnan M, Nicholls N, Tapper N (2010) Mortality-temperature thresholds for ten major population centres in rural Victoria, Australia. Health & Place 16(6):1287-1290. DOI: https://doi.org/10.1016/j.healthplace.2010.08.008
Mann H B (1945) Nonparametric test against trend. Economectrika 13(1):245-259.DOI: 10.2307/1907187
McMichael AJ, Woodruff RE, Hales S (2006) Climate change and human health: present and future risks. The Lancet 367(9513):859-869. DOI:
https://doi.org/10.1016/S0140-6736(06)68079-3
Mello CR, Viola MR (2013) Mapeamento de chuvas intensas no estado de Minas Gerais. Rev ista Brasileira de Ciência do So lo 37(1):37- 44. Available in :
http://www.redalyc.org/articulo.oa?id =180225736009
Minuzzi RB (2010) Tendências na variabilidade climática de Santa Catarina, Brasil. Revista Brasileira de Engenharia Agrícola e A mb iental 14(12):1288-1293.DOI:
http://dx.doi.org/10.1590/S1415-43662010001200006
Oliveira LMF, Yanagi junior T, Ferreira E, Carvalho LG, Silva MP (2006) Zoneamento bioclimático da região Sudeste do Brasil para o conforto térmico animal e humano. Engenharia Agrícola 26(3)823-831.
Ou CQ, J YANG , Ou QQ, Liu HZ, Lin GZ, Chen PY, Qian J, Guo YM (2014) The impact of relative humidity and atmospheric pressure on mortality in Guangzhou, China. Bio medical and Environmental Sciences
27(12):917-925.DOI: https://doi.org/10.3967/bes2014.132
Park S, Tuller SE, Jo M (2014) Application of Un iversal Thermal Climate Index (UTCI) for microclimatic analysis in urban thermal environ ments. Landscape and Urban Planning 125(1):146-155. DOI:
https://doi.org/10.1016/j.landurbplan.2014.02.014
Potchter O, Ben-Shalo m HI (2013) Urban warming and global warming: Co mbined effect on thermal d iscomfort in the desert city of Beer Sheva, Israel. Journal of Arid Environments 98(1):113-122. DOI:
https://doi.org/10.1016/j.jaridenv.2013.08.006
R Develop ment Core Team. R: a language and environment for statistical computing. Vienna: R
Foundation for Statistical Co mputing 2017. Available in: http://www.R-p roject.org/. Accessed: Jun 22, 2017.
Ragheb AA, El-darwish II, Ah med S (2016) Microclimate and human comfort considerations in planning a historic urban quarter. International Journal of Sustainable Built Environment 5(1):156-167. DOI:
https://doi.org/10.1016/j.ijsbe.2016.03.003
Shen D, Zhu N (2015) In fluence of the temperature and relative hu midity on human heat acclimatization during training in extremely hot environ ments. Building and Environment 94(1):1-11. DOI:
https://doi.org/10.1016/j.buildenv.2015.07.023
Sneyers R (1975) Sur L’ analyse statistique des séries d’
Thom EC (1958) Cooling degree: day air conditioning, heating, and ventilating. Transactions of the ASHRA E 55(1):65-72.
Thom EC (1959) The discomfort index. Weatherwise 12(1):57-60.
Tian Q, Prange M, Merkel U (2016) Precipitation and temperature changes in the major Chinese river basins during 1957–2013 and links to sea surface temperature. Journal of Hydrology 536(1):208-221. DOI:
https://doi.org/10.1016/j.jhydrol.2016.02.048
Tonietto J, Vianello RL, Reg ina MA (2006)
Caracterização macroclimática e potencial enológico de diferentes regiões com vocação vitícola de Minas Gerais. Informe Agropecuário 27(234):32-55.
Van Hove LWA, Jacobs CMJ, Heusinkveld BG, Elbers JA, Van Driel BL, Ho ltslag AAM (2015) Temporal and spatial variability of urban heat island and thermal co mfort within the Rotterdam agglo meration. Building and Environ ment 83(1):91-103. DOI:
https://doi.org/10.1016/j.buildenv.2014.08.029
Vaneckova P, Bamb rick H (2013) Cause-specific hospital admissions on hot days in Sydney, Australia. PLoS ONE 8(1):1-9. DOI:
https://doi.org/10.1371/journal.pone.0055459
Vianello RL, Alves, AR (2012) Meteorologia básica e aplicações. Viçosa, Universidade Federal de Viçosa, 2 ed. 460p.
Zhang Y, Zhang J, Chen H, Du X, Meng Q (2014) Effects of step changes of temperature and humidity on hu man responses of people in hot-humid area of China. Building and Environ ment 80(1):174-183. DOI:
https://doi.org/10.1016/j.buildenv.2014.05.023
Zheng G, Zhu N, Tian Z, Chen Y, Sun B (2012)