Novel Biomarker for Male Hepatocellular Carcinoma
Shan Li1., Cuiju Mo1., Shan Huang1., Shi Yang1
, Yu Lu1, Qiliu Peng1, Jian Wang1, Yan Deng1, Xue Qin1*, Yinkun Liu2,3*
1Department of Clinical Laboratory, First Affiliated Hospital of Guangxi Medical University, Nanning, Guangxi, China,2Liver Cancer Institute, Zhongshan Hospital, Fudan University, Shanghai, China,3Cancer Research Center, Institute of Biomedical Science, Fudan University, Shanghai, China
Abstract
Hepatocellular carcinoma (HCC) is a male-predominant cancer. Previous studies have focused on the sex-related disparity in HCC, but the underlying mechanism remains unclear. Here, we aimed to discover characteristic biomarkers for male HCC. Clinical samples were subjected to iTRAQ labeling followed by 2DLC-ESI-MS/MS analysis. Seventy-three differential proteins containing 16 up-regulated and 57 down-regulated proteins were screened out in the male HCC group compared to that in female HCC group. Testis-specific Protein Y-encoded 1(TSPY1) is characteristically present in male HCC and was chosen for further investigation. The data from the functional effects of TSPY1 indicated that over-expression of TSPY1 could potentiate HCC cell proliferation, increase soft agar colonization, induce higher cell invasive ability and correlate with the metastatic potential of the HCC cell lines. In addition, TSPY1 and androgen receptor (AR) were co-expressed simultaneously in HCC cell lines as well as in HCC tissue. TSPY1 up- or down-regulation could lead to a high or low level expression of AR. These results implied that TSPY1 may be included in the regulation of AR expression involved in male HCC and it may act as a novel biomarker for male HCC.
Citation:Li S, Mo C, Huang S, Yang S, Lu Y, et al. (2014) Over-Expressed Testis-Specific Protein Y-Encoded 1 as a Novel Biomarker for Male Hepatocellular Carcinoma. PLoS ONE 9(2): e89219. doi:10.1371/journal.pone.0089219
Editor:Lian-Yue Yang, Xiangya Hospital of Central South University, China
ReceivedOctober 4, 2013;AcceptedJanuary 16, 2014;PublishedFebruary 20, 2014
Copyright:ß2014 Li et al. This is an open-access article distributed under the terms of the Creative Commons Attribution License, which permits unrestricted use, distribution, and reproduction in any medium, provided the original author and source are credited.
Funding:This work was financially supported by National Natural Science Foundation of China (No.81260302 and No.81060199), National Natural Science Foundation of Guangxi (2012GXNSFAA053088); National Research Program of China (973 Program: 2011CB910604, 2013CB910501; 863 program: 2011AA020204), China National Key Projects for Infectious Diseases (2012ZX 10002-012). The funders had no role in the study design, data collection and analysis, decision to publish or preparation of the manuscript.
Competing Interests:The authors have declared that no competing interests exist.
* E-mail: [email protected] (XQ); [email protected] (YL)
.These authors contributed equally to this work.
Introduction
Hepatocellular carcinoma (HCC) is one of the most common malignancies in the world, rank third cancer mortality globally [1], and there are more than 500,000 new patients with HCC worldwide every year. HCC occurs mainly in men, it is the fifth most common cancer for male and the seventh for female, the ratio of male to female is usually in the range of 2:1 and 4:1 [2]. In western European, the age-standardized incidence rate for male HCC was 6.2/10 million and 1.7/10 million for female, 37.9/10 million and 14.2/10 million for Chinese male and female, respectively [2]. It suggested that the difference of gender may be closely associated with the occurrence and development of HCC.
Proteomics has became a new biological research hotspot in the post-genomic era and showed an increasing important role in the biomarker discovery [3]. Proteomics technology can analyze alteration of protein molecules which play important role in forecasting for tumor development, metastatic and recurrence from the overall perspective. At present, there have been reclaimed valuable results of HCC proteomics using isobaric tag for relative and absolute quantitation (iTRAQ) technique. Previous studies observed the alteration of protein profiling in HBV-infected HepG2 cells by iTRAQ-coupled 2D LC-MS/MS technology; 15 proteins have been identified as down-regulation,
including S100A6 and AnnexinA2 [4]. Chaerkady et.al found 59 up-regulated and 96 down-regulated proteins in liver cancer by comparing HCC tissues and adjacent normal tissue using the above technology [5]. But there is few proteomics research of sex-related disparity for liver cancer currently. ITRAQ is a high-throughput, reproducible and high sensitivity proteomics analysis technique, and it provides a strong technology platform for our study.
hepatitis B virus X protein (HBx). Previous studies have been focused on the sex-related disparity in HCC, however, the mechanism of male-predominant HCC is still unclear and there are few characteristic biomarkers for male HCC. It is urgent to discover characteristic biomarkers for male HCC and it would be valuable for guiding therapy of male HCC.
Here, we focused our efforts on the difference of expression of proteins between HBV based HCC tissue of male and female using iTRAQ-based quantitative proteomic technology. TSPY1 was screened out and further confirmed by qRT-PCR and western blot. Over-expression of TSPY1 could potentiate HCC cell proliferation, increase soft agar colonization, and strengthen cell invasive ability. It was over-expressed in male HCC tissue only and may act as a novel biomarker for male HCC.
Materials and Methods
Ethics Statement
Access to human tissues complied with the laws of China and the guidelines of the Ethics Committee. The Medical Ethics Committee of First Affiliated Hospital of Guangxi Medical University approved this study and all participants have given written informed consent.
Cell Lines
The human HCC cell lines HepG2(TCHu 72), SMMC7721(TCHu 52) and Huh7(TCHu 82) which are HBV-negative cell lines were obtained from the Institute of Biochemistry and Cell Biology, Chinese Academy of Sciences, Shanghai, China (http://www.cellbank.org.cn). HCC cell lines MHCC97L, MHCC97H and HCCLM3 which are HBV-positive cell lines
with the same genetic background were from Liver Cancer Institute of Fudan University (Shanghai, China) [12,13]. All cell lines were from male HCC.
Reagents
The iTRAQTM Reagents Kit was from Applied Biosystems (USA). TSPY1 small hairpin (sh) RNA fragments were purchased from Genechem (Shanghai, China). Rabbit polyclonal to TSPY1 was from Abcam Company. Mouse monoclonal to Flag was purchased from Sigma. Taq polymerase purchased from TA-KARA. Lipofectamine 2000 was purchased from Invitrogen. Dulbecco’s modified Eagle’s (DMEM) medium, Roswell Park Memorial Institute 1640(RPMI-1640) and fetal bovine serum (FBS) were from Sigma Group and Gibco Company.
Tissue Samples Collection and Protein Extraction
All samples were obtained from the Department of Hepatobil-iary Surgery, First Affiliated Hospital of Guangxi Medical University (Nanning, China). All the patients were from the same geographic area as the normal group with the similar genetic background and lifestyle. The clinic pathological features of the samples were listed in Table 1. All the participants were negative for antibodies against hepatitis C virus (HCV), hepatitis D virus (HDV), diabetes and hypertension. Statistical analysis showed no significant difference in age, the level of serum AFP, ALT, AST and albumin, tumor size, cirrhosis and tumor stage between the male and female HCC groups. The diagnosis of HCC was confirmed by histopathological examination, no patients had undergone radiotherapy and chemotherapy before surgery. Fresh tissues were rapidly frozen in liquid nitrogen after surgical resection, and later transferred to280uC for preservation. After
Table 1.The clinical and pathological features of all samples.
Feature HCC Normal
Gender Male Female Male Female
Number of individuals 49 28 8 14
Age (years) 48614 52611* 41612 47612
Hepatitis B surface Ag
Positive 49 28 0 0
Negative 0 0 8 14
Serum AFP (ng/ml) 68.20(0.88–60500.00) 37.50(1.53–58344.00)* 2.52(2.16–4.63) 2.84(0.88–4.88)
Serum ALT(U/L) 36.0(14.0–294.0) 24.0(10.0–80.0)* 24.0(17.0–71.0) 16.0(6.0–24.0)
Serum AST(U/L) 35.0(14.0–215.0) 31.0(23.0–107.0)* 34.0(20.0–57.0) 24.0(17.0–32.0)
Serum albumin (g/L) 38.0(24.7–45.6) 35.8(31.2–44.2)* 37.7(34.8–43.5) 39.6(37.0–47.6)
Tumor size*,a
#5 cm 24 9 0 0
.5 cm 25 19 0 0
Cirrhosis*,a
Absent 28 16 0 0
Present 21 12 0 0
Tumor stage*,a
StageI 37 18 0 0
StageII 12 10 0 0
Metastasis 0 0 0 0
*p.0.05; aChi-square test.
removing the blood and vessels, about 0.2 g tissue was slightly cut into pieces and 1 ml lysis buffer (20 mmol/L Tris, 7 mol/L urea, 2 mol/L thiourea, 4% CHAPS, 65 mmol/L DTT, 1 mmol/L PMSF) and grinding beads were added. The samples were shocked in multifunctional sample homogenizer (eppendorf), then centrifuged and collected supernatant. The concentration of extracted total protein was determined by the Bradford method (Bio-Rad).
ITRAQ Labeling and 2DLC-ESI-MS/MS
The experimental procedure of iTRAQ labeling and 2DLC-ESI-MS/MS was showed in Figure 1 according to the previous study [12]. The identification and quantification of protein for the iTRAQ were executed using ProteinPilot 3.0 software (Applied Biosystems, USA). Data searching was performed against SWISS-PROT human database according to the Paragon algorithm. At least two peptides with 95% confidence or one of the two peptides with 99% confidence were considered for protein identification. The results were exported into excel, proteins were considered as
up-regulated with their ratios.1.2 and when their ratios,0.8 were considered as down-regulation [14].
The differentially expressed proteins screened by iTRAQ were further analyzed using UniProt database. The proteins were classified in Gene Ontology (GO) in accordance with biological functions and were evaluated biological process, subcellular distributions and molecular function in the SWISS-PROT database. The Reactome was used to analyze the biological pathways of the proteins.
Lentiviral Vector Construction and Lentivirus Packaging
The CDS region of human TSPY1 was cloned from human genomic DNA and was confirmed by sequencing, the PCR product was subcloned into GV287 (Shanghai GeneChem Co., Ltd., Shanghai, China). TSPY1-shRNAs were designed to target the TSPY1 gene (NM_003308), the specific shRNA sequences (59 -TTGCTGAGATCCTATGTAA-39 and 59 -TTAACTTCTT-CAACTGGTT-39) were cloned into the GV115 (Shanghai GeneChem Co., Ltd., Shanghai, China). A GFP-lentiviral vector
Figure 1. Experimental procedure of iTRAQ.
was used as a negative control. The lentivirus was produced by transfecting lentiviral plasmids into HEK-293T cells with Lipofectamine 2000 (Invitrogen). After 48 h of transfection, cell supernatants containing lentivirus was harvested, concentrated and calibrated virus titer. The lentivirus with a final concentration of 8E+8 TU/ml was stored at280uC.
Lentiviral Transfection
MHCC97H cells and Huh7 cells were cultured in DMEM medium and SMMC7721 cell was cultured in RPMI-1640 supplemented with 10% FBS 100U/ml streptomycin, 100U/ml penicillin in a humidified atmosphere of 5% CO2 at 37uC. The day before transfection, the HCC cells were plated at a density of 16105cells/well in six-well plates. Then the medium was replaced
with 1 ml serum-free medium, and these cells were transfected with lentivirus at a multiplicity of infection (MOI) of 20 in the presence of 10mg/ml of polybrene (Sigma). The culturing
medium was changed to complete medium after 12 h of transfection. After cultured for another 72 h, the rate of infection was observed using fluorescence microscope, the total cellular protein and RNA were extracted for further validation or the transfected cells were conducted cell functional experiment.
Quantitative RT-PCR
Total RNA was isolated from cultured cells using Trizol reagent (Invitrogen) as suggested by the manufacturer’s instructions. A total of 2mg RNA and oligo-dT were reverse-transcribed into cDNA using a reverse transcriptase reaction kit (Ferments). RT-PCR was performed using SYBR Green RT-PCR Master Mix and reactions (TAKARA) on IQ5 Multicolor Real-time PCR Detec-tion System (Bio-Rad) following the condiDetec-tions: 95uC for 5 min, 40 cycles of 95uC for 15 s, 59uC for 15 s and 72uC for 20 s. The experimental Ct (cycle threshold) was normalized to b-actin control product and all of the amplifications were performed in three technical repeats. The amount of target gene relative to those expressed by mock cells was calculated by 22DDTmethod. The primer sequences were listed in Table 2.
Western Blot
A total of 20mg proteins were separated by 10% SDS-PAGE and transfered to 0.2mm polyvinylidene fluoride membrane (PVDF, Millipore, Billerica, USA) using a Bio-Rad SemiDry instrument (Bio-Rad). The membrane was blocked by 5% milk at room temperature for 1 h, then incubated with Flag (1:1000 dilution),TSPY1 (1:500 dilution) and GAPDH (1:10000 dilution) at 4uC overnight. After 3 times of 15 min washing by 0.1% TBST (50 mmol/L Tris-HCl, 150 mmol/L NaCl, 0.1% v/v Tween-20, pH7.4), the membrane was further incubated with HRP-conjugated secondary antibodies (1:10000 dilution) for 1 h at room temperature. Then washed again by 0.1% TBST for 3 times of 15 min, the protein bands were visible and semi-quantitative analysis using enhanced chemiluminescence detection (ECL; GE, Healthcare, Piscataway, NJ).
Cell Proliferation and Cell Migration Assays
The cells (1000 cells/well) infected with lentiviral vector were dispensed in 100ml medium into a 96-well plate for 24 h,48 h and 72 h, respectively. At the indicated time points, added 10ml 2-(4-indophenyl)-3-(4-nitrophenyl)-5-(2,4-disulphophenyl)- 2H- tetrazo-lium monosodium salt (CCK8, Cell Counting kit) into the wells and incubated for 1 h, then the plate was read using an enzyme-linked immunosorbent assay plate reader at 450 nm.
Cell migration was performed using transwell chamber with 8mm pores (Corning Costar, Cambridge, MA). The cells infected
with lentiviral vector were trypsinized and resuspended in DMEM containing 3% FBS. Cells (56104) were plated in the upper
chamber, and the upper chambers were inserted in a well of a 24-well plate containing 600ml 20% FBS-DMEM. After incubation
for 36 h, the non-migrating cells in the upper chamber were removed using a cotton swab and the cells that had migrated to the underside of the membrane were fixed with 4% paraformaldehyde for 30 min, stained with 10% Giemsa for 30 min. The cells in the underside of the membrane were counted under light microscopy.
Cell Apoptosis
Prepare enough cells for incubating with the MuseTM Annexin V&Dead Cell Reagents and the cells were resuspended in 1% BSA-PBS. Added 100ml of MuseTM Annexin V& Dead Cell reagent to a new tube and then mixed with 100ml of cells in suspension. The cells were incubated for 20 min at room temperature in dark and counted by MuseTM Annexin V& Dead Cell software.
Soft Agar Colonization
First, 1 ml of sterilized 0.6% low melting point agarose (Sigma) in complete medium was added to each well of 6-well plate. After the medium became solid gel at 37uC, 1 ml of 0.3% low melting point agarose in complete medium with 1000 cells was added on top of the base gel. The plate was cultured in cell incubator for 14 days. The number of clone (§50 cells) was assessed microscop-ically. All experiments were performed in triplicate.
Statistical Analysis
The statistical analyses were performed using a commercially available statistical software package (SPSS for Windows, 16.0). Quantitative variables were analyzed by Student’s t-test. The correlation was assessed by Pearson method. P,0.05 was considered as statistically significant.
Table 2.List of primers used for RT-PCR.
Gene Primer sequences
TSPY1 Forward: 59-ATGTTGTTCTTTCGGAGTAACCC-39
Reverse: 59-TGAGAAGCCCTGTATTCTGTGAT -39
B2L13 Forward: 59-ATCACTGCCACCTCCCTG-39
Reverse: 59-TTGCTGCTTTCACCTCTTCT-39
CP27A Forward: 59-TTCGAGAAACGCATTGGC-39
Reverse: 59-GGAGGAAGGTGGCATAGAGT-39
AK1C1 Forward: 59-AGACATTGTTCTGGTTGCCTAT-39
Reverse: 59-GGGTTCGCTTGTGCTTTT-39
AR Forward: 59-ACTCCAGGATGCTCTACTTCG-39
Reverse: 59-AGGTGCCTCATTCGGACA-39
CXCR4 Forward:59-AACTTCCTATGCAAGGCAGT-39
Reverse:59-TATCTGTCATCTGCCTCACT-39
HIF-1 Forward:59- TTACAGCAGCCAGACGATCA -39
Reverse:59- CCCTGCAGTAGGTTTCTGCT -39
b-actin Forward: 59- CATGTACGTTGCTATCCAGGC-39
Reverse: 59-CTCCTTAATGTCACGCACGAT-39
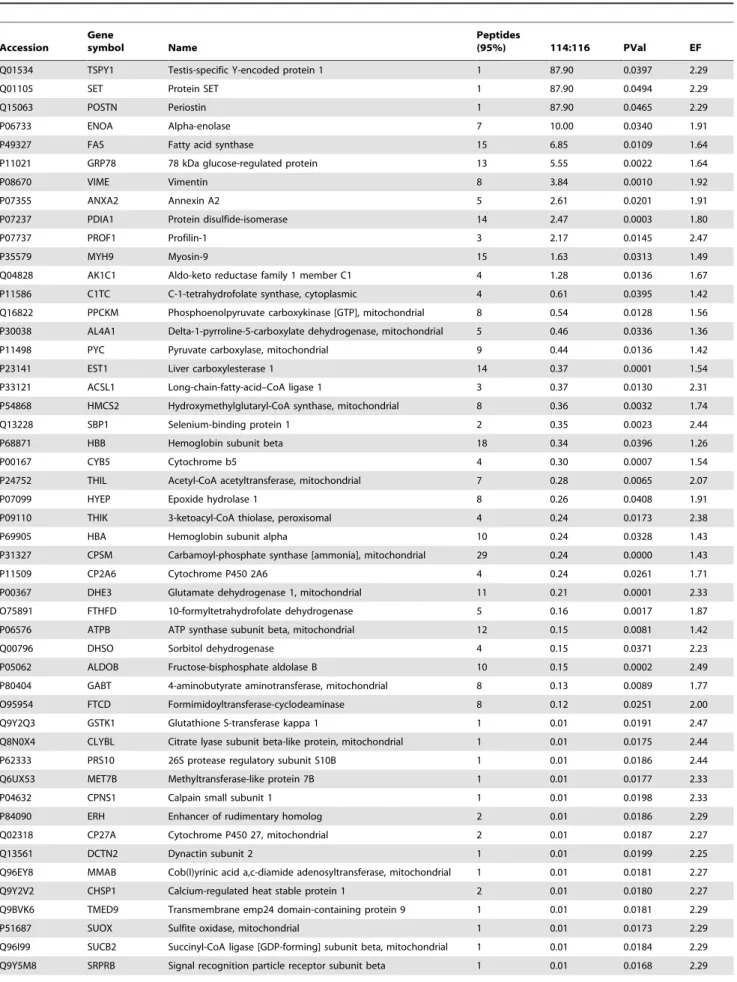
Table 3.71 proteins showed differences in expression levels between male groups at HCC group compared to normal group.
Accession
Gene
symbol Name
Peptides
(95%) 114:116 PVal EF
Q01534 TSPY1 Testis-specific Y-encoded protein 1 1 87.90 0.0397 2.29
Q01105 SET Protein SET 1 87.90 0.0494 2.29
Q15063 POSTN Periostin 1 87.90 0.0465 2.29
P06733 ENOA Alpha-enolase 7 10.00 0.0340 1.91
P49327 FAS Fatty acid synthase 15 6.85 0.0109 1.64
P11021 GRP78 78 kDa glucose-regulated protein 13 5.55 0.0022 1.64
P08670 VIME Vimentin 8 3.84 0.0010 1.92
P07355 ANXA2 Annexin A2 5 2.61 0.0201 1.91
P07237 PDIA1 Protein disulfide-isomerase 14 2.47 0.0003 1.80
P07737 PROF1 Profilin-1 3 2.17 0.0145 2.47
P35579 MYH9 Myosin-9 15 1.63 0.0313 1.49
Q04828 AK1C1 Aldo-keto reductase family 1 member C1 4 1.28 0.0136 1.67
P11586 C1TC C-1-tetrahydrofolate synthase, cytoplasmic 4 0.61 0.0395 1.42
Q16822 PPCKM Phosphoenolpyruvate carboxykinase [GTP], mitochondrial 8 0.54 0.0128 1.56
P30038 AL4A1 Delta-1-pyrroline-5-carboxylate dehydrogenase, mitochondrial 5 0.46 0.0336 1.36
P11498 PYC Pyruvate carboxylase, mitochondrial 9 0.44 0.0136 1.42
P23141 EST1 Liver carboxylesterase 1 14 0.37 0.0001 1.54
P33121 ACSL1 Long-chain-fatty-acid–CoA ligase 1 3 0.37 0.0130 2.31
P54868 HMCS2 Hydroxymethylglutaryl-CoA synthase, mitochondrial 8 0.36 0.0032 1.74
Q13228 SBP1 Selenium-binding protein 1 2 0.35 0.0023 2.44
P68871 HBB Hemoglobin subunit beta 18 0.34 0.0396 1.26
P00167 CYB5 Cytochrome b5 4 0.30 0.0007 1.54
P24752 THIL Acetyl-CoA acetyltransferase, mitochondrial 7 0.28 0.0065 2.07
P07099 HYEP Epoxide hydrolase 1 8 0.26 0.0408 1.91
P09110 THIK 3-ketoacyl-CoA thiolase, peroxisomal 4 0.24 0.0173 2.38
P69905 HBA Hemoglobin subunit alpha 10 0.24 0.0328 1.43
P31327 CPSM Carbamoyl-phosphate synthase [ammonia], mitochondrial 29 0.24 0.0000 1.43
P11509 CP2A6 Cytochrome P450 2A6 4 0.24 0.0261 1.71
P00367 DHE3 Glutamate dehydrogenase 1, mitochondrial 11 0.21 0.0001 2.33
O75891 FTHFD 10-formyltetrahydrofolate dehydrogenase 5 0.16 0.0017 1.87
P06576 ATPB ATP synthase subunit beta, mitochondrial 12 0.15 0.0081 1.42
Q00796 DHSO Sorbitol dehydrogenase 4 0.15 0.0371 2.23
P05062 ALDOB Fructose-bisphosphate aldolase B 10 0.15 0.0002 2.49
P80404 GABT 4-aminobutyrate aminotransferase, mitochondrial 8 0.13 0.0089 1.77
O95954 FTCD Formimidoyltransferase-cyclodeaminase 8 0.12 0.0251 2.00
Q9Y2Q3 GSTK1 Glutathione S-transferase kappa 1 1 0.01 0.0191 2.47
Q8N0X4 CLYBL Citrate lyase subunit beta-like protein, mitochondrial 1 0.01 0.0175 2.44
P62333 PRS10 26S protease regulatory subunit S10B 1 0.01 0.0186 2.44
Q6UX53 MET7B Methyltransferase-like protein 7B 1 0.01 0.0177 2.33
P04632 CPNS1 Calpain small subunit 1 1 0.01 0.0198 2.33
P84090 ERH Enhancer of rudimentary homolog 2 0.01 0.0186 2.29
Q02318 CP27A Cytochrome P450 27, mitochondrial 2 0.01 0.0187 2.27
Q13561 DCTN2 Dynactin subunit 2 1 0.01 0.0199 2.25
Q96EY8 MMAB Cob(I)yrinic acid a,c-diamide adenosyltransferase, mitochondrial 1 0.01 0.0181 2.27
Q9Y2V2 CHSP1 Calcium-regulated heat stable protein 1 2 0.01 0.0180 2.27
Q9BVK6 TMED9 Transmembrane emp24 domain-containing protein 9 1 0.01 0.0181 2.29
P51687 SUOX Sulfite oxidase, mitochondrial 1 0.01 0.0173 2.29
Q96I99 SUCB2 Succinyl-CoA ligase [GDP-forming] subunit beta, mitochondrial 1 0.01 0.0184 2.29
Results
Identification and Relative Quantification of Tissue Proteome Based Sex-related Disparity for HCC
Under the condition of unused ProtScore.1.3 for ProteinPilot 3.0 software and removed the anti-library and redundant proteins, a total of 652 distinct proteins were identified and quantified. Compared with the normal person and accordance with parameters as test to normal ratio.1.2 (protein with up-regulation) or ratio,0.8 (protein with down-regulation),p,0.05 and relative standard deviation (EF),2.5, 109 proteins including 26 up-regulated and 83 down-regulated proteins were screened out as differential proteins in the HCC patients. There were 71 differential proteins between the normal and HCC male groups (Table 3), and 38 proteins between normal and HCC female groups (Table 4). Compared to the female HCC group, 73 differential proteins including 16 up-regulations and 57 down-regulations were screened out in the male HCC group (Table 5).
Bioinformatics Analysis for the Sex-related Differential Proteins
To clearly understand the role of the differential proteins in the sex-related disparity for HCC, we carried out Go (Gene Ontology) and Pathway (Reactome) analysis for the differential proteins using bioinformatics tools. The subcellular distributions for these differential proteins were mainly enriched in cytoplasm, organelles and nucleus (Figure 2A). Figure 2B showed the biological processes functional annotation of the identified proteins, these differential
proteins were mainly involved in cell growth, metabolism, regulation and stress, such as, microsomal triglyceride transfer protein and stress-70 protein took part in the modification of protein and macromolecule biosynthetic process; Annexin A4 involved in signal transduction. Nearly 85% of the differential proteins were involved in biosynthesis and metabolic process, and 43.5% involved in signal transduction according to GO biological process analysis. Furthermore, molecular function analysis in the SWISS-PROT database indicated that the most common functional annotations of differential proteins were binding function. Besides, they also had catalytic activity, signal transducer activity and enzyme regulator activity (Figure 2C).
Further studies showed that all of the differential proteins were involved in 23 biological pathways in Reactome database. The metabolism of lipids and lipoproteins, pyruvate metabolism and citric acid cycle were proven to be associated with male hepatocarcinoma.
Validation of Differential Proteins in Clinical Samples
In order to validate the iTRAQ results, four proteins out of the 73 differential proteins based sex-related disparity, i.e. TSPY1, AK1C1, B2L13 and CP27A were chosen for further validation in 38 male and 14 female HCC tissues. These proteins were selected according to the following criterion: (1) the big fold changes of differential expression between male and female HCC groups; (2) the biological behavior was strongly correlated with the occur-rence and progression of cancer; (3) and its mechanism was unclear in HCC. The RT-PCR results indicated that the mRNA
Table 3.Cont.
Accession
Gene
symbol Name
Peptides
(95%) 114:116 PVal EF
P02743 SAMP Serum amyloid P-component 1 0.01 0.0164 2.29
P50336 PPOX Protoporphyrinogen oxidase 1 0.01 0.0187 2.29
O95487 SC24B Protein transport protein Sec24B 1 0.01 0.0184 2.29
P05165 PCCA Propionyl-CoA carboxylase alpha chain, mitochondrial 1 0.01 0.0198 2.29
P48147 PPCE Prolyl endopeptidase 1 0.01 0.0200 2.29
Q00325 MPCP Phosphate carrier protein, mitochondrial 1 0.01 0.0190 2.29
Q9NQR4 NIT2 Nitrilase homolog 2 2 0.01 0.0193 2.29
Q16795 NDUA9 NADH dehydrogenase [ubiquinone] 1 alpha subcomplex subunit 9, mitochondrial
1 0.01 0.0187 2.29
P84157 MXRA7 Matrix-remodeling-associated protein 7 1 0.01 0.0181 2.29
P04196 HRG Histidine-rich glycoprotein 1 0.01 0.0179 2.29
P30712 GSTT2 Glutathione S-transferase theta-2 1 0.01 0.0191 2.29
P09211 GSTP1 Glutathione S-transferase P 1 0.01 0.0183 2.29
P23588 IF4B Eukaryotic translation initiation factor 4B 1 0.01 0.0181 2.29
Q9Y262 IF3EI Eukaryotic translation initiation factor 3 subunit E-interacting protein
1 0.01 0.0185 2.29
P27105 STOM Erythrocyte band 7 integral membrane protein 1 0.01 0.0186 2.29
O94905 ERLN2 Erlin-2 1 0.01 0.0181 2.29
Q02338 BDH D-beta-hydroxybutyrate dehydrogenase, mitochondrial 1 0.01 0.0161 2.29
Q9BXK5 B2L13 Bcl-2-like 13 protein 1 0.01 0.0178 2.29
O75964 ATP5L ATP synthase subunit g, mitochondrial 1 0.01 0.0182 2.29
Q9UKK9 NUDT5 ADP-sugar pyrophosphatase 1 0.01 0.0192 2.29
P55263 ADK Adenosine kinase 1 0.01 0.0188 2.29
P13798 ACPH Acylamino-acid-releasing enzyme 1 0.01 0.0182 2.29
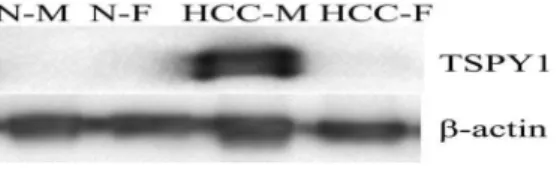
expression of those proteins were consistent with the iTRAQ results, TSPY1 and AK1C1 were increased, meanwhile B2L13 and CP27A were decreased in the male HCC tissues (Figure 3). Furthermore, after paid great attention, TSPY1 expression was much higher in male HCC group than that in female HCC group and normal group with significant difference analyzed by western blot,p,0.05(Figure 4).
TSPY1 is a member of the TSPY/SET/NAP1 superfamily mapped to the critical region harboring the gonadoblastoma locus
which was the only oncogenic on the male-specific Y chromosome (GBY) [15,16]. Therefore, TSPY1 was chosen for further study.
TSPY1 Potentiates Cell Proliferation
To determine whether TSPY1 plays a role in growth capability of HCC cells, we employed lentivirus encoding TSPY1 cDNA to over-express the expression of FLAG-tagged TSPY1 in SMMC7721 and Huh7 HCC cell lines. Also we used lentivirus-mediated shRNA to silence the expression of TSPY1 in MHCC97H cells. The expression of TSPY1 both in mRNA and
Table 4.38 proteins showed differences in expression levels between female groups at HCC group compared to normal group.
Accession
Gene
symbol Name
Peptides
(95%) 115:117 PVal EF
P61026 RAB10 Ras-related protein Rab-10 1 87.90 0.0492 2.29
P62942 FKB1A Peptidyl-prolyl cis-trans isomerase FKBP1A 1 87.90 0.0471 2.29
P05093 CP17A Cytochrome P450 17A1 1 87.90 0.0491 2.29
P53999 TCP4 Activated RNA polymerase II transcriptional coactivator p15 1 87.90 0.0413 2.29
P62917 RL8 60S ribosomal protein L8 1 87.90 0.0468 2.29
P02656 APOC3 Apolipoprotein C-III 1 74.47 0.0430 2.42
P51659 DHB4 Peroxisomal multifunctional enzyme type 2 4 20.32 0.0363 2.36
P04792 HSPB1 Heat shock protein beta-1 3 18.71 0.0311 2.86
P14625 ENPL Endoplasmin 11 6.55 0.0028 2.13
P53396 ACLY ATP-citrate synthase 3 2.38 0.0167 2.44
O00264 PGRC1 Membrane-associated progesterone receptor component 1 3 1.89 0.0380 1.58
O15260 SURF4 Surfeit locus protein 4 3 1.50 0.0465 2.03
Q96L21 RL10L 60S ribosomal protein L10-like 1 1.26 0.0498 2.51
P49411 EFTU Elongation factor Tu, mitochondrial 3 1.22 0.0239 1.92
P11310 ACADM Medium-chain specific acyl-CoA dehydrogenase, mitochondrial 1 0.47 0.0198 2.11
Q3LXA3 DHAK Dihydroxyacetone kinase 4 0.27 0.0227 2.44
P00966 ASSY Argininosuccinate synthase 5 0.17 0.0069 2.65
P02768 ALBU Serum albumin 30 0.11 0.0001 1.27
P54727 RD23B UV excision repair protein RAD23 homolog B 1 0.01 0.0189 2.78
P01860 IGHG3 Ig gamma-3 chain C region 4 0.01 0.0184 2.54
P22570 ADRO NADPH:adrenodoxin oxidoreductase, mitochondrial 1 0.01 0.0188 2.42
A6NL28 TPM3L Putative tropomyosin alpha-3 chain-like protein 1 0.01 0.0186 2.36
Q92530 PSMF1 Proteasome inhibitor PI31 subunit 2 0.01 0.0191 2.70
Q93099 HGD Homogentisate 1,2-dioxygenase 1 0.01 0.0184 2.54
P20073 ANXA7 Annexin A7 1 0.01 0.0187 2.27
Q8NI22 MCFD2 Multiple coagulation factor deficiency protein 2 1 0.01 0.0181 2.27
P50991 TCPD T-complex protein 1 subunit delta 1 0.01 0.0187 2.29
O15269 SPTC1 Serine palmitoyltransferase 1 1 0.01 0.0186 2.29
P62834 RAP1A Ras-related protein Rap-1A 1 0.01 0.0182 2.29
Q9Y617 SERC Phosphoserine aminotransferase 1 0.01 0.0177 2.29
Q14847 LASP1 LIM and SH3 domain protein 1 1 0.01 0.0189 2.29
O00410 IPO5 Importin-5 1 0.01 0.0185 2.29
Q9Y5Z4 HEBP2 Heme-binding protein 2 1 0.01 0.0184 2.29
Q9UIJ7 KAD3 GTP:AMP phosphotransferase mitochondrial 1 0.01 0.0182 2.29
P38117 ETFB Electron transfer flavoprotein subunit beta 2 0.01 0.0189 2.29
P46977 STT3A Dolichyl-diphosphooligosaccharide–protein glycosyltransferase subunit STT3A
1 0.01 0.0200 2.29
P08572 CO4A2 Collagen alpha-2(IV) chain 1 0.01 0.0191 2.29
P14868 SYDC Aspartyl-tRNA synthetase, cytoplasmic 1 0.01 0.0177 2.29
Table 5.73 proteins showed differences in expression levels between HCC groups at male group compared to female group.
Accession
Gene
symbol Name
Peptides
(95%) 114:115 PVal EF
Q06210 GFPT1 Glucosamine–fructose-6-phosphate aminotransferase [isomerizing] 1
1 87.90 0.0493 2.29
P14868 SYDC Aspartyl-tRNA synthetase, cytoplasmic 1 87.90 0.0490 2.29
Q01534 TSPY1 Testis-specific Y-encoded protein 1 1 87.90 0.0397 2.29
Q00839 HNRPU Heterogeneous nuclear ribonucleoprotein U 1 83.95 0.0494 2.27
P68371 TBB2C Tubulin beta-2C chain 13 73.11 0.0487 2.42
O75891 FTHFD 10-formyltetrahydrofolate dehydrogenase 5 13.68 0.0021 1.89
P02768 ALBU Serum albumin 30 8.71 0.0000 1.28
P08670 VIME Vimentin 8 6.67 0.0143 2.33
Q99880 H2B1L Histone H2B type 1-L 9 5.92 0.0483 2.07
P54868 HMCS2 Hydroxymethylglutaryl-CoA synthase, mitochondrial 8 3.44 0.0112 2.49
P09525 ANXA4 Annexin A4 5 2.58 0.0218 2.19
P18206 VINC Vinculin 2 1.94 0.0148 2.03
P07737 PROF1 Profilin-1 3 1.77 0.0154 2.15
P11586 C1TC C-1-tetrahydrofolate synthase, cytoplasmic 4 1.71 0.0273 1.42
P05023 AT1A1 Sodium/potassium-transporting ATPase subunit alpha-1 2 1.37 0.0491 2.16
Q04828 AK1C1 Aldo-keto reductase family 1 member C1 4 1.19 0.0180 1.87
P33121 ACSL1 Long-chain-fatty-acid–CoA ligase 1 3 0.69 0.0337 1.61
O15260 SURF4 Surfeit locus protein 4 3 0.69 0.0393 1.58
Q9Y6C9 MTCH2 Mitochondrial carrier homolog 2 4 0.65 0.0346 1.34
P35579 MYH9 Myosin-9 15 0.63 0.0055 1.25
P08684 CP3A4 Cytochrome P450 3A4 4 0.63 0.0251 1.34
P51659 DHB4 Peroxisomal multifunctional enzyme type 2 4 0.57 0.0486 1.61
P00167 CYB5 Cytochrome b5 4 0.56 0.0011 1.98
P00480 OTC Ornithine carbamoyltransferase, mitochondrial 1 0.55 0.0349 2.36
Q13228 SBP1 Selenium-binding protein 1 2 0.55 0.0283 2.16
P07237 PDIA1 Protein disulfide-isomerase 14 0.45 0.0002 1.66
P05062 ALDOB Fructose-bisphosphate aldolase B 10 0.38 0.0084 1.91
P07099 HYEP Epoxide hydrolase 1 8 0.33 0.0313 1.82
P38646 GRP75 Stress-70 protein, mitochondrial 7 0.31 0.0449 1.66
P05091 ALDH2 Aldehyde dehydrogenase, mitochondrial 3 0.14 0.0161 2.18
Q9UNW1 MINP1 Multiple inositol polyphosphate phosphatase 1 1 0.01 0.0196 2.21
Q04917 1433F 14-3-3 protein eta 2 0.01 0.0173 2.36
Q6UX53 MET7B Methyltransferase-like protein 7B 1 0.01 0.0184 2.18
O75608 LYPA1 Acyl-protein thioesterase 1 1 0.01 0.0184 2.35
Q16629 SFRS7 Splicing factor, arginine/serine-rich 7 1 0.01 0.0168 2.45
P10606 COX5B Cytochrome c oxidase subunit 5B, mitochondrial 2 0.01 0.0182 2.28
P02786 TFR1 Transferrin receptor protein 1 1 0.01 0.0189 2.04
Q8N0X4 CLYBL Citrate lyase subunit beta-like protein,mitochondrial 1 0.01 0.0176 2.44
O94905 ERLN2 Erlin-2 1 0.01 0.0191 2.33
P55263 ADK Adenosine kinase 1 0.01 0.0199 2.27
Q9Y2Q3 GSTK1 Glutathione S-transferase kappa 1 1 0.01 0.0185 2.27
P62310 LSM3 U6 snRNA-associated Sm-like protein LSm3 2 0.01 0.0181 2.25
P04632 CPNS1 Calpain small subunit 1 1 0.01 0.0191 2.27
P84090 ERH Enhancer of rudimentary homolog 2 0.01 0.0181 2.27
P48147 PPCE Prolyl endopeptidase 1 0.01 0.0197 2.29
P05165 PCCA Propionyl-CoA carboxylase alpha chain, mitochondrial 1 0.01 0.0195 2.29
P49588 SYAC Alanyl-tRNA synthetase, cytoplasmic 2 0.01 0.0192 2.29
protein levels were significantly increased after transfected with lentiviral encoding TSPY1 cDNA. And to the contrary, it was decreased in the MHCC97H cells silenced the expression of TSPY1 with shRNA (Figure 5A and 5B). CCK8 assay indicated that both in SMMC7721 and Huh7 cells over-expressed TSPY1 consistently presented higher proliferative activities than the control parent cells (Figure 5C). In the TSPY1 knockdown experiments, the cell proliferation were reduced obviously in the MHCC97H cells silenced the expression of TSPY1 with shRNA compared to the mock group (Figure 5C).
We also examined the rate of apoptosis under the circumstance of over-expressed or knockdown the expression of TSPY1 in HCC cells using flow cytometry analysis. The apoptosis rate in SMMC7721 cell over-expressed TSPY1(4.260.2%) was lower than the SMMC7721 cell transfected with the GFP-lentivirus (11.6261.45%), p,0.05. The similar result was found in the comparison between Huh7 cell over-expressed TSPY1 (10.362%) and control cell (14.760.32%), but without significant difference (p= 0.19). While, in the TSPY1 knockdown experiments, the apoptosis rate of the shRNA-mediated suppression of TSPY1 in MHCC97-H cells were higher (14.761.87% for shRNA-1, 18.361.7% for shRNA-2) than the mock group (11.461.8%), and the p values were 0.2 and 0.06, respectively. These data
implied that TSPY1 could promote cell proliferation through inhibiting apoptosis.
Over-expression of TSPY1 Increases the Colony Formation in SMMC7721 Cell
Flag-TSPY1, GFP containing lentivirus transfected SMMC 7721 cells were analyzed with soft agar colonization assay. It was found that TSPY1 over-expressed SMMC7721 cells acquired stronger ability in soft agar colonization than the cells transfected with GFP (Figure 5D). While we use the lentivirus-mediated shRNA to silence the expression of TSPY1 in the TSPY1 over-expressed SMMC7721 cell, the cell ability of soft agar colonization was significantly declined (Figure 5E). These findings suggest that ectopic expression of TSPY1 potentiates the efficiency of cell colony formation.
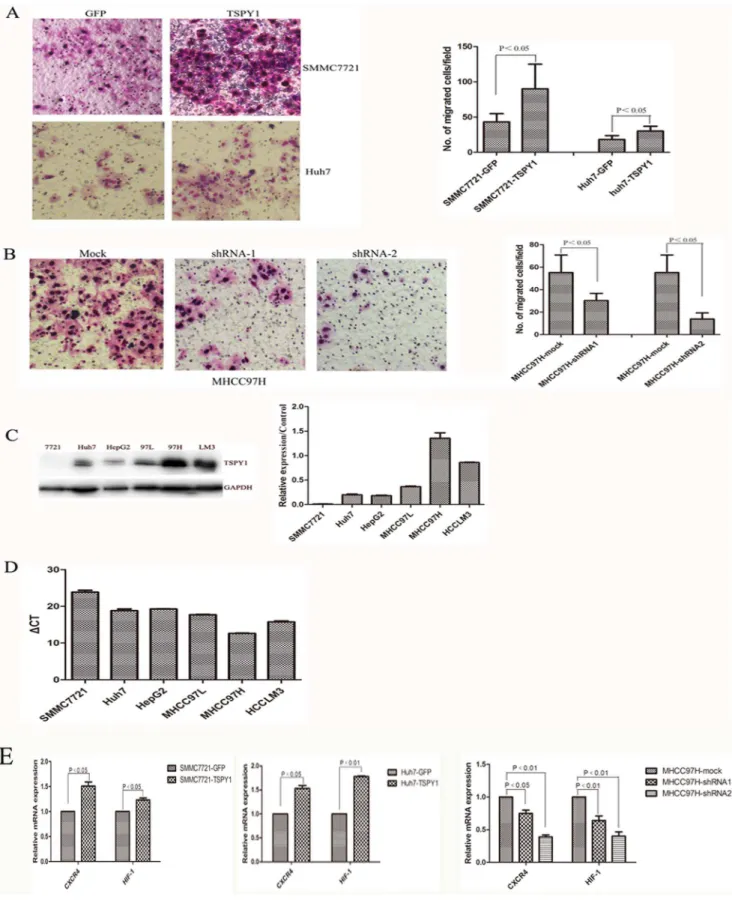
TSPY1 Promotes Cell Invasion
To determine the effects of ectopic TSPY1 expression in cell invasion, Flag-TSPY1, shRNA transfected cells and the respective control cells were analyzed with the transwell invasion assay. TSPY1 over-expression in both SMMC7721 and Huh7 cells led to a marked increasing cell invasive ability (p,0.05, Figure 6A). While effective silencing of TSPY1 expression in MHCC97H cell significantly decreased the invasive ability compared to the mock
Table 5.Cont.
Accession
Gene
symbol Name
Peptides
(95%) 114:115 PVal EF
Q07065 CKAP4 Cytoskeleton-associated protein 4 1 0.01 0.0192 2.29
Q9NVI7 ATD3A ATPase family AAA domain-containing protein 3A 1 0.01 0.0191 2.29
Q16795 NDUA9 NADH dehydrogenase [ubiquinone] 1 alpha subcomplex subunit 9, mitochondrial
1 0.01 0.0190 2.29
Q00325 MPCP Phosphate carrier protein, mitochondrial 1 0.01 0.0187 2.29
P27105 STOM Erythrocyte band 7 integral membrane protein 1 0.01 0.0186 2.29
P30712 GSTT2 Glutathione S-transferase theta-2 1 0.01 0.0186 2.29
Q9Y262 IF3EI Eukaryotic translation initiation factor 3 subunit E-interacting protein
1 0.01 0.0185 2.29
O95487 SC24B Protein transport protein Sec24B 1 0.01 0.0184 2.29
P62263 RS14 40S ribosomal protein S14 1 0.01 0.0183 2.29
P13798 ACPH Acylamino-acid-releasing enzyme 1 0.01 0.0181 2.29
O75964 ATP5L ATP synthase subunit g, mitochondrial 1 0.01 0.0181 2.29
Q96I99 SUCB2 Succinyl-CoA ligase [GDP-forming] subunit beta, mitochondrial 1 0.01 0.0181 2.29
P50336 PPOX Protoporphyrinogen oxidase 1 0.01 0.0180 2.29
P04196 HRG Histidine-rich glycoprotein 1 0.01 0.0180 2.29
Q02318 CP27A Cytochrome P450 27, mitochondrial 2 0.01 0.0179 2.29
P55157 MTP Microsomal triglyceride transfer protein large subunit 1 0.01 0.0179 2.29
Q9BXK5 B2L13 Bcl-2-like 13 protein 1 0.01 0.0178 2.29
P51687 SUOX Sulfite oxidase, mitochondrial 1 0.01 0.0177 2.29
Q9BVK6 TMED9 Transmembrane emp24 domain-containing protein 9 1 0.01 0.0177 2.29
Q96EY8 MMAB Cob (I)yrinic acid a,c-diamide adenosyltransferase, mitochondrial 1 0.01 0.0177 2.29
P05093 CP17A Cytochrome P450 17A1 1 0.01 0.0175 2.29
Q9Y5M8 SRPRB Signal recognition particle receptor subunit beta 1 0.01 0.0173 2.29
P01011 AACT Alpha-1-antichymotrypsin 1 0.01 0.0172 2.29
P02743 SAMP Serum amyloid P-component 1 0.01 0.0166 2.29
Q02338 BDH D-beta-hydroxybutyrate dehydrogenase, mitochondrial 1 0.01 0.0164 2.29
group (p,0.05, Figure 6B). Analogously, the expression of TSPY1 in HCC cell lines was examined using western blot and RT-PCR. According to western blot analysis, the expression of TSPY1 was positively correlated with the metastatic potential of the HCC cell lines. TSPY1 protein levels in MHCC97H and HCCLM3 cells were significantly higher than those in MHCC97L, HepG2, SMMC7721 and Huh7 cells (Figure 6C). In concordance with the expression of protein, the mRNA level of TSPY1 also highly expressed in high metastatic MHCC97H and HCCLM3 cells, Figure 6D showed the value ofgCT (gCT = CTTSPY1-CTb-actin)
in HCC cell lines respectively. To determine the molecular basis of how TSPY1 enhanced invasive abilities of HCC cells, we next examined two invasion-related genes CXC chemokine receptor 4 (CXCR4) and hypoxia inducible factor-1 (HIF-1) that are known to play major role in tumor metastasis. Figure 6E showed the results of the RT-PCR from SMMC7721 and Huh7 over-expressing TSPY1, CXCR4 and HIF-1 were up-regulated about 1.5 fold. On the contrary, CXCR4 and HIF-1 were dramatically decreased in the knockdown study of MHCC97H cell (Figure 6E). These findings indicated that ectopic expression of TSPY1 was associated with HCC metastasis.
TSPY1 may be Included in the Regulation of AR Expression Involved in Male HCC
TSPY1 encoded on the mammalian Y chromosome was assumed to have male-specific functions. Like TSPY1, AR plays a pivotal role in male-specific biological events also [17]. Owing to TSPY1 was significantly up-regulated in male HCC; it may give rise to an interesting question whether there was a functional
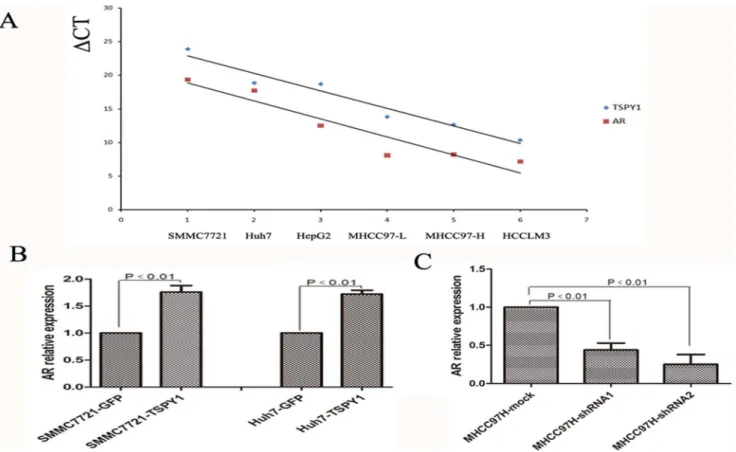
interplay between TSPY1 and AR in male HCC. To test our hypothesis, RT-PCR was used to examine the expression of TSPY1 and AR in HCC cell lines. The Pearson method was applied to assess the correlation between TSPY1 and AR. The results documented that TSPY1 and AR mRNA were coordi-nately expressed among HCC cell lines, and the correlation coefficient R was 0.84(p,0.01). TSPY1 and AR mRNA were co-expressed at a higher level in MHCC97H and HCCLM3 cells than in MHCC97L, HepG2, SMMC7721 and Huh7 cells (Figure 7A). To investigate the expression of TSPY1 and AR in HCC tissue, RT-PCR was used to detect the expression of AR in male HCC tissue dots. The result of western blot from male HCC tissue suggested that TSPY1 protein had increased along with AR expression (data not show).
The mRNA expression of AR in HCC cells under the conditions of TSPY1 over-expression and down-regulation was also determined. It was found that increased expression of TSPY1 in SMMC7721 and Huh7 cells caused an elevated expression of AR by more than 1.5-fold compared to the control cells (Figure 7B). While knockdown of TSPY1 resulted in a substantial decreased expression of AR in MHCC97H cells (Figure 7C). According to the previous study that AR could promote HCC progression, we can speculate that TSPY1 may be included in the regulation of AR expression involved in male HCC.
Discussion
HCC is a male-predominant cancer associated with chronic viral hepatitis. In our study, quantitative proteomics technology was used to screen the differential proteins between male and
Figure 2. GO analysis for the differential proteins in HBV based HCC of sex-related disparity.A, Subcellular distributions of differential
proteins; B, Biological process of differential proteins; C, Molecular function of differential proteins. doi:10.1371/journal.pone.0089219.g002
Figure 3. TSPY1, AK1C1, B2L13 and CP27A were detected in 38 male and 14 female HCC tissues by RT-PCR. TSPY1 and AK1C1 were increased in male HCC, B2L13 and CP27A were decreased in male HCC.
female HCC tissue. All specimens excluded the recurrence and chemotherapy cases were confirmed as primary HCC without metastasis by clinical pathology. This could reduce the heteroge-neity among tissues. Finally 109 differential proteins were identified through iTRAQ-2DLC-ESI-MS/MS analysis between normal and HCC tissues. Interestingly, some of them were definitely expressed both in normal and HCC tissues. In case of cytochrome b5(CYB5), it expressed at a higher level in normal male tissue than in normal female, but its expression was lower in male HCC than in female HCC tissue. Cytochrome P450 can convert testosterone to eight metabolites inactivating testosterone in the liver [18]. The decreased expression of CYB5 could increase the amount of testosterone which conducive to male HCC via androgen pathway. HBV was the leading cause of human HCC. The ability of stress resistance for host hepatocytes was reduced during the progress of HBV reproduction and leading oxidative damage of hepatocytes. In contrast to the normal group, the oxidative stress related proteins Cytochrome P450 17A1(CYP27A1), Fructose-bisphosphate aldolase B (ALDOB), Stress-70 protein (GRP75), Ornithine carbamoyltransferase (OTC) and so on were decreased in the HCC group. It is noteworthy that a large number of antioxidant proteasome were down-regulated in the male HCC tissue. So the oxidative damage caused by HBV of male is more serious than that of female, it may be the potential mechanisms leading the fast progress of HCC in male than in female.
Thirteen of the differential proteins we screened have been identified in previous study [19]. For example, heat shock protein beta-1(HSPB1) was found as increasing biomarker for HCC. TSPY1 was chosen for further study since (1) TSPY1was only found in male HCC group with a significant difference. (2) It was considered as a candidate oncogene for gonadoblastoma [20] and (3) the exact mechanisms of its postulated oncogenic are still unclear. TSPY1 is a member of the TSPY superfamily which located on the pericentromeric region of the short arm on the Y chromosome [21]. TSPY is normally expressed in testis predom-inantly in spermatogonia and serve vital functions in male germ cell development and spermatogenesis [22]. The abnormal expression of TSPY were observed in early and late stages of gonadoblastoma, testicular carcinoma in situ [23], prostate cancer [24] and melanoma [25]. In our study, the male-specific TSPY1 was significantly elevated with the comparison of male HCC tissue to female HCC tissue. This result was verified by RT-PCR and western blot using male and female clinic tissues. In concordance with previous study, TSPY was up-regulated in HCC patients suggested that it was a novel cancer testis antigen and a potential candidate in vaccine strategy for immunotherapy in HCC patients [26].
A series of experiments were performed to determine the role of TSPY1 in HCC cells. We found that TSPY1 could potentiate HCC cells proliferation and inhibit apoptosis. TSPY can bind
cyclin B at its SET/NAP domains, enhance cyclin B-CDK1 kinase activity, and promote cell proliferation via propelling a rapid G2/ M transition in the cell cycle [23,27]. Shane found that over-expression of TSPY promoted cell proliferation in HeLa and NIH3T3 cells and the expression of TSPY can affect numerous cell cycle and apoptosis gene analyzed by microarray analysis [28]. TSPY play a catalytic role in the development of many cancers. Tatsuo suggested that TSPY could interact with translation elongation factor eEF1A, via enhancing protein synthesis and gene transcription to exert its oncogenic function [29]. In our study, we also confirmed that ectopic expression of TSPY1 in HCC SMMC7721 cell increased the colony formation efficiency. This result was consistent with the previous study which indicated that TSPY formed higher numbers of colonies in vitro and enhanced tumor growth in vivo [28]. Lauren demonstrated that TSPY1 presented in most gonadoblastomas using interphase fluorescent in situ hybridization assay [20]. All of our data taken together supported the notion that TSPY1 was a growth-promoting gene and provided a new insight of abundant TSPY1 expression in male HCC tissues. Furthermore, we also found that recombinant TSPY1 significantly increased invasive ability of HCC cells. This is the first study to determine the effects of TSPY1 in cell invasion. Meanwhile, TSPY1 was also significantly high expressed in high metastatic MHCC97H and HCCLM3 cells which confirmed our results plenty. However, mechanisms of TSPY1 how to influence tumor metastasis are still unclear. CXCR4 and HIF-1 were significantly up-regulated in over-expressing TSPY1 SMMC7721 and Huh7 cells, while down-regulated in the TSPY1 knockdown MHCC97H cell. Previous study indicated that CXCR4 were highly expressed in HCC, and its ligand chemokine (C-X-C motif) ligand 12 (CXCL12) CXCL12 can stimulate human hepatoma cell growth, migration and invasion [30]. The level of CXCR4 also associated with lymph node metastasis of HCC, it was considered as an independent prognostic factor for HCC with lymph node metastasis [31]. Esther found that over-activation of the TGF-b pathway via increasing expression of CXCR4 conferred HCC cells migratory properties [32]. HIF-1 plays a key role in tumor angiogenesis because of activation human VEGF genes. Its subunit (HIF-1a) over-expressed in HCC was significantly associated with tumor angiogenesis, invasion and metastasis and poor prognosis [33]. All these results indicated that TSPY1 played a critical role in HCC metastasis via interacting with invasion-related factors.
TSPY1 and AR were both encoded by Y chromosome gene inextricably linked with male. The liver is the target organ of androgen action, as AR can enhance HBV transcription promoting hepatocarcinogenesis and TSPY1 also highly expressed in male HCC tissue, cross-talk between AR and TSPY1 is conceivable. In the present study, TSPY1 and AR had a dramatic positive correlation in HCC cell lines as well as in male HCC tissue. TSPY1 and AR were expressed at a high level in high metastatic HCC cells and a low level in low or no metastatic HCC cells. In HBV based male HCC tissue, TSPY1 was increased with the AR expression. To further validate the correlation between TSPY1 and AR, we used full length TSPY1 cDNA and shRNA-TSPY1 virus transected HCC cells. The results showed that over-expression of TSPY1 significantly increased the over-expression of AR, while knockdown of TSPY1 resulted in a substantial decreasing AR level. These results indicated that TSPY1 may be included in the regulation of AR expression involved in male HCC. However, the AR coregulatory function of TSPY1 in the male HCC remains unclear. Future work will aim to clarify the mechanism of TSPY1 participate in the regulation of AR expression involved in male HCC progress.
Figure 4. The result of western blot for TSPY1 protein in male and female HCC, and normal liver tissue (N-M: normal male liver tissue; N-F: normal female liver tissue; HCC-M: male HCC tissue; HCC-F: female HCC tissue).
Figure 5. Function analysis of TSPY1 in HCC cells.(A and B), RT-PCR and western blot were used to detect TSPY1 expression in the TSPY1 over-expressing or knockdown HCC cells. C, CCK8 assay detected the cell proliferation after over-over-expressing or knockdown TSPY1. (D and E), Soft agar colonization of SMMC7721 cell over-expressing or knockdown TSPY1. All this data are from three independent experiments.
Figure 6. TSPY1 enhances invasion ablity of HCC cells. A, Over-expression of TSPY1 in SMMC7721 and Huh7 cells exhibited enhancing invasion ability compared to control cells (Data are shown as mean6SD,p,0.05, 1006). B, Silencing TSPY1 expression in MHCC97H cell inhibits cell
invasion (Data are shown as mean6SD,p,0.05, 1006). C, Western blot was used to detect TSPY1 expression in HCC cell lines. D, RT-PCR was used to
detect TSPY1 expression in HCC cell lines. E,Over-expressing TSPY1 increased the expression of CXCR4 and HIF-1 in SMMC7721 and Huh7, while suppressed CXCR4 and HIF-1 expression in the shRNA-TSPY1 MHCC97H cell. All this data are from three independent experiments.
In summary, TSPY1 was identified and significantly increased in male HCC tissues. We demonstrate that TSPY1 can potentiate the ability of cell proliferation, colony formation and invasion. Our data also indicate that TSPY1 may be involved in male HCC progress via participating in the regulation of AR expression. These findings will present new insights into mechanism of male HCC and provide a potential therapeutic target.
Author Contributions
Conceived and designed the experiments: SL CM SH XQ Y. Liu. Performed the experiments: SL CM SH Y. Lu QP. Analyzed the data: S. Li JW YD XQ. Contributed reagents/materials/analysis tools: SL CM SY XQ. Wrote the paper: SL CM SH XQ Y. Liu.
References
1. Parkin DM, Bray F, Ferlay J, Pisani P (2005) Global cancer statistics, 2002. CA Cancer J Clin 55: 74–108.
2. El-Serag HB, Rudolph KL (2007) Hepatocellular carcinoma: epidemiology and molecular carcinogenesis. Gastroenterology 132: 2557–2576.
3. Zhao Y, Lee WN, Xiao GG (2009) Quantitative proteomics and biomarker discovery in human cancer. Expert Rev Proteomics 6: 115–118.
4. Niu D, Sui J, Zhang J, Feng H, Chen WN (2009) iTRAQ-coupled 2-D LC-MS/ MS analysis of protein profile associated with HBV-modulated DNA methylation. Proteomics 9: 3856–3868.
5. Chaerkady R, Harsha HC, Nalli A, Gucek M, Vivekanandan P, et al. (2008) A quantitative proteomic approach for identification of potential biomarkers in hepatocellular carcinoma. J Proteome Res 7: 4289–4298.
6. Donato F, Tagger A, Gelatti U, Parrinello G, Boffetta P, et al. (2002) Alcohol and hepatocellular carcinoma: the effect of lifetime intake and hepatitis virus infections in men and women. Am J Epidemiol 155: 323–331.
7. Naugler WE, Sakurai T, Kim S, Maeda S, Kim K, et al. (2007) Gender disparity in liver cancer due to sex differences in MyD88-dependent IL-6 production. Science 317: 121–124.
8. Zender L, Kubicka S (2008) Androgen receptor and hepatocarcinogenesis: what do we learn from HCC mouse models? Gastroenterology 135: 738–740. 9. Taylor BC, Yuan JM, Shamliyan TA, Shaukat A, Kane RL, et al. (2009)
Clinical outcomes in adults with chronic hepatitis B in association with patient and viral characteristics: A systematic review of evidence. Hepatology 49: S85– 95.
10. Yu MW, Yang YC, Yang SY, Cheng SW, Liaw YF, et al. (2001) Hormonal markers and hepatitis B virus-related hepatocellular carcinoma risk: a nested case-control study among men. J Natl Cancer Inst 93: 1644–1651.
11. Wu MH, Ma WL, Hsu CL, Chen YL, Ou JH, et al. (2010) Androgen receptor promotes hepatitis B virus-induced hepatocarcinogenesis through modulation of hepatitis B virus RNA transcription. Sci Transl Med 2: 32ra35.
12. Wang C, Guo K, Gao D, Kang X, Jiang K, et al. (2011) Identification of transaldolase as a novel serum biomarker for hepatocellular carcinoma metastasis using xenografted mouse model and clinic samples. Cancer Lett 313: 154–166.
13. Tian J, Tang ZY, Ye SL, Liu YK, Lin ZY, et al. (1999) New human hepatocellular carcinoma (HCC) cell line with highly metastatic potential (MHCC97) and its expressions of the factors associated with metastasis. Br J Cancer 81: 814–821.
14. Chong PK, Lee H, Zhou J, Liu SC, Loh MC, et al. (2010) ITIH3 is a potential biomarker for early detection of gastric cancer. J Proteome Res 9: 3671–3679. 15. Svacinova V, Vodicka R, Vrtel R, Godava M, Kvapilova M, et al. (2011) Sequence recombination in exon 1 of the TSPY gene in men with impaired fertility. Biomed Pap Med Fac Univ Palacky Olomouc Czech Repub 155: 287– 298.
16. Page DC (1987) Hypothesis: a Y-chromosomal gene causes gonadoblastoma in dysgenetic gonads. Development 101 Suppl: 151–155.
17. Wang RS, Yeh S, Tzeng CR, Chang C (2009) Androgen receptor roles in spermatogenesis and fertility: lessons from testicular cell-specific androgen receptor knockout mice. Endocr Rev 30: 119–132.
Figure 7. Over-expression of TSPY1 can up-regulate the expression of AR.A, TSPY1 and AR were similarly expressed among HCC cell lines
analyzing by RT-PCR (gCT = CTTSPY1/AR2CTb-actin). (B and C), TSPY1 elevated expression of AR in SMMC7721 and Huh7 cells compared with the control
18. Halvorson M, Greenway D, Eberhart D, Fitzgerald K, Parkinson A (1990) Reconstitution of testosterone oxidation by purified rat cytochrome P450p (IIIA1). Arch Biochem Biophys 277: 166–180.
19. Lee NP, Chen L, Lin MC, Tsang FH, Yeung C, et al. (2009) Proteomic expression signature distinguishes cancerous and nonmalignant tissues in hepatocellular carcinoma. J Proteome Res 8: 1293–1303.
20. Hertel JD, Huettner PC, Dehner LP, Pfeifer JD (2010) The chromosome Y-linked testis-specific protein locus TSPY1 is characteristically present in gonadoblastoma. Hum Pathol 41: 1544–1549.
21. Salo P, Kaariainen H, Petrovic V, Peltomaki P, Page DC, et al. (1995) Molecular mapping of the putative gonadoblastoma locus on the Y chromosome. Genes Chromosomes Cancer 14: 210–214.
22. Kido T, Lau YF (2005) A Cre gene directed by a human TSPY promoter is specific for germ cells and neurons. Genesis 42: 263–275.
23. Lau YF, Li Y, Kido T (2009) Gonadoblastoma locus and the TSPY gene on the human Y chromosome. Birth Defects Res C Embryo Today 87: 114–122. 24. Singh AP, Bafna S, Chaudhary K, Venkatraman G, Smith L, et al. (2008)
Genome-wide expression profiling reveals transcriptomic variation and per-turbed gene networks in androgen-dependent and androgen-independent prostate cancer cells. Cancer Lett 259: 28–38.
25. Gallagher WM, Bergin OE, Rafferty M, Kelly ZD, Nolan IM, et al. (2005) Multiple markers for melanoma progression regulated by DNA methylation: insights from transcriptomic studies. Carcinogenesis 26: 1856–1867.
26. Yin YH, Li YY, Qiao H, Wang HC, Yang XA, et al. (2005) TSPY is a cancer testis antigen expressed in human hepatocellular carcinoma. Br J Cancer 93: 458–463.
27. Lau YF, Li Y, Kido T (2011) Role of the Y-located putative gonadoblastoma gene in human spermatogenesis. Syst Biol Reprod Med 57: 27–34.
28. Oram SW, Liu XX, Lee TL, Chan WY, Lau YF (2006) TSPY potentiates cell proliferation and tumorigenesis by promoting cell cycle progression in HeLa and NIH3T3 cells. BMC Cancer 6: 154.
29. Kido T, Lau YF (2008) The human Y-encoded testis-specific protein interacts functionally with eukaryotic translation elongation factor eEF1A, a putative oncoprotein. Int J Cancer 123: 1573–1585.
30. Schimanski CC, Bahre R, Gockel I, Muller A, Frerichs K, et al. (2006) Dissemination of hepatocellular carcinoma is mediated via chemokine receptor CXCR4. Br J Cancer 95: 210–217.
31. Xiang ZL, Zeng ZC, Tang ZY, Fan J, Sun HC, et al. (2010) [Nuclear accumulation of CXCR4 and overexpressions of VEGF-C and CK19 are associated with a higher risk of lymph node metastasis in hepatocellular carcinoma]. Zhonghua Zhong Liu Za Zhi 32: 344–349.
32. Bertran E, Crosas-Molist E, Sancho P, Caja L, Lopez-Luque J, et al. (2013) Overactivation of the TGF-beta pathway confers a mesenchymal-like phenotype and CXCR4-dependent migratory properties to liver tumor cells. Hepatology. 33. Semenza GL (2003) Targeting HIF-1 for cancer therapy. Nat Rev Cancer 3: