Age-Related Onset of Obesity Corresponds
with Metabolic Dysregulation and Altered
Microglia Morphology in Mice Deficient for
Ifitm Proteins
Yin Shen Wee1, Janis J. Weis1, Lorise C. Gahring2,3, Scott W. Rogers2,4, John H. Weis1*
1Department of Pathology, Division of Microbiology and Immunology, University of Utah School of Medicine, Salt Lake City, Utah, United States of America,2Geriatric Research, Education and Clinical Center (GRECC), Veterans Affairs Medical Center, Salt Lake City, Utah, United States of America,3Department of Internal Medicine, Division of Geriatrics, University of Utah School of Medicine, Salt Lake City, Utah, United States of America,4Department of Neurobiology and Anatomy, Salt Lake City, Utah, United States of America
*john.weis@path.utah.edu
Abstract
TheIfitmDelmouse lacks all five of theIfitmgenes via LoxP deletion. This animal breeds nor-mally with no obvious defect in development. TheIfitmDelanimals exhibit a steady and sig-nificantly enhanced weight gain relative to wild-type controls beginning about three months of age and under normal feeding conditions. The increased weight corresponds with elevat-ed fat mass, and in tolerance tests they are hyporesponsive to insulin but respond normally to glucose. Both young (4 mo) and older (12 mo)IfitmDelmice have enhanced levels of serum leptin suggesting a defect in leptin/leptin receptor signaling. Analysis of the gene ex-pression profiles in the hypothalamus ofIfitmDelanimals, compared to WT, demonstrated an altered ratio ofPomcandNpyneuropeptide expression, which likely impairs the satiation response of theIfitmDelanimal leading to an increased eating behavior. Also elevated in hy-pothalamus of IfitmDel mice were pro-inflammatory cytokine expression and reduced IL-10. Anatomical analysis of the hypothalamus using immunohistochemistry revealed that micro-glia exhibit an abnormal morphology inIfitmDelanimals and respond abnormally to Poly:IC challenge. These abnormalities extend the phenotype of the IfitmDel mouse beyond abnor-mal responses to viral challenge to include a metabolic phenotype and weight gain. Further, this novel phenotype for theIfitmDelmouse could be related to abnormal neuropeptide pro-duction, inflammatory status and microglia status in the hypothalamus.
Introduction
The interferon-induced transmembrane gene family (Ifitm) consists of four genes in humans and five in the mouse that encode very similar proteins of 40–60 residues. Each Ifitm protein consists of a unique extracellular N-terminus, a highly conserved transmembrane domain, and OPEN ACCESS
Citation:Wee YS, Weis JJ, Gahring LC, Rogers SW, Weis JH (2015) Age-Related Onset of Obesity Corresponds with Metabolic Dysregulation and Altered Microglia Morphology in Mice Deficient for Ifitm Proteins. PLoS ONE 10(4): e0123218. doi:10.1371/journal.pone.0123218
Academic Editor:Raul M. Luque, University of Cordoba, SPAIN
Received:December 18, 2014
Accepted:March 1, 2015
Published:April 9, 2015
Copyright:This is an open access article, free of all copyright, and may be freely reproduced, distributed, transmitted, modified, built upon, or otherwise used by anyone for any lawful purpose. The work is made available under theCreative Commons CC0public domain dedication.
Data Availability Statement:All relevant data are within the paper.
Funding:National Institutes of Health grants AI32773 (JHW) and AI45521 (JJW), DA025057 (LCG,SWR) and a VA Merit grant I01BX001798 (LCG). The funders had no role in study design, data collection and analysis, decision to publish, or preparation of the manuscript.
transcriptional response to type I and type II interferon induction[8]. Ifitm3 was shown in a broad siRNA screen to be essential for the interferon-induced cellular resistance to viruses that infect from the endosomal compartment to the cytoplasm such as influenza and dengue [4,5,9,10]. A defective human IFITM3 allele has been linked to increased severity of human in-fections to influenza virus [11] and we have recently shown this same allele is linked to coro-nary heart damage associated with Kawasaki Disease, an immune inflammation of unknown initiation [12]. A number of models have been proposed to describe the function of Ifitm3 in providing resistance to cellular infections including building a protein lattice in the membrane to block endosomal exit, blocking fusion pores during virus-endosome hemifusion, enhancing the deposition of cholesterol to also block virus exit or by blocking virus entry by enhancing the stability of the clathrin/vATPase complexes on the endosomal membrane [13–15].
The mouse Ifitm gene family encompasses about 65,000bp on mouse chromosome 7. This sec-tion of the chromosome has been removed by LoxP mediated delesec-tion to create theIfitmDel
animal which lacks all five of the Ifitm genes [16]. No other coding sequences or functional non-coding RNA’s are included within this section of the genome. TheIfitmDelanimal was originally created to test the necessity of the Ifitm proteins for germinal cell speciation [17–19] and embryo generation [20].IfitmDelanimals are generated in normal Mendelian numbers and have few if any obvious defects in development and survival [16]. We have made extensive use of these ani-mals to study the roles that the Ifitm proteins have in immune signaling pathways. As we maintain these animals as homozygous deletion lines, over time we have observed a pronounced enhanced weight gain and an obesity phenotype (e.g., [21–23]) in olderIfitmDelmice compared to C57BL/6 controls. In this report we quantify the obesity phenotype and link this to altered leptin/neuropep-tide signaling, and demonstrate abnormal microglia morphology in theIfitmDelanimal.
Materials and Methods
Animals
The mice were housed and used for this study in accordance with protocols approved in advance by the Institutional Animal Care and Use Committee at the University of Utah (Protocol Num-ber (09–07003). In all cases animals were maintained in according to the Guide for the Care and use of Laboratory Animals of the National Institutes of Health.IfitmDelmice were backcrossed for greater than 10 generations to the C57BL/6 strain. Background- and age-matched littermates were used as WT controls. These mice were fed ad libitum with normal chow. For food intake studies, mice were kept individually and a similar amount of normal chow was given to each mouse. Average three-day consumption of food was measured for 21 days.
Metabolic studies
For insulin and glucose tolerance tests, mice fasted 5 hours followed byintraperitoneal injection
Blood levels were measured at indicated time points byFreeStyle Liteblood glucose monitoring system. Blood samples were obtained from tail bleeds.
For blood tests of fasting and fed animals, including blood glucose and leptin, blood was ob-tained at 10 am and 10 pm (12h) for analysis.
Energy expenditure and locomotor activity were analyzed by indirect colorimetry using CLAMS metabolic cages, HSC Cores Research Facility at University of Utah. Body composition was determined by nuclear magnetic resonance (NMR Bruker Minispec).
RNA isolation and gene expression analysis
For RNA isolation, the hypothalamus was dissected, total RNA of the hypothalamus extracted by using QAIzol reagent kit (Qaigen), and reverse transcribed with Maloney Murine Leukemia Virus Reverse Transcriptase (M-MLV RT, Invitrogen). For qRT-PCR, 1x FastStart Universal SYBR Green Master (Roche) was used to analyze gene expression on LightCycler 480 System (Roche). The accession numbers of genesIfitm1(NM_026820.3),Ifitm2(NM_030694),Ifitm3
(NM_025378),Ifitm6(NM_001033632.1),NPY(NM_023456.2),POMC(NM_001278581),
TNFα(NM-013693),IFNβ(NM_010510),Ifit1(NM_008331),iNOS(NM_010927)IL-10
(NM_010548)IL-1β(NM_008361),F4/80(NM_010130) andactin(M12866.1). Primer sequences were as follows:Ifitm1, forward:5’-CTTCAAAAGCCGAGAGATG-3’, reverse:5’ -CCACCATCTTCCTGTCCCTA-3’;Ifitm2, forward:5’ -CCATCCTCCAGACGGGGCGATTG-3’, reverse:5’-TATTCAGGCACTTGGCAGTG-3’;Ifitm3, forward:5’-CTTTGCTCCGCAC CATGAACCA-3’, reverse:5’-AGGCACTTAGCAGTGGAGGCGT-3’;Ifitm6, forward:GAGG GATCCTGACTCAGC-3’, reverse:5’-AGCATGGGATTGGGCCCCAGTC-3’;POMC, forward: CTGCTTCAGACCTCCATAGATGTG-3’, reverse:5’-CAGCGAGAGGTCGAGTTTGC-3’;
NPY, forward:5’-TACTCCGCTCTGCGACACTA-3’, reverse:5’-GATGAGGGTGGAAAC TTGGA-3’;actin, forward:5’-GTAACAATGCCATGTTCAAT-3’, reverse:5’-CTCCATCG TGGGCCGCTCTAG-3’;IFNβ, forward:5’-CAAGAAAGGACGAACATTCG-3’, reverse:5’ -AGACATTCTGGAGCATCTCT-3’;Ifit1, forward:5’-ATGGGAGAGAATGCTGATGGTG, re-verse:5’-TGTCAAGGAACTGGACCTGCTC-3’; TNFαand IL-1β[24], IL-10, [25] F4/80 [26] and iNOS [27] can be found in indicated citations.
Histology, immunohistochemistry and microscopy
The epididymal fat pads were dissected from animal and fixed immediately in 4% paraformal-deyde in PBS overnight at 4°C. Next day, tissues were dehydrated with serial alcohol solutions (50%, 70% and 100%) at room temperature for 2 hours each. Tissues were then infiltrated in Immuno-bed resin (Polyscience, Inc.) at room temperature overnight. Tissues were moved to fresh Immuno-bed resin with catalyst (Polyscience, Inc.) at 1:25 ratio and polymerized in the mold at room temperature overnight. Tissues were carefully removed from the mold and sec-tioned to 3 microns with a rotary microtome (Thermo Scientific, Microm HM310). Tissue sections were adhered to microscope slides and proceed to H&E staining according to manu-facturer's instructions (VWR). Stained slides were mounted with cytoseal mounting medium (Fisher Scientific) before imaging. Pictures were acquired with Zeiss Axiovert 100 microscope equipped with a Microfire CCD camera (Optimetrix). Brain sections were prepared as before
[28–30]. Briefly, mice were lethally anesthetized with tribromoethanol (TBE) by intraperitoneal
Cryostat (ThermoFisher Scientific). Sections were permeabilized with 0.02% Triton (Sigma) and stained with Iba1 (Abcam), F4/80 (eBioscience), CD11b (eBioscience), GFAP (Abcam), O2A (Abcam) and MAP-2(Abcam) followed by secondary antibody FITC- or PE-conjugated anti-rabbit antibodies or Alexa Fluor 546 Goat Anti-Rat IgG (invitrogen) as appropriate.
BMDM were isolated and cultured using standard protocols (14). Cells were fixed with 4% paraformaldehyde and permeabilized with 0.02% Triton (Sigma) and stained with Iba1.
Results
The
IfitmDel
animals demonstrate enhanced adiposity
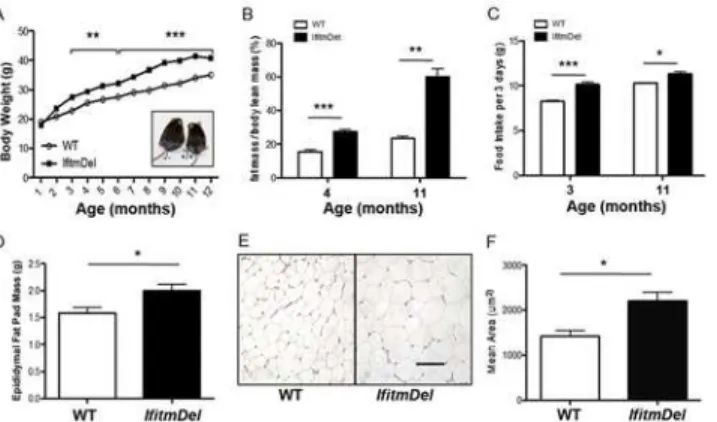
TheIfitmDelstrain possesses a defined and engineered (via Cre-Lox) chromosomal deletion of all five of theIfitmgenes on a mouse genetic background of C57BL/6[16]. No coding sequences or regulatory sequences other than those associated with theIfitmgenes are known to be lost in this deletion. Mice lacking theseIfitmgenes are fertile and thrive in colonies except for the well-described sensitivity to viral infections. In maintaining such mice in our colony we noted that the olderIfitmDelanimals were generally larger than their WT (C57BL/6) age and sex matched counterparts. To quantify these differences, body weights were taken from male mice main-tained in the colony on regular mouse chow.Fig 1A, shows the slow but significant enhanced weight gain associated with theIfitmDelanimals compared to WT. This body weight increase corresponded with an increased total fat mass as the animals aged (Fig 1B). Measurement of 3 day food intake averages for a period of 21 days shows that theIfitmDelmice consume more chow than the WT age-matched controls (Fig 1C). Also increased levels of epididymal fat de-posits were present in these (Fig 1D). Histological examination suggested the adipocyte size was increased compared to WT adipose tissue (Fig 1E) and this was confirmed by quantitation as shown inFig 1F. The same trends were observed for female mice (not shown).
Fig 1. Deletion ofIfitmgene family leads to obesity.(A) Weight of male mice on normal chow,IfitmDel: Shown is the representative weight of wild-type (n = 10–22 per point) andIfitmDel(n = 4–16 per point). Both are in the C57BL/6 genetic background. Error bars were not included for clarity. (B) Fat mass was analyzed by nuclear magnetic resonance (4-month-old, n = 4 per group; 11-month-old is: wt: n = 3,IfitmDel: n = 4). (C) Food intake was measured every three days and over a period of three weeks for each group (4-month-old n = 4 for each group; 11-month-old wt: n = 3,IfitmDel: n = 4). (D) The mass of epididymal fat depots of male mice (7–10 weeks; wt: n = 5,IfitmDel: n = 4). (E) Histological appearance of epididymal fat depots from 8-week-old mice taken from hematoxylin and eosin stained sections. Scale bar: 100μm. (F) The mean area of individual adipocytes was determined from multiple sections of H&E stained sections as shown in Panel E. For all statistical comparisons the Student’s t-test was used to evaluate significance between like groups where*= p<0.05;**= p<0.01; and***= p<0.0001.
The
IfitmDel
animals demonstrate metabolic alterations
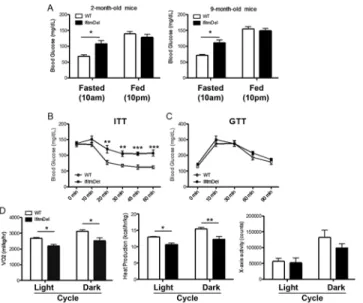
We next determined if the enhanced body weight of theIfitmDelanimals was associated with altered physiological stasis. Blood glucose levels of fasting 2 month and 9-month-old male
IfitmDelanimals were measured and observed to be consistently higher than WT (Fig 2A). However, this difference was not observed under normal feeding (fed) schedules. This differ-ence in fasting blood glucose was clear in the 2 month old animals.
Two standard tests to measure blood glucose levels are the insulin tolerance test (ITT) (Fig 2B) where blood glucose levels are quantified in fasted mice following a single injection of insu-lin and the glucose tolerance test (GTT;Fig 2C) in which blood glucose levels are quantified following a single injection glucose[31]. As shown, theIfitmDelanimals responded poorly in the ITT, maintaining higher levels of blood glucose than the WT animals. TheIfitmDeland WT animals were indistinguishable in their response in the GTT. The same trends were ob-served with femaleIfitmDelanimals (not shown). These results suggest that as theIfitmDel ani-mals age, they enter into a metabolic syndrome with a more moderate phenotype than aniani-mals displaying morbid obesity [23].
TheIfitmDelanimals were also analyzed using metabolic chambers that quantify oxygen consumption (V02), heat production, and activity (movement). As shown inFig 2Dthe Ifitm-Delanimals have reduced metabolism compared to the WT animals as reflected by lower oxy-gen consumption and decreased heat production in both the light and dark cycles. The activity of theIfitmDelanimal in the cage trended towards less than the WT in the 12 month age group, but these differences were not statistically significant.
The
IfitmDel
animals possess elevated levels of serum leptin
Mammals with a metabolic syndrome phenotype often have altered levels of leptin in the blood stream [32]. The leptin cytokine is critical in regulating appropriate food uptake [22,33,34] and we have shown (Fig 1C) that theIfitmDelmice have increased food intake. This level of food
Fig 2.IfitmDelmice develop metabolic dysfunction.(A) Blood glucose of 2- and 9-month old WT and IfitmDelmice were measured at 10 AM (fasted) or 10 PM (fed). (B) & (C) Insulin tolerance test and glucose tolerance test of male mice (20–24 weeks; n = 7 for each group). (D) Leptin levels in the blood collected from tail veins were determined by ELISA. (E) Oxygen consumption, heat production and activity measured using metabolic cages (11-month-old male mice; n = 3 for each group).*p<0.05;**p<0.01;***p<0.0001.
intake, however, is significantly less than observed with theob/obordb/dbmice. To assess lep-tin levels in theIfitmDeland control mice, two sets of male animals (4 and 12 months) were an-alyzed (Fig 3A). In order to correct for the differences in body weight, serum leptin levels are shown as ng perμl per gram of lean body mass. As shown inFig 3A, the blood leptin levels
were dramatically elevated in theIfitmDelanimal compared to WT. When blood leptin levels in mice of the same weight (e.g.,IfitmDelvs WT weighing 35 g), but differing age, were com-pared theIfitmDelanimals still consistently have higher levels of blood leptin compared to WT controls (not shown). Leptin is primarily produced by fat cells and serves, via the leptin recep-tor expressed in the hypothalamus, to regulate food intake [23,34,35]. Animals lacking leptin (ob/ob) or a functional leptin receptor (db/db) become morbidly obese due to their lack of con-trol over food intake [34].
Leptin’s actions are largely through interaction with leptin receptors expressed in the hypo-thalamus, which makes this brain region a target for the interaction between leptin and Ifitm. To confirm thatIfitmgenes are expressed by cells of the hypothalamus, the expression of
Ifitm1,Ifitm2,Ifitm3andIfitm6was quantified in the WT hypothalamus samples (Ifitm5is only expressed by osteoblasts). As shown inFig 3B,Ifitm2,Ifitm3andIfitm6are all expressed in WT tissue, withIfitm2andIfitm3showing dramatically elevated expression in older ani-mals. Therefore, the correlation between the deletion ofIfitmgenes and leptin levels occurs in both young and older mice, the olderIfitmDelmice have the added impact of not having the normal increase in these proteins seen during the aging process.
The leptin receptor, expressed by neurons in the hypothalamus, signals through a Stat3 de-pendent pathway, controlling the expression of two contrasting neuropeptides[34]. These are the proopiomelanocortin (Pomc) gene whose expression is increased upon leptin signaling while the transcription of the neuropeptide y (Npy) gene is depressed [36–39]. Bio-active
Fig 3.IfitmDelmice both show hyperleptinemia and alter levels of POMC and NPY transcripts.(A) Fasted leptin levels of 4-month-old or 12-month-old mice age matched WT (n = 3 per group) orIfitmDelmice (n = 4 per group) were compared. (B) RNA was isolated from the hypothalamus of WT young (2 months) or older (12 month) mice. The transcript levels of Ifitm1, Ifitm2, Ifitm3 and Ifitm6 were then determined using quantitative PCR as described in methods and the results normalized for transcript levels to copies expressed per 1000 actin mRNA. (C) Using the same RNA samples, transcript levels of POMC or NPY were analyzed in a similar manner.*p<0.05;**p<0.01;***p<0.0001.
peptides from the Pomc protein serve to dampen eating while those of Npy have the opposite effect and promote food intake. The expression ofPomcandNpygene transcripts were ana-lyzed from hypothalami obtained from WT andIfitmDelanimals of various ages from 1 to 12 months of age. As shown inFig 3C,IfitmDelanimals have significantly reducedPomc tran-scripts than WT suggesting that theIfitmDelanimals lack appropriate signals to depress eating. Further, theIfitmDelsamples have trending higher levels ofNpytranscripts compared to WT samples suggesting elevated Npy peptides may contribute to the positive signal to maintain feeding.
IfitmDel
mice demonstrated altered responses to chronic Type I
interferon induction
Chronic Poly I:C treatment, via activation of Tlr3 and the RIG-I-like receptors, results in the production of IL-6 and IFNγthat can, when provided chronically as a model for cachexia, lead to a progressive weight loss [40]. When administeredin vivo, the major cell types responding to Poly I:C include macrophages, dendritic cells (DC) and microglia. Additionally responding DC’s can undergo necroptosis that can exacerbate the inflammatory response. Metabolic dys-function and neurological disorders have also been linked to cachexia, especially as the out-come of chronic infections and cancer metastasis that can lead to the chronic release of inflammatory cytokines. Based upon the previously described findings that the absence of the Ifitm proteins can alter cellular induction pathways following type I interferon treatment, we tested whether or not theIfitmDelanimals would have an altered response, compared to WT, to chronic Poly I:C treatment. As shown inFig 4A, 8 week old WT animals treated with Poly I: C over a time course of 28 days demonstrated the expected progressive weight loss, but age and sex matchedIfitmDelanimals were much more resistant to the cachexic effects of the Poly I:C treatment. While theIfitmDelanimals treated with Poly I:C did lose weight, especially com-pared to their PBS-treated counterparts, the degree of weight loss was much less dramatic. To determine if the altered response to Poly I:C in theIfitmDelanimals was also mirrored in al-tered cytokine responses, animals were treated with Poly I:C for 10 days (treatment every two days) weighed and analyzed. The hypothalamus was removed by dissection, total RNA isolated and cytokine expression by quantitative RT-PCR was measured. As a positive control, the IFN-induced protein with tetratricopeptide repeats (Ifit1), which is genetically and functionally dis-tinct from the Ifitm proteins, was measured in response to type I interferon stimulated by Poly I:C injection. As shown inFig 4B, WT andIfitmDelmice have equivalent levels of Ifit1 RNA following Poly I:C treatment indicating these two strains were equally responsive. However, theIfitmDeland WT animals displayed significant differences inTNFαandIL-1βmRNA levels with theIfitmDelanimal showing significantly elevated levels of these inflammatory cytokines
(Fig4Cand4D). PBS mock activated mice of the WT andIfitmDeldid not induce elevated
interferon induced by the Poly I:C treatment is intact but much more polarized towards a pro-inflammatory signature in theIfitmDelanimal than WT. This is the case even though the weight loss in these animals upon Poly I:C treatment is less severe.
Immunohistochemistry of the WT and
IfitmDel
mice hypothalamus
The RNA signaling results (Fig 4) led us to examine the morphology of the hypothalamus which to our knowledge has not been examined in depth in theIfitmDelmice. We first assessed the hy-pothalamus in unstimulated mice using markers for microglia/macrophages (Iba1), astrocytes (GFAP), oligodendrocytes (O2A) and neurons (MAP2). Coronal serial sections from the brains of saline perfused and paraformaldehyde-fixed tissue ofIfitmDeland control animals (Methods) were prepared from equivalent anatomical locations, stained for cell specific markers and photo-graphed for visual analysis. Overall no gross abnormalities in brain anatomy were detected (data not shown), which is consistent with earlier reports [16] that theIfitmDelanimals exhibited no developmental defects (although CNS morphology was not specifically characterized). The re-gional distribution, appearance and staining of neurons, astrocytes or oligodendrocytes was also
Fig 4. TheIfitmDelmice exhibit an altered response to Poly I:C activation.Mice were injected with PBS or Poly I:C every two days for the 28 day course. (A) Changes in body weight after mice treatment with PBS or Poly I:C (12.5mg/kg) injection. (B-I) Comparison of hypothalamic gene expression of selected pro-inflammatory cytokines in WT versusIfitmDelmice after Poly I:C injection. Hypothalamus tissue was isolated after injection with PBS or Poly I:C every two days for 8 days of 6- to 8-week-old mice (n = 6 for each group). (B) Relative transcript levels ofIfit1(an interferon responsive gene unrelated toIfitmgenes) confirm the IfitmDelmice respond to this treatment regime similar to WT mice. Additional measurement of the expression of selected transcripts from the same sample as in panel B show varied responses of: (C)TNFα; (D)IL-1β; (E)IFNβ; (F)iNOS; (G)IL-10; and (H)F4/80.*p<0.05 and**p<0.01.
equivalent between animals of both genotypes (Methods). However, microglia revealed by immunostaining for the expression of the Iba1 antigen exhibited a markedly altered morphology between WT andIfitmDelmice (Fig 5). Among the most notable morphology differences was the occurrence of dramatically elongated processes that were often observed to extend well over 150 microns (Fig 5B, dotted line). These processes were almost exclusively unipolar, and they ex-hibited infrequent branching and few varicosities. The cell bodies of these microglia also tended to appear as smaller and more poorly defined relative to controls in the hypothalamus (Fig 5A–
5D). The altered microglia morphology of theIfitmDelmice was evident in other brain regions
including the cortex and hippocampus (data not shown). Microglia are mesoderm/mesenchy-mal derivatives that share a bone-marrow macrophage lineage [41]. To determine if the mor-phological differences observed in theIfitmDelmicroglia are intrinsic to this cell type, bone marrow macrophages (BMDM) from controls andIfitmDelmice were prepared from culture. After 10 days, cells were gently rinsed with PBS, cells fixed with paraformaldehyde and immunostained to reveal Iba1 expression. As shown in Fig5Eand5F, the morphology of
Fig 5. Microglia fromIfitmDelmice exhibit morphologic abnormalities.(A) Immunohistochemical examination of sections prepared from saline perfused and paraformaldehyde fixed brains stained for the expression of the microglial marker, Iba1 (red), are shown. (A,B) Comparison of microglia from photographs taken of the lateral hypothalamic nucleus (region of the ventromedial nucleus shown). Arrow heads point to typical appearance of (A) microglia in theIfitmwild-type (WT) mice or (B)IfitmDelmouse. Dotted lines indicate extending processes of microglia seen in IfitmDel mouse sections. Bar = 30 microns. (C,D) increased magnification of individual microglia as marked by an arrow head. In (C)IfitmWT microglia exhibit numerous bifurcations (some indicated by asterisks) whereas (D)IfitmDel microgliashow few bifurcations and the long extended processes (dots) with few bifurcations. Bars are 20 microns. (E,F) Cultured bone marrow-derived macrophages from (E)IfitmWT or (F)IfitmDelmouse (Methodsand text). The arrow points to a common cell morphology where cells are flattened and have fan-shaped lamella. The double arrow identifies a cell with an elongated cell morphology that also common to cultures prepared from either genotype. Both are typical to both preparations. The arrow head identifies a cell with morphology unique to theIfitmDelculture that is characterized by exceptionally long thin processes (dots) that resemble the microglia morphology seen in the brain. Bar = 20 microns.
a subpopulation ofIfitmDelBMDMs exhibited strikingly similar features to those seen in the microglia. In particular, these BMDMs fromIfitmDelBM produced very thin extensions that ex-tended for long distances in the cultures. These processes were rare or not detected with the con-trol cells (Fig 5E). Also evident is the impression thatIfitmDelBMDMs were more compact and in general looked smaller than cells of similar morphology in the WT preparation. This is also evident in cells producing fan-shaped lamella which are more compact inIfitmDelBMDMs. Thus the curious morphology of theIfitmDelmicroglia was recapitulated in cultured bone mar-row derived macrophages possessing the same genetic defect suggesting that common cellular abnormalities may be associated with theIfitmDelin vulnerable cells.
Having found that microglia exhibit altered morphology inIfitmDelanimal and the hypo-thalamic transcriptional response to Poly I:C is also altered in this mouse (Fig 4), we examined by immunohistochemistry changes in the CNS induced by Poly I:C. WT andIfitmDelanimals were activated with Poly I:C as above, sacrificed and perfused. A notable difference in the re-sponse of the WT compared to the Poly I:C treated mice was evident in choroid plexus struc-tures within ventricles. Macrophages mobilize to the CNS upon inflammation and this is often evident by increased cellularity of the choroid plexus. InFig 6we show that Poly I:C treatment of WT andIfitmDelanimals stimulates an increase in the accumulation of Iba1/CD11b positive cells (Fig6Cand6D; i.e., macrophages) in the choroid plexus. Further, these cells are also Iba1/ F4-80 positive (Fig6Gand6H), indicative of activation of macrophage lineage cells. A striking difference between WT andIfitmDelanimals is the appearance of masses of these cells (Fig6D
Fig 6. Microglia accumulation in the choroid plexus differs inIfitmDelmice treated with Poly I:C.Sections of the indicated genotype were prepared from the brains of mice treated with either PBS or Poly I:C (12.5mg/kg) injection as indicated. Shown are typical results of double labeling with either Iba1 (green), CD11b (red; A-D), or F4/80 (red; E- H), respectively. At low magnification (small panels; original magnification of 10x) and the DAPI image staining for cell nuclei of the same sections is included. Regions showing the choroid plexus (lateral ventricle; Bregma -0.1 to -0.22) are boxed and shown at greater magnification in the associated images. Images in (A and E) and (B and F) are staining of serial sections separated by approximately 50 microns. The arrows identify in the often large aggregates of stained cells unique toIfitmDelmice for either (D) Iba1/CD11b or from a different mouse (H) Iba1/F4/80. These aggregates are not present in similar sections ofIfitmWT mice (compare with (C) and (G), respectively). Similar results are common in choroid plexus of all ventricles (data not shown).
and6H) that are not evident in the PBS animals (Fig6Aand6B), Poly I:C treated WT animals
(Fig6Eand6F) or the PBS-treatedIfitmDelanimal (Fig6Cand6D). Similar data were also
ob-tained from sob-tained sections of the median eminence of the ventral hypothalamic region (Fig
7), again showing enhanced macrophage/microglia staining in the Poly I:C treatedIfitmDel
an-imal compared to controls or sham activatedIfitmDelanimals. Collectively these findings sug-gest that the enhanced numbers of transcripts encoding for F4/80 in the hypothalamus of Poly I:C treatedIfitmDelanimals (see Figs6Hand7H) may be due to increased recruitment and/or accumulation of inflammatory macrophages to the brain. Further, the activated macrophages in these regions at the site of blood-brain interfaces suggests that perhaps the macrophages do not enter the brain but may become entangled in these regions during normal migration.
Discussion
This report describes novel peripheral and central alterations associated with the lack of the Ifitm proteins. TheIfitmDelanimals lack all five of theIfitmgenes via an engineered genetic de-letion without impact on other coding or control sequences that reside within the gene family locus. When bred as heterozygotes, the homozygousIfitmDelprogeny are produced in the vi-varium at normal Mendelian ratios and exhibit normal losses of the adult animals compared to WT C57BL/6 animals. What is clear, however, is that the longer theIfitmDelanimals are main-tained on normal chow diet, the more obese they become. This obesity is due to an enhanced accumulation of white adipose mass. We have not examined changes in brown adipose tissue in these animals.
While there are a variety of pathways that can lead to obesity, perhaps the best characterized are the aberrant feeding behaviors associated with alterations in the leptin/leptin receptor path-way [34]. Animals deficient in either the ligand or receptor become morbidly obese due to the uncontrolled feeding behavior of the animals. Leptin, produced by fat cells, binds to leptin receptor-bearing cells in the hypothalamus and engages the Stat3 signaling pathway to influ-ence the expression of genes encoding neuropeptides [42]. These include genes that impact upon feeding behavior such as an increase inPomcthat suppresses feeding andNpythat pro-motes this activity. Hence, normally low leptin levels allowPomcexpression to drop and NPY
Fig 7. Microglia accumulation in the median eminence and ventral hypothalamus differs inIfitmDel mice treated with Poly I:C.Coronal sections prepared as described in theFig 6are shown for the region of the median eminence adjacent to the ventral hypothalamus (arcuate nucleus; approximate Bregma -1.58 to -1.7). Similar to the choroid plexus, increased accumulation of either Iba1/CD11b or Iba1/F4/80 cells are found in the PolyI:C treatedIfitmDelmice. 3V = third ventricle.
Ifitm proteins contribute to this unique metabolic phenotype.
Because we are unaware of any reports of brain structural anomalies for theIfitmDelanimal, we performed a survey of brain using a histological approach to evaluate whether the altered
Pomcexpression regulation could be due to structural deficiencies in the hypothalamus. Over-all, we observed no abnormal anatomical defects in any brain regions when compared to the C57BL/6 controls. Additional analyses of these sections stained with cell type specific immuno-fluorescent markers also failed to reveal any overall gross inconsistencies in the overall distribu-tion or numbers of neurons, oligodendrocytes and astrocytes. Microglia, however, were different. The overall numbers appeared to be similar between theIfitmDeland control mice. It is worth noting that in occasionalIfitmDelanimals there appeared to be a substantial decrease in microglia in the cortex (not shown). What did consistently differ was a striking and common microglial cell morphology throughout the brain tissues of theIfitmDelanimal. Most notable was the reduced elaboration of microglia morphology accompanied by extremely long and usu-ally mono-polar processes that extended from the cell body with few bifurcations. Also, the cell bodies appeared smaller and less distinct than their control counterparts. How altered micro-glia cell morphology could specifically affect leptin signaling and the production of neuropep-tides such as Pomc or Npy is not known. However, it is possible that IfitmDel microglia are unable to produce normal interactions with other cells types including neurons and astrocytes such as trophic interactions or clearance of debris thereby leading to altered and potentially toxic microenvironments.
The function(s) of the Ifitm proteins in development and maintenance of the central ner-vous system is a newly developing field. Elevated expression ofIFITMfamily members has been noted in the brains of schizophrenic patients, patients with autism, bipolar disorders and Alzheimer’s disease [43–46]. Besides being reported in neurodegenerative diseases,Ifitm3also has been shown to respond to Poly I:C as an inducer of type I interferons, by increasing gene expression in astrocytes [47]. The Ifitm3 protein is found in the endosomes of astrocytes and knockdown ofIfitm3expression inhibits clathrin dependent uptake in such cells [47], similar to our description for cells obtained from theIfitmDelanimal [14]. It appears that the expres-sion of Ifitm proteins is crucial to function in astrocytes. However, our observations failed to reveal any gross morphological abnormalities in astrocytes ofIfitmDelanimals (stained by GFAP, data not shown). This will require further evaluation to assure astrocytes are not func-tionally compromised despite the overall appearance of normal morphology.
can worsen the disease progression by secreting excessive inflammatory cytokines. One by-product of these activation-dependent cytokines is the development of metabolic syndrome phenotypes characterized by weight gain and/or leptin resistance [52,55,56]. While there is a growing body of evidence suggesting the Ifitm proteins may influence neuronal function through poorly defined mechanism, our study suggests they actually play a role in normal brain cellular architecture and interaction.
A final point is that theIfitmDelanimal is lacking all five of theIfitmgenes. As shown inFig
4C, theIfitm1,2,3and6genes are expressed in the hypothalamus and the expression ofIfitm2
andIfitm3normally increases with age. As theIfitmDelanimal does not produce this age-related alteration in expression, there is the intriguing possibility that these increases produce normal compensatory functions towards control of the age-related increases in obesity and al-tered leptin modulation of metabolic homeostasis. Since an obesity phenotype has not been de-scribed for singleIfitmgene deletions (Ifitm3deficient orIfitm1deficient)[16,53] nor have any brain anomalies such as the deficiency in microglia as shown in this report been described for any of these singleIfitmgene deletion strains, this will require further investigation. For exam-ple,Ifitm6is primarily expressed in osteoclasts and macrophage lineages (of which microglia are related [6,57]). But whether or not the microglia deficiency seen in theIfitmDelanimal is due to the lack ofIfitm6during microglial cell development remains to be evaluated. Also other possibilities such as the indirect regulation of other modulators of adipose cell signaling by Ifitm (e.g., regulation of leptin signaling through carbonic anhydrase activation [58]) will need to be investigated. What does appear important is thatIfitmgenes are implicated in mod-ulating important endocrine functions. In the framework of the microglia and hypothalamic interactions, our data also suggest that the phenotype could vary depending upon exposure to
Ifitm-specific pathogens.
Acknowledgments
The authors would like to thank the University of Utah Core facilities (FACS, Metabolic and Transgenic and Knockout Mouse), Dr. Donald McClain for his assistance in measuring serum leptin and the Weis labs for their critique of this work and many useful suggestions.
Author Contributions
Conceived and designed the experiments: YSW SWR JHW. Performed the experiments: YSW SWR. Analyzed the data: YSW SWR LCG JJW JHW. Contributed reagents/materials/analysis tools: YSW SWR LCG JJW JHW. Wrote the paper: YSW SWR LCG JJW JHW.
References
1. Diamond MS, Farzan M. The broad-spectrum antiviral functions of IFIT and IFITM proteins. Nat Rev Immunol. 2013; 3: 46–57.
2. Yount JS, Karssemeijer RA, Hang HC. S-palmitoylation and ubiquitination differentially regulate interferon-induced transmembrane protein 3 (IFITM3)-mediated resistance to influenza virus. J Biol Chem. 2012; 287: 19631–19641. doi:10.1074/jbc.M112.362095PMID:22511783
3. John SP, Chin CR, Perreira JM, Feeley EM, Aker AM, Savidis G, et al. The CD225 domain of IFITM3 is required for both IFITM protein association and inhibition of influenza A virus and dengue virus replica-tion. J Virol. 2013; 87: 7837–7852. doi:10.1128/JVI.00481-13PMID:23658454
4. Huang IC, Bailey CC, Weyer JL, Radoshitzky SR, Becker MM, Chiang JJ, et al. Distinct patterns of IFITM-mediated restriction of filoviruses, SARS coronavirus, and influenza A virus. PLoS Pathog. 2011; 7: e1001258. doi:10.1371/journal.ppat.1001258PMID:21253575
11. Everitt AR, Clare S, Pertel T, John SP, Wash RS, Smith SE, et al. IFITM3 restricts the morbidity and mortality associated with influenza. Nature. 2012; 484: 519–523. doi:10.1038/nature10921PMID: 22446628
12. Bowles NE, Arrington CB, Hirono K, Nakamura T, Ngo L, Wee YS, et al. Kawasaki disease patients ho-mozygous for the rs12252-C variant of interferon-induced transmembrane protein-3 are significantly more likely to develop coronary artery lesions. Mol Genet Genomic Med. 2014; 2: 356–361. doi:10. 1002/mgg3.79PMID:25077179
13. Amini-Bavil-Olyaee S, Choi YJ, Lee JH, Shi M, Huang IC, Farzan M, et al. The antiviral effector IFITM3 disrupts intracellular cholesterol homeostasis to block viral entry. Cell Host Microbe. 2013; 13: 452–464. doi:10.1016/j.chom.2013.03.006PMID:23601107
14. Wee YS, Roundy KM, Weis JJ, Weis JH. Interferon-inducible transmembrane proteins of the innate im-mune response act as membrane organizers by influencing clathrin and v-ATPase localization and function. Innate Immun. 2012; 18: 834–845. doi:10.1177/1753425912443392PMID:22467717 15. Desai TM, Marin M, Chin CR, Savidis G, Brass AL, Melikyan GB. IFITM3 restricts influenza A virus
entry by blocking the formation of fusion pores following virus-endosome hemifusion. PLoS Pathog. 2014; 10: e1004048. doi:10.1371/journal.ppat.1004048PMID:24699674
16. Lange UC, Adams DJ, Lee C, Barton S, Schneider R, Bradley A, et al. Normal germ line establishment in mice carrying a deletion of the Ifitm/Fragilis gene family cluster. Mol Cell Biol. 2008; 28: 4688–4696. doi:10.1128/MCB.00272-08PMID:18505827
17. Tanaka SS, Matsui Y. Developmentally regulated expression of mil-1 and mil-2, mouse interferon-induced transmembrane protein like genes, during formation and differentiation of primordial germ cells. Gene Expr Patterns. 2002; 2: 297–303. PMID:12617817
18. Tanaka SS, Nagamatsu G, Tokitake Y, Kasa M, Tam PP, Matsui Y. Regulation of expression of mouse interferon-induced transmembrane protein like gene-3, Ifitm3 (mil-1, fragilis), in germ cells. Dev Dyn. 2004; 230: 651–659. PMID:15254899
19. Tanaka SS, Yamaguchi YL, Tsoi B, Lickert H, Tam PP. IFITM/Mil/fragilis family proteins IFITM1 and IFITM3 play distinct roles in mouse primordial germ cell homing and repulsion. Dev Cell. 2005; 9: 745–756. PMID:16326387
20. Lange UC, Saitou M, Western PS, Barton SC, Surani MA. The fragilis interferon-inducible gene family of transmembrane proteins is associated with germ cell specification in mice. BMC Dev Biol. 2003; 3: 1. PMID:12659663
21. Supuran CT, Di Fiore A, De Simone G. Carbonic anhydrase inhibitors as emerging drugs for the treat-ment of obesity. Expert Opin Emerg Drugs. 2008; 13: 383–392. doi:10.1517/14728214.13.2.383 PMID:18537527
22. Yang R, Barouch LA. Leptin signaling and obesity: cardiovascular consequences. Circ Res. 2007; 101: 545–559. PMID:17872473
23. Zhang Y, Proenca R, Maffei M, Barone M, Leopold L, Friedman JM. Positional cloning of the mouse obese gene and its human homologue. Nature. 1994; 372: 425–432. PMID:7984236
24. Crandall H, Dunn DM, Ma Y, Wooten RM, Zachary JF, Weis JH, et al. Gene expression profiling reveals unique pathways associated with differential severity of lyme arthritis. J Immunol. 2006; 177: 7930–7942. PMID:17114465
25. Miller JC, Ma Y, Bian J, Sheehan KC, Zachary JF, Weis JH, et al. A critical role for type I IFN in arthritis devel-opment following Borrelia burgdorferi infection of mice. J Immunol. 2008; 181: 8492–8503. PMID:19050267 26. Brown CR, Lai AY, Callen ST, Blaho VA, Hughes JM, Mitchell WJ. Adenoviral delivery of interleukin-10
27. Ma Y, Seiler KP, Tai KF, Yang L, Woods M, Weis JJ. Outer surface lipoproteins of Borrelia burgdorferi stimulate nitric oxide production by the cytokine-inducible pathway. Infect Immun. 1994; 62: 3663–3671. PMID:7520417
28. Gahring LC, Persiyanov K, Dunn D, Weiss R, Meyer EL, Rogers SW. Mouse strain-specific nicotinic acetylcholine receptor expression by inhibitory interneurons and astrocytes in the dorsal hippocampus. J Comp Neurol. 2004; 468: 334–346. PMID:14681929
29. Gahring LC, Rogers SW. Nicotinic acetylcholine receptor expression in the hippocampus of 27 mouse strains reveals novel inhibitory circuitry. Hippocampus. 2008; 18: 737–749. doi:10.1002/hipo.20430 PMID:18446824
30. Rogers SW, Weis JJ, Ma Y, Teuscher C, Gahring LC. Mouse chromosome 11 harbors genetic determi-nants of hippocampal strain-specific nicotinic receptor expression. Hippocampus. 2008; 18: 750–757. doi:10.1002/hipo.20454PMID:18528848
31. Zinker BA, Rondinone CM, Trevillyan JM, Gum RJ, Clampit JE, Waring JF, et al. PTP1B antisense oli-gonucleotide lowers PTP1B protein, normalizes blood glucose, and improves insulin sensitivity in dia-betic mice. Proc Natl Acad Sci USA. 2002; 99: 11357–11362. PMID:12169659
32. Maffei M, Halaas J, Ravussin E, Pratley RE, Lee GH, Zhang Y, et al. Leptin levels in human and rodent: measurement of plasma leptin and ob RNA in obese and weight-reduced subjects. Nat Med. 1995; 1: 1155–1161. PMID:7584987
33. Berglund ED, Vianna CR, Donato J Jr., Kim MH, Chuang JC, Lee CE, et al. Direct leptin action on POMC neurons regulates glucose homeostasis and hepatic insulin sensitivity in mice. J Clin Invest. 2012; 122: 1000–1009. doi:10.1172/JCI59816PMID:22326958
34. Stanley S, Wynne K, McGowan B, Bloom S. Hormonal regulation of food intake. Physiol Rev. 2005; 85: 1131–1158. PMID:16183909
35. Tartaglia LA, Dembski M, Weng X, Deng N, Culpepper J, Devos R, et al. Identification and expression cloning of a leptin receptor, OB-R. Cell. 1995; 83: 1263–1271. PMID:8548812
36. Elias CF, Aschkenasi C, Lee C, Kelly J, Ahima RS, Bjorbaek C, et al. Leptin differentially regulates NPY and POMC neurons projecting to the lateral hypothalamic area. Neuron. 1999; 23: 775–786. PMID: 10482243
37. Hahn TM, Breininger JF, Baskin DG, Schwartz MW. Coexpression of Agrp and NPY in fasting-activated hypothalamic neurons. Nat Neurosci. 1998; 1: 271–272. PMID:10195157
38. Schwartz MW, Baskin DG, Bukowski TR, Kuijper JL, Foster D, Lasser G, et al. Specificity of leptin ac-tion on elevated blood glucose levels and hypothalamic neuropeptide Y gene expression in ob/ob mice. Diabetes. 1996; 45: 531–535. PMID:8603777
39. Stephens TW, Basinski M, Bristow PK, Bue-Valleskey JM, Burgett SG, Craft L, et al. The role of neuro-peptide Y in the antiobesity action of the obese gene product. Nature. 1995; 377: 530–532. PMID: 7566151
40. Turer EE, Tavares RM, Mortier E, Hitotsumatsu O, Advincula R, Lee B, et al. Homeostatic MyD88-dependent signals cause lethal inflamMation in the absence of A20. J Exp Med. 2008; 205: 451–464. doi:10.1084/jem.20071108PMID:18268035
41. Ginhoux F, Greter M, Leboeuf M, Nandi S, See P, Gokhan S, et al. Fate mapping analysis reveals that adult microglia derive from primitive macrophages. Science. 2010; 330: 841–845. doi:10.1126/ science.1194637PMID:20966214
42. Mori H, Hanada R, Hanada T, Aki D, Mashima R, Nishinakamura H, et al. Socs3 deficiency in the brain elevates leptin sensitivity and confers resistance to diet-induced obesity. Nat Med. 2004; 10: 739–743. PMID:15208705
43. Arion D, Unger T, Lewis DA, Mirnics K. Molecular markers distinguishing supragranular and infragranu-lar layers in the human prefrontal cortex. Eur J Neurosci. 2007; 25: 1843–1854. PMID:17432970 44. Garbett K, Ebert PJ, Mitchell A, Lintas C, Manzi B, Mirnics K, et al. Immune transcriptome alterations in
the temporal cortex of subjects with autism. Neurobiol Dis. 2008; 30: 303–311. doi:10.1016/j.nbd.2008. 01.012PMID:18378158
45. Iwamoto K, Kakiuchi C, Bundo M, Ikeda K, Kato T. Molecular characterization of bipolar disorder by comparing gene expression profiles of postmortem brains of major mental disorders. Mol Psychiatry. 2004; 9: 406–416. PMID:14743183
46. Ricciarelli R, d'Abramo C, Massone S, Marinari U, Pronzato M, Tabaton M. Microarray analysis in Alz-heimer's disease and normal aging. IUBMB Life. 2004; 56: 349–354. PMID:15370883
2009; 32: 638–647. doi:10.1016/j.tins.2009.08.002PMID:19782411
53. Klymiuk I, Kenner L, Adler T, Busch DH, Boersma A, Irmler M, et al. In vivo functional requirement of the mouse Ifitm1 gene for germ cell development, interferon mediated immune response and somito-genesis. PLoS One. 2012; 7: e44609. doi:10.1371/journal.pone.0044609PMID:23115618 54. Brass AL, Huang IC, Benita Y, John SP, Krishnan MN, Feeley EM, et al. The IFITM proteins mediate
cellular resistance to influenza A H1N1 virus, West Nile virus, and dengue virus. Cell. 2009; 139: 1243–1254. doi:10.1016/j.cell.2009.12.017PMID:20064371
55. Alafuzoff I, Overmyer M, Helisalmi S, Soininen H. Lower Counts of Astroglia and Activated Microglia in Patients with Alzheimer's Disease with Regular Use of Non-Steroidal Anti-Inflammatory Drugs. J Alz-heimers Dis. 2000; 2: 37–46. PMID:12214109
56. Cameron B, Landreth GE. Inflammation, microglia, and Alzheimer's disease. Neurobiol Dis. 2010; 37: 503–509. doi:10.1016/j.nbd.2009.10.006PMID:19833208
57. Roundy K, Smith R, Weis JJ, Weis JH. Overexpression of RANKL implicates IFN-beta-mediated elimi-nation of B-cell precursors in the osteopetrotic bone of microphthalmic mice. J Bone Miner Res. 2003; 18: 278–288. PMID:12568405