Marian-Dumitru Nedeloni, Cornel Haţiegan, Florian Muntean, Marcel Jurcu, Irina Maria Terfăloagă, Petru Magheţi
A Modal Analysis Study of Thin Parallelogram Plates
Clamped on the Rim with and without Defects Using
the SolidWorks Program
This paper presents the study of the modal analysis of four types of plates in parallelogram shape, with or without defects, using the SolidWorks program. The results obtained after this study, have targeted the behavior of plates regarding the mesh, the deformation scale, the resultant amplitude, the rotational speeds, respectively the Eigen frequencies according to the vibration modes.
Keywords: Modal analysis, parallelogram plates, SolidWorks program
1. Introduction
In practice, knowledge and use of notions about bodies/elastic systems, and the mechanical vibrations encountered on them, are fundamental for specialists in areas such as construction, engineering, architecture etc. [1].
These elastic bodies, such as beams, pipes, plates etc., defined as solid bodies, are studied by several authors [2] - [6], or are regarded as the emergence of a surface.
For example, the types of plates and their use in engineering applications can be classified according to the type and size of the median plane, respectively shape and thickness of the characteristic middle surface [7].
Especially, after the 2000s, in various studies, there have been done researches concerning:
- Their leaning way of plates[8] and [9];
- The determining of Eigen frequencies and the vibration mode shapes of the plates with or without defects [10] and [11];
- The comparison of obtained results through the modal analysis with the aid of a soft and the ones obtained analytically with practical results gained on experimental work benches [12] - [15], as well as other researches [16] - [18].
ANALELE UNIVERSITĂŢII
“EFTIMIE MURGU” REŞIŢA
Concerning the simulation with the SolidWorks program or other programs, through the Finite Element Method (FEM), useful results were noted in the bibliographical references [19], [20] and [21].
In this paper, through the modal analysis using the SolidWorks program, there have been analyzed four types of parallelogram plates, clamped on the rim (a plate without defect (denoted by Plate1) and respectively 3 plates with one defect of the size 10 x 5 [mm] positioned differently), concerning the 3D simulation and determining of Eigen frequencies and vibration mode shapes.
The overall dimensions in [mm] for these plates are: length 1000, width 500 and thickness 2. For the 3 plates with defects, the chosen places where those defects are: in the center of the plate (denoted by Plate2), on the length (denoted by Plate3) and on the width (denoted by Plate4).
2. Stages of the modal analysis using SolidWorks and results
For the modal analysis, as well as for the frequency type study, using the SolidWorks program, the plates simulation has been done at the temperature of 20 oC, at which there have been determined the first 30 vibration mode shapes for
the 4 analyzed cases.
The stages used for this modal analysis were [22]:
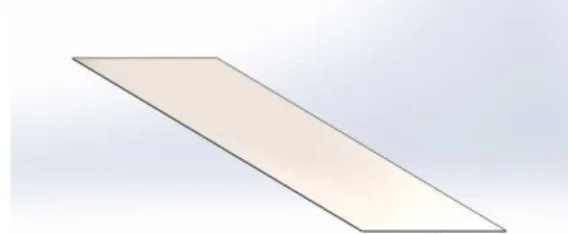
- Creating the plate’s geometry (figures 1 to 4) and then creating the frequency type study;
- Choosing the material (figure 5), which is 1023 Carbon Steel and which has the following important characteristics: Elastic Modulus: 205000 [N/mm2]; Shear Modulus: 80000 [N/mm2]; Mass Density: 7858 [kg/m3] and Poisson’s Ratio: 0.29;
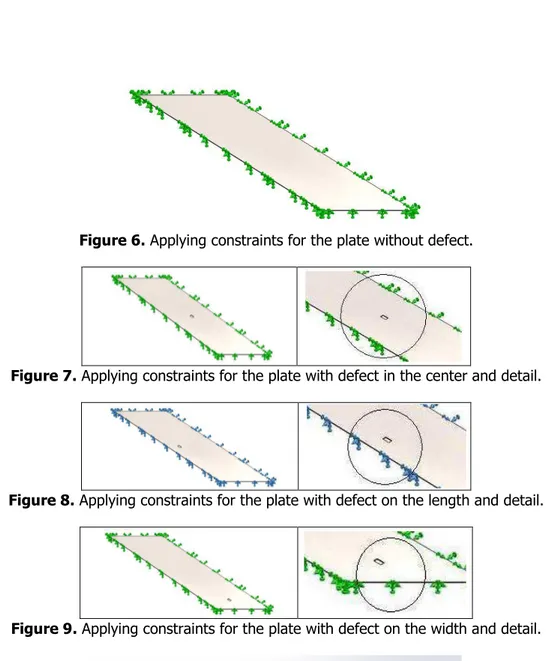
- Applying constraints (figures 6 to 9). In this stage, the plate without defect has the following characteristics: Mass: 3.929 [kg]; Volume: 0.0005 [m3] and
Weight: 38.5042 [N], in contrast, the other three plates had the characteristics: Mass: 3.92393 [kg]; Volume: 0.000499355 [m3] and Weight: 38.4545 [N].
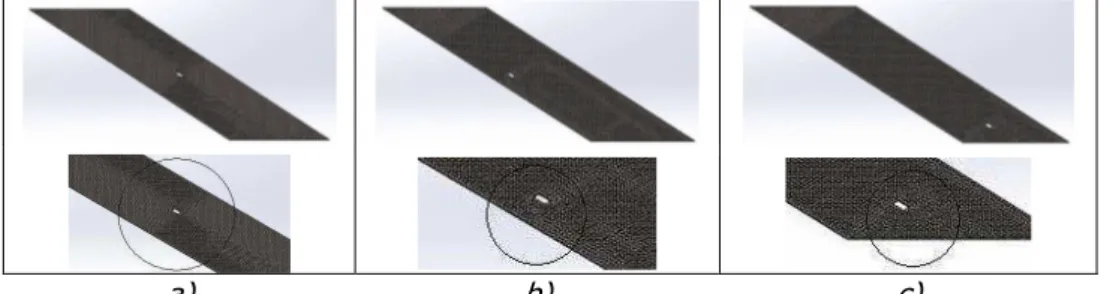
- The mesh (figures 10 and 11, respectively table 1), where by the option „Solid mesh“, the following have been used: High for Mesh Quality, Solid mesh for Mesh type, Standard mesh for Meshed Used;
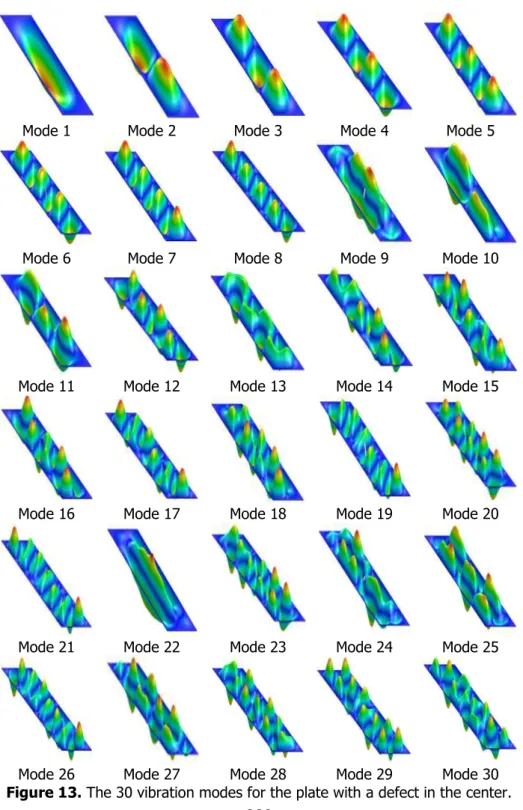
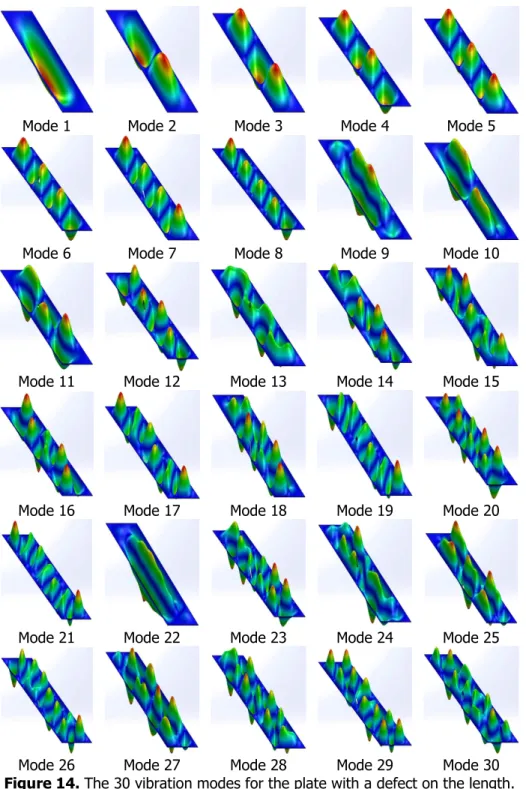
- The proper computing of modal analysis of the SW program and visualizing the results (tables 2 and 3, respectively figures 12 to 15).
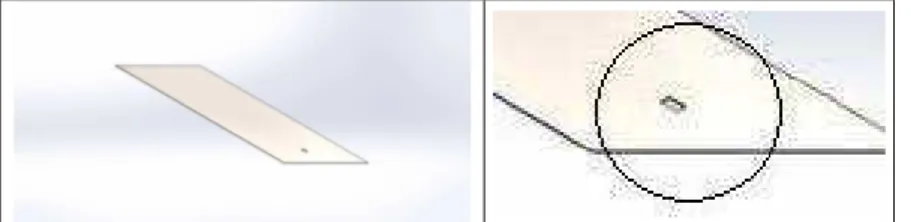
Figure 2. Creating the geometry for the plate with defect in the center and detail.
Figure 3. Creating the geometry for the plate with defect on the length and detail.
Figure 4. Creating the geometry for the plate with defect on the width and detail.
Figure 6. Applying constraints for the plate without defect.
Figure 7. Applying constraints for the plate with defect in the center and detail.
Figure 8. Applying constraints for the plate with defect on the length and detail.
Figure 9. Applying constraints for the plate with defect on the width and detail.
a) b) c)
Figure 11. Mesh and the details of positioning the defects for the plate with defect in the center a), for the plate with defect on the length b) and for the
plate with defect on the width c).
Table 1. Mesh Information - Details
Plate type Number
of nodes
Number of elements
Element Size [mm]
Plate without defect 60692 29821 7.10925
Plate with defect in the center 60630 29754
Plate with defect on the length 60702 29824
Plate with defect on the width 60683 29805
7.10577
The values of the deformation scale of the plate according to the vibration modes can be found in table 2, and the values of maximum amplitude, can be found in table 3. The minimum amplitude at the 4 types of plates for all the 30 vibration modes has always value 0 on the 1st node.
Table 2. The deformation scale of the plates according to the vibration modes [-]
Plate type Plate type
Mod
Plate1 Plate2 Plate3 Plate4 Mod Plate1 Plate2 Plate3 Plate4
Table 3. The maximum amplitude in the plates according to the vibration modes Plate type
Plate1 Plate2 Plate3 Plate4
Value Value Value Value
Mode
[mm]
Node
number [mm]
Node
number [mm]
Node
number [mm]
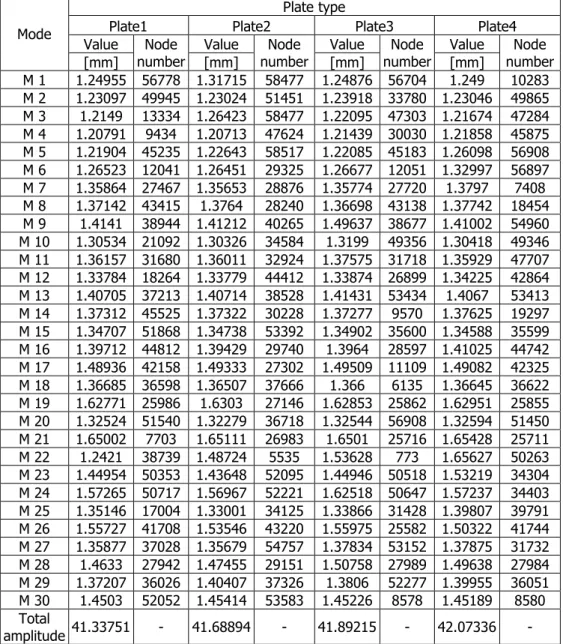
Node number M 1 1.24955 56778 1.31715 58477 1.24876 56704 1.249 10283 M 2 1.23097 49945 1.23024 51451 1.23918 33780 1.23046 49865 M 3 1.2149 13334 1.26423 58477 1.22095 47303 1.21674 47284 M 4 1.20791 9434 1.20713 47624 1.21439 30030 1.21858 45875 M 5 1.21904 45235 1.22643 58517 1.22085 45183 1.26098 56908 M 6 1.26523 12041 1.26451 29325 1.26677 12051 1.32997 56897 M 7 1.35864 27467 1.35653 28876 1.35774 27720 1.3797 7408 M 8 1.37142 43415 1.3764 28240 1.36698 43138 1.37742 18454 M 9 1.4141 38944 1.41212 40265 1.49637 38677 1.41002 54960 M 10 1.30534 21092 1.30326 34584 1.3199 49356 1.30418 49346 M 11 1.36157 31680 1.36011 32924 1.37575 31718 1.35929 47707 M 12 1.33784 18264 1.33779 44412 1.33874 26899 1.34225 42864 M 13 1.40705 37213 1.40714 38528 1.41431 53434 1.4067 53413 M 14 1.37312 45525 1.37322 30228 1.37277 9570 1.37625 19297 M 15 1.34707 51868 1.34738 53392 1.34902 35600 1.34588 35599 M 16 1.39712 44812 1.39429 29740 1.3964 28597 1.41025 44742 M 17 1.48936 42158 1.49333 27302 1.49509 11109 1.49082 42325 M 18 1.36685 36598 1.36507 37666 1.366 6135 1.36645 36622 M 19 1.62771 25986 1.6303 27146 1.62853 25862 1.62951 25855 M 20 1.32524 51540 1.32279 36718 1.32544 56908 1.32594 51450 M 21 1.65002 7703 1.65111 26983 1.6501 25716 1.65428 25711 M 22 1.2421 38739 1.48724 5535 1.53628 773 1.65627 50263 M 23 1.44954 50353 1.43648 52095 1.44946 50518 1.53219 34304 M 24 1.57265 50717 1.56967 52221 1.62518 50647 1.57237 34403 M 25 1.35146 17004 1.33001 34125 1.33866 31428 1.39807 39791 M 26 1.55727 41708 1.53546 43220 1.55975 25582 1.50322 41744 M 27 1.35877 37028 1.35679 54757 1.37834 53152 1.37875 31732 M 28 1.4633 27942 1.47455 29151 1.50758 27989 1.49638 27984 M 29 1.37207 36026 1.40407 37326 1.3806 52277 1.39955 36051 M 30 1.4503 52052 1.45414 53583 1.45226 8578 1.45189 8580 Total
amplitude 41.33751 - 41.68894 - 41.89215 - 42.07336 -
The relationship between the amplitude and the scale deformation is that, whenever the amplitude rises in value, the scale of deformation decreases in value and when the amplitude drops, the scale of deformation increases.
Mode 1 Mode 2 Mode 3 Mode 4 Mode 5
Mode 6 Mode 7 Mode 8 Mode 9 Mode 10
Mode 11 Mode 12 Mode 13 Mode 14 Mode 15
Mode 16 Mode 17 Mode 18 Mode 19 Mode 20
Mode 21 Mode 22 Mode 23 Mode 24 Mode 25
Mode 26 Mode 27 Mode 28 Mode 29 Mode 30
Mode 1 Mode 2 Mode 3 Mode 4 Mode 5
Mode 6 Mode 7 Mode 8 Mode 9 Mode 10
Mode 11 Mode 12 Mode 13 Mode 14 Mode 15
Mode 16 Mode 17 Mode 18 Mode 19 Mode 20
Mode 21 Mode 22 Mode 23 Mode 24 Mode 25
Mode 26 Mode 27 Mode 28 Mode 29 Mode 30
Mode 1 Mode 2 Mode 3 Mode 4 Mode 5
Mode 6 Mode 7 Mode 8 Mode 9 Mode 10
Mode 11 Mode 12 Mode 13 Mode 14 Mode 15
Mode 16 Mode 17 Mode 18 Mode 19 Mode 20
Mode 21 Mode 22 Mode 23 Mode 24 Mode 25
Mode 26 Mode 27 Mode 28 Mode 29 Mode 30
Mode 1 Mode 2 Mode 3 Mode 4 Mode 5
Mode 6 Mode 7 Mode 8 Mode 9 Mode 10
Mode 11 Mode 12 Mode 13 Mode 14 Mode 15
Mode 16 Mode 17 Mode 18 Mode 19 Mode 20
Mode 21 Mode 22 Mode 23 Mode 24 Mode 25
Mode 26 Mode 27 Mode 28 Mode 29 Mode 30
3. Comparison of the modal analysis results
If in figures 12 to 15 there have presented in the form of images, the mode shapes, further on, after the study of the frequency type from the modal analysis, the results regarding the rotational (angular) speed and the Eigen frequencies according to the vibration modes of the plates, are presented in tables 4 to 5.
Table 4. The evolution of rotational speeds for the analyzed plates [rad/s] Mode Plate1 Plate2 Plate3 Plate4 Mode Plate1 Plate2 Plate3 Plate4
M 1 1135.2 1133.1 1135.9 1135.1 M 16 4355.3 4345.9 4348.8 4349 M 2 1217.4 1217.2 1217 1217.1 M 17 4605.7 4597.3 4601.3 4600.1 M 3 1364.8 1362.6 1364.6 1364.1 M 18 4895.6 4887.3 4887.9 4887.8 M 4 1584.3 1583.5 1583.5 1583 M 19 5143.2 5138.3 5140.2 5137.5 M 5 1875 1871.5 1872.8 1872.9 M 20 5482.5 5466.8 5472.3 5472.5 M 6 2227.5 2225.8 2226.4 2225 M 21 5724.1 5716.3 5721 5719.2 M 7 2624.7 2620 2621.6 2622.1 M 22 6046 6023.3 6031.6 6042.6 M 8 3031.5 3029.7 3029.5 3030 M 23 6056 6047.8 6048.4 6046.5 M 9 3104.6 3103.8 3101.6 3104 M 24 6192.7 6189.1 6185.9 6189.8 M 10 3196.5 3194.8 3195.3 3195.4 M 25 6344 6326.4 6335.4 6335.1 M 11 3395 3391.9 3391.7 3392.2 M 26 6348.7 6342.6 6345.6 6346.2 M 12 3460.8 3456.4 3457.4 3459.3 M 27 6668.6 6665.2 6656.3 6659 M 13 3703.3 3695.5 3698.5 3698.5 M 28 6704.9 6687 6695.1 6693.6 M 14 3880.6 3876.9 3876.4 3876.6 M 29 6982.5 6968.4 6978.2 6974.5 M 15 4119.3 4114 4115.5 4114.1 M 30 7153.9 7137.3 7144.7 7145.6
Table 5. The evolution of Eigen frequencies for analyzed plates [Hz] Mode Plate1 Plate2 Plate3 Plate4 Mode Plate1 Plate2 Plate3 Plate4
From the realized study, using the SolidWorks program, there appear the values of rotational speed, and the ones of the Eigen frequencies according to the vibration modes of the plates, as shown in the previous tables.
These have been highlighted for the fact that dividing the values belonging to the Eigen frequencies by the rotational speed, one can obtain parity (1):
Hz
s
rad
/
0
.
15915
1
=
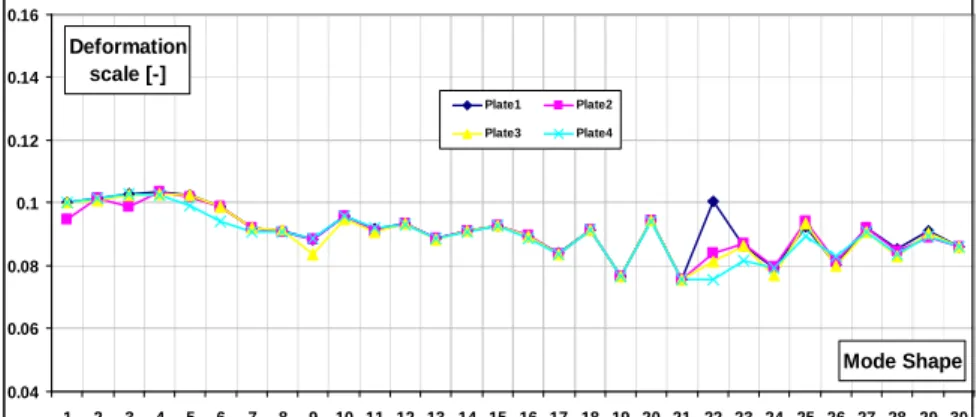
, (1)Further on, for comparing the results of the analyzed plates, the values to tables 2 to 5, are graphically represented (figures 16 to 21).
0.04 0.06 0.08 0.1 0.12 0.14 0.16
1 2 3 4 5 6 7 8 9 10 11 12 13 14 15 16 17 18 19 20 21 22 23 24 25 26 27 28 29 30
Mode Shape Deformation
scale [-]
Plate1 Plate2
Plate3 Plate4
Figure 16. The evolution regarding the deformation scale according to the vibration modes of the analyzed plates.
0.8 1 1.2 1.4 1.6 1.8 2
1 2 3 4 5 6 7 8 9 10 11 12 13 14 15 16 17 18 19 20 21 22 23 24 25 26 27 28 29 30
Mode Shape Amplitude
[mm]
Plate1 Plate2
Plate3 Plate4
0 2000 4000 6000 8000 10000 12000 14000 16000 18000
1 2 3 4 5 6 7 8 9 10 11 12 13 14 15
Mode Shape Rotational Speed
[rad/s]
Plate1 Plate2
Plate3 Plate4
Figure 18. The evolution regarding the rotational speed of the analyzed plates for the vibration modes 1 to 15.
100 5100 10100 15100 20100 25100 30100 35100
16 17 18 19 20 21 22 23 24 25 26 27 28 29 30
Mode Shape Rotational
Speed [rad/s] Plate1 Plate2
Plate3 Plate4
Figure 19. The evolution regarding the rotational speed of the analyzed plates for the vibration modes 16 to 30.
0 100 200 300 400 500 600 700
1 2 3 4 5 6 7 8 9 10 11 12 13 14 15
Mode Shape Eigen
Frequency [Hz]
Plate1 Plate2
Plate3 Plate4
100 300 500 700 900 1100 1300 1500
16 17 18 19 20 21 22 23 24 25 26 27 28 29 30
Mode Shape Eigen
Frequency [Hz]
Plate1 Plate2 Plate3 Plate4
Figure 21. The evolution regarding Eigen frequencies of the analyzed plates for the vibration modes 16 to 30.
4. Conclusion
According to the obtained results from the modal analysis study, one can conclude that the plate without defect differs from the ones with defects, regarding:
- The mass, volume, weight and mehs;
- The deforming scale and the amplitude in the plates for the 30 modes; - The increasing evolution according to the vibration modes of the rotational speeds that have had values between 1133.1 and 7153.9 [rad/s], respectively of the Eigen frequencies that have had values between 180.35 and 1138.6 [Hz].
Also the plates with defects present values that are different among them. All these results are due to the plate’s area, respectively to the positioning of the defects in plates, although the modal analysis was done in the same conditions and the plate’s material had the same properties. Based on the results obtained, one can interpret certain mathematic relations regarding the plate’s behavior according the vibration modes.
Acknowledgments
The work has been funded by the Sectorial Operational Program Human Resources Development 2007-2013 of the Ministry of European Funds through the Financial Agreement POSDRU/159/1.5/S/132395.
References
[2] Leissa A.W., Singularity Considerations in Membrane, Plate and Shell Behaviors. Int. J. Solids and Structures, vol. 98, 2001, 3341-3351. [3] Feng G.Q., Li G., Liu Z.H., Niu H.L., Li F.C., Numerically Simulating the
Sandwich Plate System Structures, J. Marine Sci. Appl., 9, 2010, 286-291. [4] Gillich G.R., Praisach Z.I., Robust method to Robust method to identify
damages in beams based on frequency shift analysis, SPIE Smart Struc-tures and Materials & Nondestructive Evaluation and Health Monitoring, San Diego, USA, 2012, 83481D-12.
[5] Tufoi M., Gillich G.R., Praisach Z.I., Iancu V., Furdui H., About the In-fluence of Temperature Changes on the Natural Frequencies of Clamped-Clamped Euler-Bernoulli Beams, Romanian Journal of Acoustics and Vi-bration, year 11, no. 2, 2014, 84-87.
[6] Ene T., Consideraţii privind sudarea prin difuzie a plăcuţelor din carburi metalice pe suportul sculelor aşchietoare în varianta monobloc, Conferinţă SUDURA, Sibiu, year 5, no. 3, 2014.
[7] Bratu P., Vibraţiile sistemelor elastice (Vibrations of elastic systems), Editura Tehnică, Bucureşti, 2000.
[8] Hatiegan C., Tufoi M., Raduca E., Protocsil C., Mituletu C., Modal Anal-ysis through SolidWorks Software of Clamped Thin Plates with Damages, Constanta Maritime University Annals, year, XIV, issue 19, 2013, 121-124. [9] Haţiegan C., Gillich G. R., Gillich N., Tufoi M., Răduca M., Modal
Analy-sis of Thin Plates with Damage Simply Supported on all Edges, Analele Universitatii “Eftimie Murgu” Resita, year XX, no. 1, 2013, 117-126. [10] Hatiegan C., Nedeloni M. D., Tufoi M., Protocsil C., Raduca M., Modal
Analysis of Natural Frequencies and Mass Participation Coefficients of Simply Supported Thin Plates with Damages, Constanta Maritime Univer-sity Annals, year XIV, issue 19, 2013, 115-120.
[11] Hatiegan C., Gillich G.R., Răduca M., Răduca E., Budai A.M., Muntean F., Finite Element Analysis of Natural Frequencies and Mass Participation Coefficients for Thin Plates With Defects, Scientific Bulletin of “Politehni-ca” University of Timisoara, tom 57, no. 71, 2012, 43-53.
[12] Elshafey A.A., Marzouk H., Haddara M.R., Experimental Damage Identi-fication Using Modified Mode Shape Difference, J. Marine Sci. Appl., vol. 10, 2011, 150-155.
[13] Tufoi M., Hatiegan C., Vasile O., Gillich G.R., Dynamic Analysis of Thin Plates with Defects by Experimental and FEM Methods, Romanian Journal of Acoustics and Vibration, year 10, no. 2, 2013, 83-88.
[14] Tufoi M., Hatiegan C., Gillich G.R., Vasile O., Frequency Changes in Thin Rectangular Plates due to Geometrical Discontinuities. Part II: Fre-quency Shift Interpretation, Analele Universitatii “Eftimie Murgu” Resita, year XX, no. 3, 2013, 233-244.
[16] Zhou D., Ji T., Free vibration of rectangular plates with continuously distributed spring-mass, International Journal of Solids and Structures, vol. 43, 2006, 6502-6520.
[17] Jiu H.W., Liu A.Q., Chen H.L., Exact Solutions for Free-Vibration Analy-sis of Rectangular Plates Using Bessel Functions, Journal of Applied Me-chanics, vol. 74, 2007, 1247- 1251.
[18] Minda A.A., Minda P.F., Praisach Z.I., Furdui H., Application for Auto-mated Recognition of Damage Locations, Romanian Journal of Acoustics and Vibration, year 10, no. 2, 2013, 89-92.
[19] Vanam B.C.L., Rajyalakshmi M., Inala R., Static analysis of an isotropic rectangular plate using finite element analysis (FEA), Journal of Mechani-cal Engineering Research, vol. 4, no. 4, 2012, 148-162.
[20] Tufoi M., Vela I., Marta C., Amariei D., Tuta A.I., Mituletu C., Studies on optimization of withdrawing cylinder at vertical continuous casting of steel, Proceedings of Advances in Control, Chemical Engineering, Civil En-gineering and Mechanical EnEn-gineering Conference, 2010, 119-124. [21] Cojocaru V., Deformation Analysis of Asymmetric Component Loaded
by Centrifugal Force Using the Finite Element Method, Robotica & Man-agement, vol. 15, no. 2, 2010, 13-15.
[22] Nedelcu D., Proiectare şi simulare numerică cu SOLIDWORKS (Digital Prototyping and Numerical Simulation with Solid-Works), Editura Euro-stampa, Timişoara, 2011.
Addresses:
• Assist. PhD. Eng. Marian-Dumitru Nedeloni, “Eftimie Murgu” University of Reşiţa, Piaţa Traian Vuia, nr. 1-4, 320085, [email protected]
• Lect. PhD. Phys. Cornel Haţiegan, “Eftimie Murgu” University of Reşiţa, Piaţa Traian Vuia, nr. 1-4, 320085, Reşiţa, [email protected]
• PhD. student Eng. Florian Muntean, “Eftimie Murgu” University of Re-şiţa, Piaţa Traian Vuia, nr. 1-4, 320085, [email protected]
• PhD. student Eng. Marcel Jurcu, “Eftimie Murgu” University of Reşiţa, Piaţa Traian Vuia, nr. 1-4, 320085, [email protected]
• Assist. PhD. student Eng. Irina Maria Terfăloagă, “Eftimie Murgu” Uni-versity of Reşiţa, Piaţa Traian Vuia, nr. 1-4, 320085 and “West” Univer-sity of Timisoara, V. Parvan Street, No. 4, [email protected]