Transcriptomics of Maternal and Fetal
Membranes Can Discriminate between
Gestational-Age Matched Preterm Neonates
with and without Cognitive Impairment
Diagnosed at 18
–
24 Months
Athina Pappas
1,2*
, Tinnakorn Chaiworapongsa
1,3, Roberto Romero
1,4,5, Steven
J. Korzeniewski
1,3,5, Josef C. Cortez
1,2, Gaurav Bhatti
1, Nardhy Gomez-Lopez
1,3,6, Sonia
S. Hassan
1,3, Seetha Shankaran
1,2, Adi L. Tarca
1,3*
1Perinatology Research Branch, Eunice Kennedy Shriver National Institute of Child Health and Human Development / NIH / DHHS, Bethesda, MD and Detroit, MI, United States of America,2Department of Pediatrics, Division of Neonatal and Perinatal Medicine, Wayne State University, Detroit, MI, United States of America,3Department of Obstetrics and Gynecology, Wayne State University, Detroit, MI, United States of America,4Department of Obstetrics and Gynecology, University of Michigan, Ann Arbor, MI, United States of America,5Department of Epidemiology and Biostatistics, Michigan State University, East Lansing, MI, United States of America,6Department of Immunology and Microbiology, Wayne State University, Detroit, MI, United States of America
*[email protected](AP);[email protected](AT)
Abstract
Background
Neurocognitive impairment among children born preterm may arise from complex
interac-tions between genes and the intra-uterine environment.
Objectives
(
1
) To characterize the transcriptomic profiles of chorioamniotic membranes in preterm
neo-nates with and without neurocognitive impairment via microarrays and (
2
) to determine if
ne-onates with neurocognitive impairment can be identified at birth.
Materials/Methods
A retrospective case-control study was conducted to examine the chorioamniotic
transcrip-tome of gestational-age matched very preterm neonates with and without neurocognitive
impairment at 18
–
24 months
’
corrected-age defined by a Bayley-III Cognitive Composite
Score
<
80 (n = 14 each). Pathway analysis with down-weighting of overlapping genes
(
PADOG
) was performed to identify KEGG pathways relevant to the phenotype. Select
dif-ferentially expressed genes were profiled using qRT-PCR and a multi-gene disease
predic-tion model was developed using linear discriminant analysis. The model
’
s predictive
performance was tested on a new set of cases and controls (n = 19 each).
OPEN ACCESS
Citation:Pappas A, Chaiworapongsa T, Romero R, Korzeniewski SJ, Cortez JC, Bhatti G, et al. (2015) Transcriptomics of Maternal and Fetal Membranes Can Discriminate between Gestational-Age Matched Preterm Neonates with and without Cognitive Impairment Diagnosed at 18–24 Months. PLoS ONE 10(3): e0118573. doi:10.1371/journal.pone.0118573
Academic Editor:Valerie W Hu, The George Washington University, UNITED STATES
Received:October 6, 2014
Accepted:January 20, 2015
Published:March 30, 2015
Copyright:This is an open access article, free of all copyright, and may be freely reproduced, distributed, transmitted, modified, built upon, or otherwise used by anyone for any lawful purpose. The work is made available under theCreative Commons CC0public domain dedication.
Data Availability Statement:Raw and preprocessed gene expression data and patient information needed to reproduce the analyses were deposited in the Gene Expression Omnibus (ID: GSE61822): (http:// www.ncbi.nlm.nih.gov/geo/query/acc.cgi?acc=
GSE61822).
Results
1
) 117 genes were differentially expressed among neonates with and without subsequent
neurocognitive impairment (p
<
0.05 and fold change
>
1.5);
2
) Gene ontology analysis
indi-cated enrichment of 19 biological processes and 3 molecular functions;
3
)
PADOG
identified
4 significantly perturbed KEGG pathways: oxidative phosphorylation, Parkinson
’
s disease,
Alzheimer
’
s disease and Huntington
’
s disease (q-value
<
0.1);
4
) 48 of 90 selected
differen-tially expressed genes were confirmed by qRT-PCR, including genes implicated in energy
metabolism, neuronal signaling, vascular permeability and response to injury (e.g.,
up-regu-lation of
SEPP1
,
APOE
,
DAB2
,
CD163
,
CXCL12
,
VWF;
down-regulation of
HAND1
,
OSR1
)
(p
<
0.05); and
5
) a multi-gene model predicted 18
–
24 month neurocognitive impairment
(using the ratios of
OSR1/VWF
and
HAND1/VWF
at birth) in a larger, independent set
(sen-sitivity = 74%, at specificity = 83%).
Conclusions
Gene expression patterns in the chorioamniotic membranes link neurocognitive impairment
in preterm infants to neurodegenerative disease pathways and might be used to predict
neurocognitive impairment. Further prospective studies are needed.
Introduction
While advances in perinatal medicine have improved the survival and short-term outcomes of
preterm neonates, rates of neurodevelopmental impairment at 18
–
24 month follow-up and
be-yond remain high [
1
–
7
]. Neurocognitive deficits are among the most prevalent and most
debil-itating forms of early childhood disabilities, reported in 23% of infants born 27
–
32 weeks
’
gestation and 37% of infants born at 22
–
26 weeks
’
gestation [
4
]. Cognitive impairment can
im-pact adaptive functioning, conceptual, social, and practical domains, and lead to high personal,
familial, societal and financial costs. The estimated US average lifetime costs to care for an
indi-vidual with intellectual impairment is $1,014,000 [
8
].
Neurocognitive disorders may arise from complex interactions between genes and the
envi-ronment, originating prior to birth. Though postnatal interventions have afforded limited
suc-cess in preventing neurocognitive and developmental impairments associated with
prematurity, prenatal interventions such as antenatal steroids [
9
–
13
] and magnesium sulfate
[
14
–
18
] provide greater population impact. The search for intrauterine or perinatal disease
pathways associated with fetal and neonatal brain injury may afford new insights into
preven-tive measures and disease pathogenesis. Other investigators have utilized mRNA levels in
blood samples collected soon after birth to identify children at risk for other
neurodevelopmen-tal disorders such as cerebral palsy [
19
] and autism [
20
].
The fetal membranes are an alternative source of fetal DNA and of human fetal stem cells
[
21
] that may be impacted by intrauterine stimuli. Stem cells derived from the fetal membranes
are available after every preterm birth and have pluripotent differentiation potential [
22
,
23
].
Embryonic [
24
,
25
] and pluripotent stem cells [
26
] have emerged as powerful tools in the study
of normal neuronal development and of neuropsychiatric disorders such as Parkinson
’
s disease
[
27
–
30
], Rett syndrome [
31
–
33
], fragile X [
34
,
35
], Down
’
s syndrome [
36
,
37
] and
schizophre-nia [
38
–
41
]. Recent data suggests that there are no significant differences between human
em-bryonic and induced pluripotent stem cell gene expression levels [
42
–
44
], thus the study of
by the Perinatal Initiative of the Wayne StateUniversity School of Medicine. ALT and SSH were also supported in part by Department of Obstetrics and Gynecology of Wayne State University. The funders had no role in study design, data collection and analysis, decision to publish, or preparation of the manuscript.
pluripotent stem cells (including fetal amnion and chorion cells) [
21
] provides a pragmatic, yet
noncontroversial methodology to readily access large numbers of relevant cells from multiple
cases and controls. Changes in gene expression of the chorioamniotic membranes may capture
in-utero insults and fetal response to injury in preterm infants. Our objectives were (1) to
char-acterize the molecular profile of the chorioamniotic membranes of preterm neonates with and
without neurocognitive impairment at 18
–
24 months
’
corrected age and (2) to determine if
ne-onates with neurocognitive impairment have a molecular signature that can be used to predict
future disease onset at the time of birth.
Materials and Methods
Study participants
A retrospective case-control study was conducted to examine the chorioamniotic membranes
of 66 very preterm neonates with and without neurocognitive impairment. Cases and controls
were singleton neonates born at Hutzel Women
’
s Hospital (Detroit, MI) between January 1,
2006 and December 31, 2010 who were matched for gestational age (+ 2 weeks) and born
be-tween 23 and 32 weeks of gestation. Neurocognitive impairment was defined by a Bayley scales
of infant development, 3
rdEdition cognitive composite score
<
80 with or without associated
neuromotor impairment at 18
–
24 months
’
corrected age [
45
]. Control infants had normal
neu-rodevelopmental assessments including cognitive testing, neurological examination and gross
motor function [
46
]. The Bayley scales of infant development, 3
rdEdition has a mean (SD)
cog-nitive composite score of 100 (15). A cut score of 80 was selected based on data from recent
population studies [
47
,
48
]. The infants
’
mothers provided written informed consent for the
collection of biological materials and clinical data for research purposes under protocols
ap-proved by the Institutional Review Boards of the
Eunice Kennedy Shriver
National Institute of
Child Health and Human Development (NICHD/NIH/DHHS, Bethesda, Maryland) and the
Human Investigation Committee of Wayne State University (Detroit, MI, USA). Neonatal and
neurodevelopmental outcomes were abstracted from the clinical records.
Sample collection
Chorioamniotic membrane samples were retrieved from the bank of biologic samples of
Wayne State University, the Detroit Medical Center, and the Perinatology Research Branch of
the
Eunice Kennedy Shriver
National Institutes of Child Health and Human Development
(NICHD) (Detroit, MI). At the time of specimen collection, the fetal membranes were
dissect-ed from the placenta, rolldissect-ed, cut into small pieces and flash-frozen using liquid nitrogen [
49
].
In addition, a section of membranes containing maternal decidua was fixed and embedded in
paraffin. 5mm paraffin sections were stained with hematoxylin and eosin and examined under
bright-field light microscopy [
50
]. Histological examinations were reported by placental
pa-thologists who were blinded to the group assignment and all clinical information.
RNA isolation
Microarray experiment
Total RNA (500 ng) was amplified and biotin-labeled with the Illumina TotalPrep RNA
Am-plification Kit (Ambion, Austin, TX, USA). Labeled cRNAs were hybridized to Illumina
’
s
HumanHT-12 Expression BeadChip (Illumina, San Diego, CA, USA). BeadChips were imaged
using a BeadArray Reader, and raw data were obtained with BeadStudio Software v3.2.7
(Illumina). Raw and preprocessed data were deposited in the Gene Expression Omnibus[
51
]
at NCBI (reviewer access link:
http://www.ncbi.nlm.nih.gov/geo/query/acc.cgi?token=
otytuigsnvutlyj&acc=GSE61822
).
qRT-PCR assays with biomark system
Total RNA (500 ng) was reverse transcribed using the SuperScript III First-Strand Synthesis
System and oligo(dT) 20 primers (Invitrogen, Carlsbad, CA, USA). TaqMan Assays (Applied
Biosystems, Foster City, CA, USA) were used for gene expression profiling on the Biomark
high-throughput qRT-PCR system (Fluidigm, San Francisco, CA, USA) according to the
man-ufacturers
’
instructions. Briefly, a 0.2X pool of specific gene expression assays (
S1 Table
)
(Ap-plied Biosystems) was used as the source of primers. Preamplification reactions contained
1.25
μ
l cDNA, 2.5
μ
l TaqMan PreAmp master mix (Applied Biosystems) and 1.25
μ
l pooled
assay mix. The reaction was performed with a thermal cycler for 14 cycles at 95°C for 15
sec-onds and 60°C for 4 minutes. After cycling, the reaction was diluted 1:5 with ddH
2O to a final
volume of 25
μ
l. Next, a Fluidigm 96.96 Dynamic Array chip was primed in an Integrated
Fluid-ic Circuit controller. Then, 2.5
μ
l 20X TaqMan gene expression assays (Applied Biosystems)
were mixed with 2.5
μ
l 2X assay loading reagent (Fluidigm) and loaded into the assay inlet on
the 96.96 array chip. 2.25
μ
l preamplified cDNA was mixed with 2.5
μ
l TaqMan Universal PCR
master mix (Applied Biosystems) and 0.25
μ
l 20X sample loading reagent (Fluidigm), and
load-ed into the sample inlet on the chip. The chip was returnload-ed to the Integratload-ed Fluidic Circuit
controller for loading. After loading the samples and assays, the chip was placed into the
Bio-mark System to run the reactions.
Statistical analysis
Clinical Data
: The maternal and neonatal demographic and clinical characteristics of the two
study groups were compared using the Wilcoxon rank-sum test or t-test for between-group
comparisons of continuous data as appropriate. The Chi-square or Fisher
’
s exact tests were
used for comparisons of categorical data. Statistical analyses of demographic data were
per-formed using SPSS version 19 (SPSS Inc, Chicago, IL). A p-value
<
0.05 was used to designate
statistical significance.
qRT-PCR experiment involving a new set of samples that could rule out some of the eventual false
positives, we used a less stringent significance cut-off in the microarray experiment to
mini-mize false negatives. Gene Ontology analysis of significant genes was conducted using
GOstats
[
56
]. Pathway analysis with down-weighting of overlapping genes (PADOG) was conducted to
identify Kyoto Encyclopedia of Genes and Genomes (KEGG) gene sets and biological pathways
relevant to the group phenotype [
57
,
58
]. PADOG leverages differential evidence from all
genes in a pathway while giving more weight to genes that are specific to a given pathway than
to those that appear in multiple pathways.
qRT-PCR Data
: Ninety differentially expressed genes based on the microarray data were
se-lected for qRT-PCR profiling in an extended set of cases and controls (n = 33 each). There
were two goals with the qRT-PCR data analysis. First, to verify the 90 genes found significant
based on microarray analysis in the first set of 14 case-control pairs, and second, to determine
accuracy of a multi-gene predictor based on these data. For the first goal, the extended set of 33
case-control pairs were used to verify the microarray results. Differential expression based on
Cycle threshold (Ct) data was inferred using p
<
0.05 from a one-tailed t-test using the direction
of change for each of the 90 genes in the microarray experiment as the hypothesis
test alternative.
For the second goal, qRT-PCR measured expression data were split into a
“
training
”
set and
a
“
test
”
set (
“
hold-out validation
”
procedure). The training/learning set included 14 cases and
14 controls that were used in the microarray experiment. The test set included 19 cases and 19
controls with blinded class membership, not used in any stage of the prediction model
develop-ment. To obtain a classifier from the training data without using any information from the test
data, all 90 candidate genes found significant by microarrays were considered as inputs in a
classifier development pipeline that we have previously described in detail [
59
] and adapted for
the qRT-PCR data in the current study. Briefly, with this procedure, each of the 90 genes was
considered in turn as a potential normalizer and log
2gene expression ratios between each
re-maining gene and the normalizer gene were computed. The log
2ratios were simply the
differ-ences in
–
Ct values of each gene and the reference gene. The gene expression ratios were then
ranked using p-values from a moderated t-test and those that did not change at least 1.2 fold
were discarded. The top ranked gene ratios were used in a linear discriminant analysis (LDA)
model implemented in the MASS package in R (
http://www.r-project.org/
). The number of top
ratios to use in the classifier was optimized by maximizing the average model sensitivity over
three cut-offs of specificity (80, 85, and 90%). The sensitivity calculations were performed
using a five time repeated three-fold cross validation procedure on the training data that
in-cluded both the ratios ranking and LDA model fitting steps, functionality that we have made
available in the maPredictDSC package [
59
] of Bioconductor (
http://www.bioconductor.org
).
The sensitivity estimate of the resulting model for the optimal number of top ratios was
deter-mined for each possible normalizer gene, and the one that provided the highest sensitivity was
retained. The ratios ranking and LDA model training were then performed on all training data
to produce a final model. The cross-validated performance on the training set for the optimum
number of predictors was determined for a quadratic discriminant analysis (QDA) and a
sup-port vector machines (SVM) classifier as well [
60
]. Implementations of these algorithms in R
were available in the
MASS
and
e1071
packages, respectively.
Results
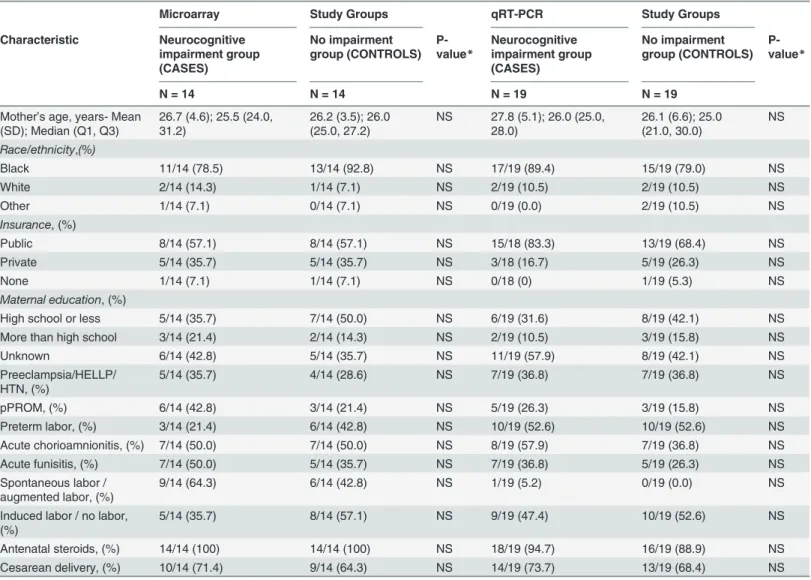
Tables
1
and
2
display the maternal and neonatal demographic and clinical characteristics.
There were no significant differences between cases and controls for the maternal variables
as-sessed. Distributions of neonatal variables assessed at delivery also did not differ between
groups. However, more neonates in the neurocognitive impairment group had evidence of
brain injury on post-natal cranial ultrasonography (including severe
periventricular-intraven-tricular hemorrhage, perivenperiventricular-intraven-tricular leukomalacia and ventriculomegaly), as expected. Median
cognitive scores (±SD) were 70 ± 8.8 (range 54
–
75) in the neurocognitive impairment group
and 90 ± 8.0 (range 85
–
115) in the control group. Eight children in the neurocognitive
im-pairment group had cerebral palsy.
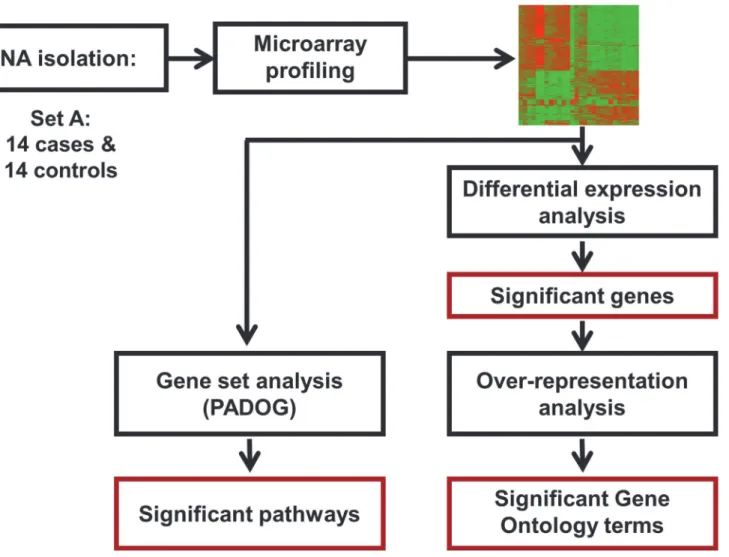
Microarray results
Differential expression analysis revealed moderate changes in the chorioamniotic membrane
transcriptome of preterm neonates with and without neurocognitive impairment at 18
–
24
months: 133 probes corresponding to 117 unique genes were differentially expressed (p
<
0.05
and fold change
>
1.5) (
Tables
3
and
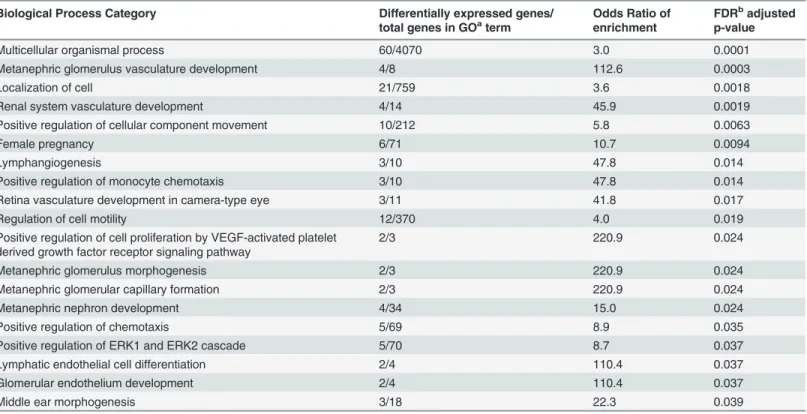
4). Gene ontology analysis indicated enrichment of 19
Fig 1. Microarray study flow diagram.The microarray analysis was performed on 14 cases and 14 controls (Set A) to identify significant genes, KEGG pathways and Gene Ontology terms.
biological processes (e.g., positive regulation of cell proliferation by VEGF-activated platelet
de-rived growth factor receptor signaling pathway, etc.) and 3 molecular functions (cytokine
bind-ing, vascular-endothelial growth factor receptor activity and vascular-endothelial growth factor
receptor binding) as shown in
Tables
5
and
6. Pathway analysis with down-weighting of
over-lapping genes that uses information from all genes in a pathway to compute a pathway
enrich-ment score, indicated four significant KEGG pathways: oxidative phosphorylation, Parkinson
’
s
disease, Alzheimer
’
s disease and Huntington
’
s disease (q-value
<
0.1). Given the significant
en-richment of biological processes, molecular functions and pathways identified, we selected
genes involved in oxidative phosphorylation, mitochondrial function (central components of
the aforementioned pathways) as well as other genes associated with neuronal development,
signaling and response to injury for qRT-PCR validation.
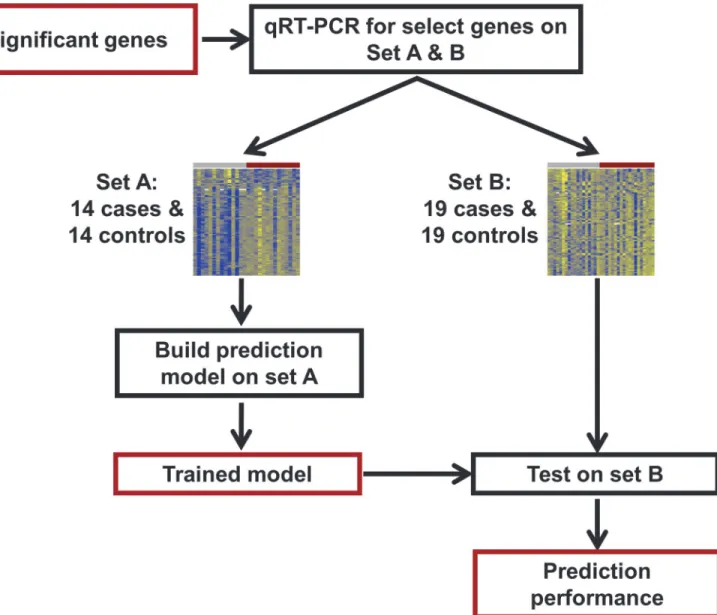
Fig 2. qRT-PCR study flow diagram.Differentially expressed genes identified from the microarray study were profiled using qRT-PCR for validation and construction of a multi-gene disease classifier using an extended set of 33 cases and 33 controls. Set A was used to build the prediction model and then this model was tested on set B, consisting of 19 cases and 19 controls.
qRT-PCR results
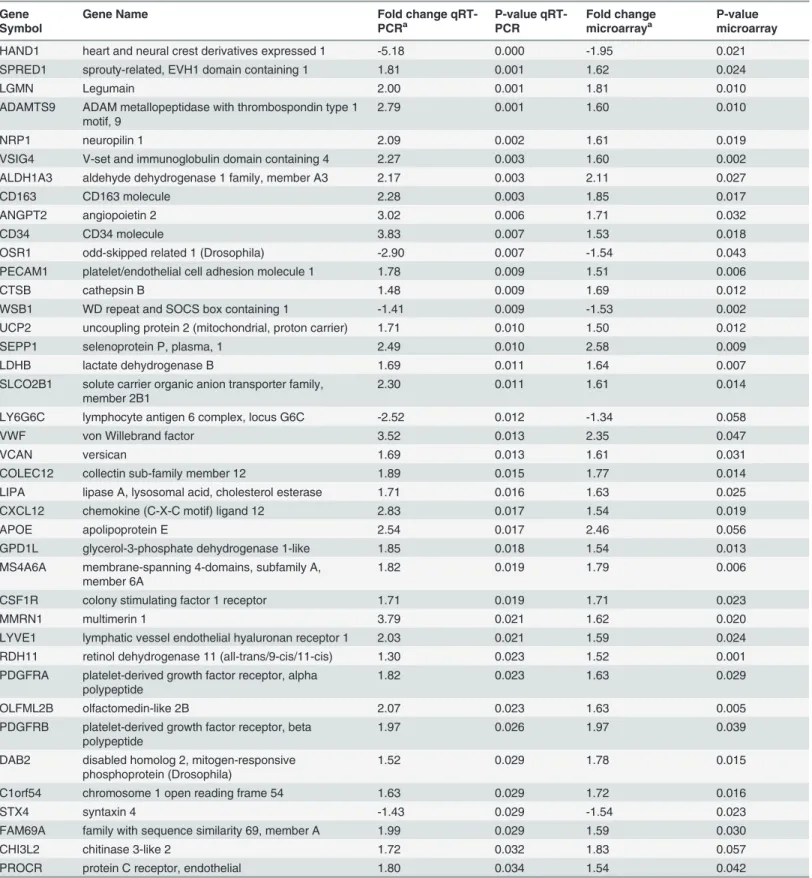
48 out of 90 selected differentially expressed genes were confirmed by qRT-PCR, including
genes implicated in neuroinflammation, neurodegeneration and cognitive disorders (e.g., up
regulation of
SEPP1
,
APOE
,
DAB2
,
CD163
,
CXCL12
,
VWF
and down-regulation of
HAND1
,
OSR1
) (p
<
0.05). (Table 7) In addition to genes previously described as playing a critical role in
cognition, genes involved in neuronal differentiation, signaling, vascular permeability and
cel-lular metabolism also were identified.
Gene-based classifier
A gene-based classifier was developed using qRT-PCR measured expression data from 14
con-trols and 14 cases using a vetted pipeline that automatically determines the appropriate
Table 1. Baseline maternal characteristics of the two study groups.Microarray Study Groups qRT-PCR Study Groups
Characteristic Neurocognitive impairment group (CASES)
No impairment group (CONTROLS)
P-value*
Neurocognitive impairment group (CASES)
No impairment group (CONTROLS)
P-value*
N = 14 N = 14 N = 19 N = 19
Mother’s age, years- Mean (SD); Median (Q1, Q3)
26.7 (4.6); 25.5 (24.0, 31.2)
26.2 (3.5); 26.0 (25.0, 27.2)
NS 27.8 (5.1); 26.0 (25.0, 28.0)
26.1 (6.6); 25.0 (21.0, 30.0)
NS
Race/ethnicity,(%)
Black 11/14 (78.5) 13/14 (92.8) NS 17/19 (89.4) 15/19 (79.0) NS
White 2/14 (14.3) 1/14 (7.1) NS 2/19 (10.5) 2/19 (10.5) NS
Other 1/14 (7.1) 0/14 (7.1) NS 0/19 (0.0) 2/19 (10.5) NS
Insurance, (%)
Public 8/14 (57.1) 8/14 (57.1) NS 15/18 (83.3) 13/19 (68.4) NS
Private 5/14 (35.7) 5/14 (35.7) NS 3/18 (16.7) 5/19 (26.3) NS
None 1/14 (7.1) 1/14 (7.1) NS 0/18 (0) 1/19 (5.3) NS
Maternal education, (%)
High school or less 5/14 (35.7) 7/14 (50.0) NS 6/19 (31.6) 8/19 (42.1) NS
More than high school 3/14 (21.4) 2/14 (14.3) NS 2/19 (10.5) 3/19 (15.8) NS
Unknown 6/14 (42.8) 5/14 (35.7) NS 11/19 (57.9) 8/19 (42.1) NS
Preeclampsia/HELLP/ HTN, (%)
5/14 (35.7) 4/14 (28.6) NS 7/19 (36.8) 7/19 (36.8) NS
pPROM, (%) 6/14 (42.8) 3/14 (21.4) NS 5/19 (26.3) 3/19 (15.8) NS
Preterm labor, (%) 3/14 (21.4) 6/14 (42.8) NS 10/19 (52.6) 10/19 (52.6) NS
Acute chorioamnionitis, (%) 7/14 (50.0) 7/14 (50.0) NS 8/19 (57.9) 7/19 (36.8) NS
Acute funisitis, (%) 7/14 (50.0) 5/14 (35.7) NS 7/19 (36.8) 5/19 (26.3) NS
Spontaneous labor / augmented labor, (%)
9/14 (64.3) 6/14 (42.8) NS 1/19 (5.2) 0/19 (0.0) NS
Induced labor / no labor, (%)
5/14 (35.7) 8/14 (57.1) NS 9/19 (47.4) 10/19 (52.6) NS
Antenatal steroids, (%) 14/14 (100) 14/14 (100) NS 18/19 (94.7) 16/19 (88.9) NS
Cesarean delivery, (%) 10/14 (71.4) 9/14 (64.3) NS 14/19 (73.7) 13/19 (68.4) NS
HTN- hypertension; HELLP- Hemolysis, elevated liver enzymes, low platelet count; pPROM- preterm premature rupture of membranes. Insurance status was missing for 1 participant in the qRT-PCR experiment.
*P-value is significant at alpha<0.05 level of significance.
number of markers using an internal cross-validation procedure. The candidate predictors
considered as inputs in this pipeline were the 90 genes selected based on the microarray data.
Instead of using the Ct value of a reference gene (e.g., GAPDH) as an internal normalizer for
each sample, we searched for the best normalizer among the 90 candidate genes. In doing so,
we attempted to accomplish three goals: 1) convert the Ct values into a platform-independent
measure (the ratio of the expression of two genes), 2) explore potential gene interactions in
pre-dicting neurocognitive outcome, and 3) avoid inclusion of a gene that brings no discrimination
between phenotypes in the model. Our methodology identified the ratios
OSR1/VWF
and
HAND1/VWF
as providing the best cross-validated performance on the training data when
used as the inputs in a linear discriminant analysis model (70% average sensitivity over three
specificity values: 80, 85, and 90%). Other classifiers such as quadratic discriminant analysis
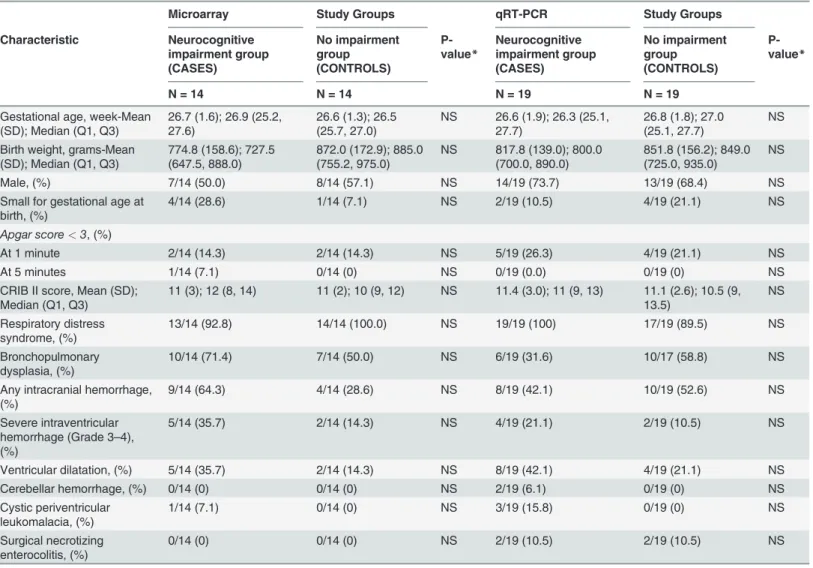
Table 2. Baseline neonatal characteristics of the two study groups.Microarray Study Groups qRT-PCR Study Groups
Characteristic Neurocognitive impairment group (CASES) No impairment group (CONTROLS) P-value* Neurocognitive impairment group (CASES) No impairment group (CONTROLS) P-value*
N = 14 N = 14 N = 19 N = 19
Gestational age, week-Mean (SD); Median (Q1, Q3)
26.7 (1.6); 26.9 (25.2, 27.6)
26.6 (1.3); 26.5 (25.7, 27.0)
NS 26.6 (1.9); 26.3 (25.1, 27.7)
26.8 (1.8); 27.0 (25.1, 27.7)
NS
Birth weight, grams-Mean (SD); Median (Q1, Q3)
774.8 (158.6); 727.5 (647.5, 888.0)
872.0 (172.9); 885.0 (755.2, 975.0)
NS 817.8 (139.0); 800.0 (700.0, 890.0)
851.8 (156.2); 849.0 (725.0, 935.0)
NS
Male, (%) 7/14 (50.0) 8/14 (57.1) NS 14/19 (73.7) 13/19 (68.4) NS
Small for gestational age at birth, (%)
4/14 (28.6) 1/14 (7.1) NS 2/19 (10.5) 4/19 (21.1) NS
Apgar score<3, (%)
At 1 minute 2/14 (14.3) 2/14 (14.3) NS 5/19 (26.3) 4/19 (21.1) NS
At 5 minutes 1/14 (7.1) 0/14 (0) NS 0/19 (0.0) 0/19 (0) NS
CRIB II score, Mean (SD); Median (Q1, Q3)
11 (3); 12 (8, 14) 11 (2); 10 (9, 12) NS 11.4 (3.0); 11 (9, 13) 11.1 (2.6); 10.5 (9, 13.5)
NS
Respiratory distress syndrome, (%)
13/14 (92.8) 14/14 (100.0) NS 19/19 (100) 17/19 (89.5) NS
Bronchopulmonary dysplasia, (%)
10/14 (71.4) 7/14 (50.0) NS 6/19 (31.6) 10/17 (58.8) NS
Any intracranial hemorrhage, (%)
9/14 (64.3) 4/14 (28.6) NS 8/19 (42.1) 10/19 (52.6) NS
Severe intraventricular hemorrhage (Grade 3–4), (%)
5/14 (35.7) 2/14 (14.3) NS 4/19 (21.1) 2/19 (10.5) NS
Ventricular dilatation, (%) 5/14 (35.7) 2/14 (14.3) NS 8/19 (42.1) 4/19 (21.1) NS
Cerebellar hemorrhage, (%) 0/14 (0) 0/14 (0) NS 2/19 (6.1) 0/19 (0) NS
Cystic periventricular leukomalacia, (%)
1/14 (7.1) 0/14 (0) NS 3/19 (15.8) 0/19 (0) NS
Surgical necrotizing enterocolitis, (%)
0/14 (0) 0/14 (0) NS 2/19 (10.5) 2/19 (10.5) NS
CRIB II score- clinical risk index for babies score;
*P-value is significant at alpha<0.05 level of significance
For all samples used in the microarray and qRT-PCR experiments, the 28S/18S ratios for RNA ranged from 1.7 to 2.0 and RNA integrity numbers ranged from 7.5 to 9.6.
Table 3. Overexpressed Illumina probes (N = 105) in the neurocognitive impairment group compared to the no impairment group.
Illumina Probe ID ENTREZa SYMBOLb Gene Name Fold Changec P-Value
ILMN_1768719 51109 RDH11 retinol dehydrogenase 11 (all-trans/9-cis/11-cis) 1.52 0.001
ILMN_1669409 11326 VSIG4 V-set and immunoglobulin domain containing 4 1.60 0.002
ILMN_3250257 94 ACVRL1 activin A receptor type II-like 1 2.26 0.004
ILMN_1765557 25903 OLFML2B olfactomedin-like 2B 1.63 0.005
ILMN_1797731 64231 MS4A6A membrane-spanning 4-domains, subfamily A, member 6A 1.79 0.006
ILMN_1689518 5175 PECAM1 platelet/endothelial cell adhesion molecule 1 1.51 0.006
ILMN_1701441 1902 LPAR1 lysophosphatidic acid receptor 1 1.52 0.007
ILMN_1728132 3945 LDHB lactate dehydrogenase B 1.64 0.007
ILMN_2109416 256236 NAPSB napsin B aspartic peptidase, pseudogene 1.82 0.008
ILMN_2060413 100133941 CD24 CD24 molecule 2.01 0.009
ILMN_1785071 6414 SEPP1 selenoprotein P, plasma, 1 2.58 0.009
ILMN_1805543 56999 ADAMTS9 ADAM metallopeptidase with thrombospondin type 1 motif, 9 1.60 0.010
ILMN_1745963 2350 FOLR2 folate receptor 2 (fetal) 1.53 0.010
ILMN_1678729 64374 SIL1 SIL1 homolog, endoplasmic reticulum chaperone (S. cerevisiae) 1.73 0.010
ILMN_1698019 5641 LGMN legumain 1.81 0.010
ILMN_1668629 401115 C4orf48 chromosome 4 open reading frame 48 1.64 0.010
ILMN_2332964 5641 LGMN legumain 1.69 0.011
ILMN_1685625 7351 UCP2 uncoupling protein 2 (mitochondrial, proton carrier) 1.50 0.012
ILMN_2359742 1508 CTSB cathepsin B 1.69 0.012
ILMN_1763000 55803 ADAP2 ArfGAP with dual PH domains 2 1.52 0.012
ILMN_1662619 7035 TFPI tissue factor pathway inhibitor (lipoprotein-associated coagulation inhibitor) 1.64 0.012 ILMN_2053103 30061 SLC40A1 solute carrier family 40 (iron-regulated transporter), member 1 2.46 0.013
ILMN_1694106 23171 GPD1L glycerol-3-phosphate dehydrogenase 1-like 1.54 0.013
ILMN_1707124 7035 TFPI tissue factor pathway inhibitor (lipoprotein-associated coagulation inhibitor) 1.75 0.013
ILMN_1668134 2944 GSTM1 glutathione S-transferase mu 1 1.53 0.014
ILMN_1761199 11309 SLCO2B1 solute carrier organic anion transporter family, member 2B1 1.61 0.014
ILMN_1689088 81035 COLEC12 collectin sub-family member 12 1.77 0.014
ILMN_2087656 11309 SLCO2B1 solute carrier organic anion transporter family, member 2B1 1.95 0.014
ILMN_1651262 3182 HNRNPAB heterogeneous nuclear ribonucleoprotein A/B 1.53 0.015
ILMN_1764228 1601 DAB2 disabled homolog 2, mitogen-responsive phosphoprotein (Drosophila) 1.78 0.015
ILMN_1702231 79630 C1orf54 chromosome 1 open reading frame 54 1.72 0.016
ILMN_1666503 27147 DENND2A DENN/MADD domain containing 2A 1.66 0.016
ILMN_1687921 339123 JMJD8 jumonji domain containing 8 1.52 0.017
ILMN_1722622 9332 CD163 CD163 molecule 1.85 0.017
ILMN_1732799 947 CD34 CD34 molecule 1.53 0.018
ILMN_1782419 2791 GNG11 guanine nucleotide binding protein (G protein), gamma 11 1.68 0.018
ILMN_1699574 8829 NRP1 neuropilin 1 1.61 0.019
ILMN_1763568 84287 ZDHHC16 zincfinger, DHHC-type containing 16 1.55 0.019
ILMN_2379599 9332 CD163 CD163 molecule 1.79 0.019
ILMN_1773389 5360 PLTP phospholipid transfer protein 1.75 0.019
ILMN_1791447 6387 CXCL12 chemokine (C-X-C motif) ligand 12 1.54 0.019
ILMN_1670672 140738 TMEM37 transmembrane protein 37 1.65 0.020
ILMN_1660114 22915 MMRN1 multimerin 1 1.62 0.020
ILMN_1666471 27089 UQCRQ ubiquinol-cytochrome c reductase, complex III subunit VII, 9.5kDa 1.54 0.021
ILMN_2366391 5052 PRDX1 peroxiredoxin 1 1.60 0.021
Table 3. (Continued)
Illumina Probe ID ENTREZa SYMBOLb Gene Name Fold Changec P-Value
ILMN_1795183 6035 RNASE1 ribonuclease, RNase A family, 1 (pancreatic) 1.65 0.022
ILMN_1812968 54345 SOX18 SRY (sex determining region Y)-box 18 1.65 0.022
ILMN_2281810 5672 PSG4 pregnancy specific beta-1-glycoprotein 4 1.88 0.022
ILMN_1686623 1436 CSF1R colony stimulating factor 1 receptor 1.71 0.023
ILMN_2091347 3417 IDH1 isocitrate dehydrogenase 1 (NADP+), soluble 1.54 0.023
ILMN_1808114 10894 LYVE1 lymphatic vessel endothelial hyaluronan receptor 1 1.59 0.024
ILMN_2128428 1601 DAB2 disabled homolog 2, mitogen-responsive phosphoprotein (Drosophila) 1.67 0.024
ILMN_1693530 5671 PSG3 pregnancy specific beta-1-glycoprotein 3 2.43 0.024
ILMN_1722713 2192 FBLN1 fibulin 1 1.91 0.024
ILMN_1804277 161742 SPRED1 sprouty-related, EVH1 domain containing 1 1.62 0.024
ILMN_1718063 3988 LIPA lipase A, lysosomal acid, cholesterol esterase 1.63 0.025
ILMN_1728734 5673 PSG5 pregnancy specific beta-1-glycoprotein 5 1.66 0.025
ILMN_1668092 90952 ESAM endothelial cell adhesion molecule 1.81 0.025
ILMN_1757351 6278 S100A7 S100 calcium binding protein A7 1.71 0.025
ILMN_1657862 191 AHCY adenosylhomocysteinase 1.68 0.025
ILMN_2341229 947 CD34 CD34 molecule 1.72 0.025
ILMN_1672611 1009 CDH11 cadherin 11, type 2, OB-cadherin (osteoblast) 2.02 0.026
ILMN_1679838 51186 WBP5 WW domain binding protein 5 1.55 0.027
ILMN_2139970 220 ALDH1A3 aldehyde dehydrogenase 1 family, member A3 2.11 0.027
ILMN_2363658 7837 PXDN peroxidasin homolog (Drosophila) 1.63 0.027
ILMN_3243471 10330 CNPY2 canopy 2 homolog (zebrafish) 1.62 0.028
ILMN_1723684 2532 DARC Duffy blood group, chemokine receptor 1.74 0.029
ILMN_1681949 5156 PDGFRA platelet-derived growth factor receptor, alpha polypeptide 1.63 0.029
ILMN_1672536 2192 FBLN1 fibulin 1 2.63 0.029
ILMN_2117330 4708 NDUFB2 NADH dehydrogenase (ubiquinone) 1 beta subcomplex, 2, 8kDa 1.60 0.030
ILMN_3307791 388650 FAM69A family with sequence similarity 69, member A 1.59 0.030
ILMN_2062701 2619 GAS1 growth arrest-specific 1 2.04 0.031
ILMN_1729188 57817 HAMP hepcidin antimicrobial peptide 1.85 0.031
ILMN_1663640 4128 MAOA monoamine oxidase A 1.71 0.031
ILMN_1687301 1462 VCAN versican 1.61 0.031
ILMN_1774207 285 ANGPT2 angiopoietin 2 1.71 0.032
ILMN_1752728 2517 FUCA1 fucosidase, alpha-L- 1, tissue 1.63 0.033
ILMN_1728197 7122 CLDN5 claudin 5 1.61 0.034
ILMN_1748473 55303 GIMAP4 GTPase, IMAP family member 4 1.55 0.034
ILMN_2309615 5675 PSG6 pregnancy specific beta-1-glycoprotein 6 1.93 0.034
ILMN_1700541 2192 FBLN1 fibulin 1 2.27 0.034
ILMN_2366388 5052 PRDX1 peroxiredoxin 1 1.54 0.035
ILMN_1717163 2162 F13A1 coagulation factor XIII, A1 polypeptide 1.65 0.035
ILMN_1654151 1345 COX6C cytochrome c oxidase subunit VIc 1.60 0.035
ILMN_2086470 5156 PDGFRA platelet-derived growth factor receptor, alpha polypeptide 1.68 0.038
ILMN_1741133 4830 NME1 NME/NM23 nucleoside diphosphate kinase 1 1.51 0.039
ILMN_1815057 5159 PDGFRB platelet-derived growth factor receptor, beta polypeptide 1.97 0.039
ILMN_1772910 2619 GAS1 growth arrest-specific 1 3.08 0.039
ILMN_1696360 1508 CTSB cathepsin B 1.50 0.040
ILMN_1791576 22856 CHSY1 chondroitin sulfate synthase 1 1.59 0.041
ILMN_1691572 7263 TST thiosulfate sulfurtransferase (rhodanese) 1.55 0.041
ILMN_1713807 57134 MAN1C1 mannosidase, alpha, class 1C, member 1 1.53 0.042
and support vector machines had similar, yet lower performance (62 and 68% respectively),
and hence the linear discriminant analysis model was retained as the final model.
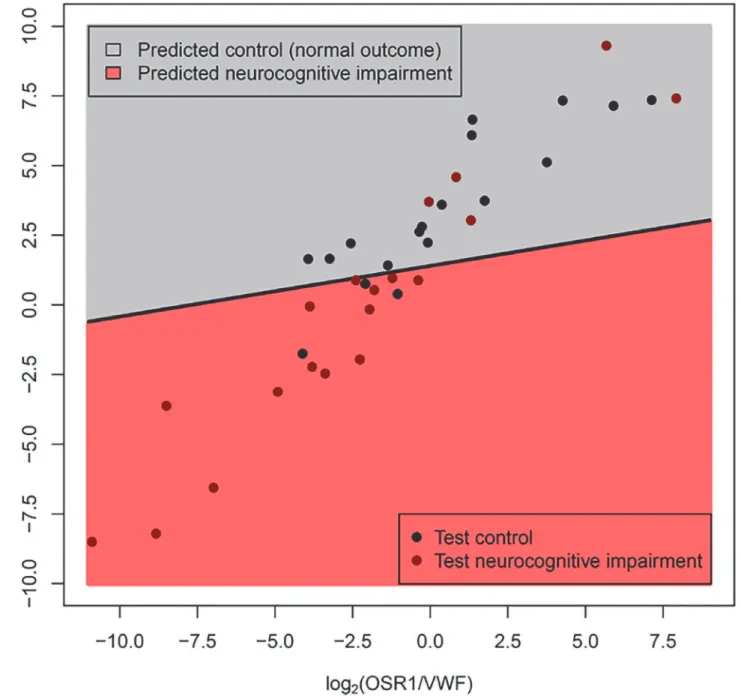
This model had a sensitivity of 74% and a specificity of 83% when applied to a new set of
pa-tients (18 Controls and 19 Disease, as 1 Control was discarded due to PCR failures for multiple
genes) (See
Fig. 3). Although most of the misclassified samples are close to the decision
bound-ary (black line in
Fig. 3), two of the misclassified cases with neurocognitive impairment had
very high
OSR1/VWF
and
HAND1/VWF
gene ratios; these cases had multiple post-natal
com-plications (specifically, severe bronchopulmonary dysplasia, necrotizing enterocolitis and
post-natal sepsis) often associated with neurodevelopmental impairment. When compared with
clinical covariates available at the time of birth, the molecular prediction model had superior
Area Under the Receiver Operating Characteristic curve (AUC 0.77 vs 0.57, p = 0.049) as
deter-mined by a bootstrap based test implemented in the
pROC
package [
61
]. (Fig. 4).
As suggested by an anonymous reviewer, we also examined the effect of gestational age
(GA) at delivery on the quality of predictions of the gene based classifier. The subjects in the
test dataset were divided based on gestational age at delivery: extremely preterm (GA from 23.9
to 26.9) and very preterm (GA from 27.0 to 32.1), where the cut-off point of 27.0 weeks was the
median of gestational age at delivery in the test set. Although the point estimate of the area
under the receiver operating characteristic curve (AUC) was higher for the extremely preterm
group (AUC = 82%) compared to the one for the very preterm group (AUC = 70%) the
differ-ence was not significant, and including GA at delivery as a covariate in the LDA model (either
as a main effect or interaction with the two gene based predictors) did not improve the
classifier prediction.
Discussion
The principal findings of our study were:
1
) the chorioamniotic membrane transcriptome of
preterm neonates with cognitive impairment differed significantly from that of neonates with
normal neurodevelopment;
2
) Gene ontology analysis indicated enrichment of 19 biological
processes (e.g., positive regulation of cell proliferation by VEGF-activated platelet derived
Table 3. (Continued)Illumina Probe ID ENTREZa SYMBOLb Gene Name Fold Changec P-Value
ILMN_1717262 10544 PROCR protein C receptor, endothelial 1.54 0.042
ILMN_1651950 8460 TPST1 tyrosylprotein sulfotransferase 1 1.66 0.042
ILMN_2333670 6035 RNASE1 ribonuclease, RNase A family, 1 (pancreatic) 1.81 0.043
ILMN_1670899 2201 FBN2 fibrillin 2 1.71 0.043
ILMN_1751851 51816 CECR1 cat eye syndrome chromosome region, candidate 1 1.50 0.043
ILMN_1810852 3915 LAMC1 laminin, gamma 1 (formerly LAMB2) 1.59 0.043
ILMN_1789196 7169 TPM2 tropomyosin 2 (beta) 1.79 0.044
ILMN_1721035 64231 MS4A6A membrane-spanning 4-domains, subfamily A, member 6A 1.59 0.046
ILMN_2400935 6876 TAGLN transgelin 1.56 0.047
ILMN_1752755 7450 VWF von Willebrand factor 2.35 0.047
ILMN_1801776 5678 PSG9 pregnancy specific beta-1-glycoprotein 9 1.72 0.049
ILMN_1764483 5670 PSG2 pregnancy specific beta-1-glycoprotein 2 1.83 0.049
a-Entrez gene identi fier;
b-Symbol- taken from the gene database which corresponds to the of
ficial Human Genome Organization Gene Nomenclature Committee symbols c-Fold change (the number of times the average expression level in the chorioamniotic membranes of the neurocognitive impairment group differs from the average expression level in the normal comparison group
growth factor receptor signaling pathway, etc.) and 3 molecular functions (cytokine binding,
vascular-endothelial growth factor receptor activity and vascular-endothelial growth factor
re-ceptor binding);
3
)
PADOG
identified 4 significantly enriched KEGG pathways: oxidative
phos-phorylation, Parkinson
’
s disease, Alzheimer
’
s disease and Huntington
’
s disease (q-value
<
0.1);
4
) 48 out of 90 selected differentially expressed genes were confirmed by qRT-PCR, including
genes implicated in energy metabolism, neuronal differentiation, signaling, vascular
permeabil-ity and response to injury (e.g., up-regulation of
SEPP1
,
APOE
,
DAB2
,
CD163
,
CXCL12
,
VWF
;
down-regulation of
HAND1
,
OSR1
) (p
<
0.05 and fold change
>
1.5); and
5
) cases with
neuro-cognitive impairment at 18
–
24 months could be identified at birth apart from gestational
age-matched controls with a sensitivity of 74% at a specificity of 83% using a molecular signature
determined in an independent sample (using ratios of OSR1/VWF and HAND1/VWF in the
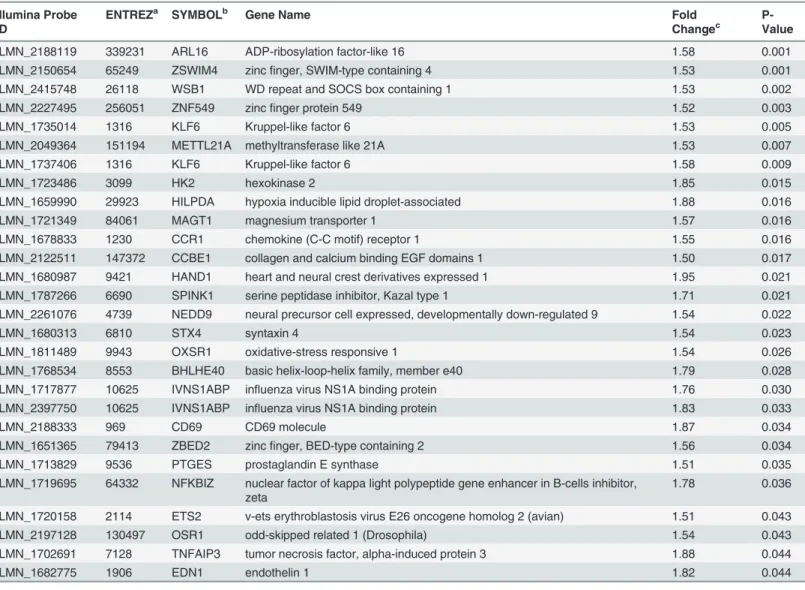
Table 4. Underexpressed Illumina probes (N = 28) in the neurocognitive impairment group compared to the no impairment group.Illumina Probe ID
ENTREZa SYMBOLb Gene Name Fold
Changec
P-Value
ILMN_2188119 339231 ARL16 ADP-ribosylation factor-like 16 1.58 0.001
ILMN_2150654 65249 ZSWIM4 zincfinger, SWIM-type containing 4 1.53 0.001
ILMN_2415748 26118 WSB1 WD repeat and SOCS box containing 1 1.53 0.002
ILMN_2227495 256051 ZNF549 zincfinger protein 549 1.52 0.003
ILMN_1735014 1316 KLF6 Kruppel-like factor 6 1.53 0.005
ILMN_2049364 151194 METTL21A methyltransferase like 21A 1.53 0.007
ILMN_1737406 1316 KLF6 Kruppel-like factor 6 1.58 0.009
ILMN_1723486 3099 HK2 hexokinase 2 1.85 0.015
ILMN_1659990 29923 HILPDA hypoxia inducible lipid droplet-associated 1.88 0.016
ILMN_1721349 84061 MAGT1 magnesium transporter 1 1.57 0.016
ILMN_1678833 1230 CCR1 chemokine (C-C motif) receptor 1 1.55 0.016
ILMN_2122511 147372 CCBE1 collagen and calcium binding EGF domains 1 1.50 0.017
ILMN_1680987 9421 HAND1 heart and neural crest derivatives expressed 1 1.95 0.021
ILMN_1787266 6690 SPINK1 serine peptidase inhibitor, Kazal type 1 1.71 0.021
ILMN_2261076 4739 NEDD9 neural precursor cell expressed, developmentally down-regulated 9 1.54 0.022
ILMN_1680313 6810 STX4 syntaxin 4 1.54 0.023
ILMN_1811489 9943 OXSR1 oxidative-stress responsive 1 1.54 0.026
ILMN_1768534 8553 BHLHE40 basic helix-loop-helix family, member e40 1.79 0.028
ILMN_1717877 10625 IVNS1ABP influenza virus NS1A binding protein 1.76 0.030
ILMN_2397750 10625 IVNS1ABP influenza virus NS1A binding protein 1.83 0.033
ILMN_2188333 969 CD69 CD69 molecule 1.87 0.034
ILMN_1651365 79413 ZBED2 zincfinger, BED-type containing 2 1.56 0.034
ILMN_1713829 9536 PTGES prostaglandin E synthase 1.51 0.035
ILMN_1719695 64332 NFKBIZ nuclear factor of kappa light polypeptide gene enhancer in B-cells inhibitor, zeta
1.78 0.036
ILMN_1720158 2114 ETS2 v-ets erythroblastosis virus E26 oncogene homolog 2 (avian) 1.51 0.043
ILMN_2197128 130497 OSR1 odd-skipped related 1 (Drosophila) 1.54 0.043
ILMN_1702691 7128 TNFAIP3 tumor necrosis factor, alpha-induced protein 3 1.88 0.044
ILMN_1682775 1906 EDN1 endothelin 1 1.82 0.044
a-Entrez gene identification;
b-Symbol- taken from the gene database which corresponds to the official Human Genome Organization Gene Nomenclature Committee symbols
c-Fold change (the number of times the average expression level in the chorioamniotic membranes of the neurocognitive impairment group differs from the average expression level in the normal comparison group
chorioamniotic membranes). These findings support the view that disturbances in oxidative
metabolism, synaptic signaling and response to injury identified at birth, contribute elevated
risk of neurocognitive impairment assessed in early childhood.
Molecular marker odd-skipped related 1 (OSR1) gene, downregulated in
cases
The Osr1 gene encodes a zinc finger transcription factor that modulates embryonic patterning
and morphogenesis as a pair-rule gene; mutations in this gene in
Drosophila
lead to a loss of
odd segments during embryogenesis, thus the name odd-skip related [
62
]. Human Osr1
Table 5. Biological processes enriched for genes differentially expressed between the neurocognitive impairment and no impairment groups.Biological Process Category Differentially expressed genes/ total genes in GOaterm
Odds Ratio of enrichment
FDRbadjusted
p-value
Multicellular organismal process 60/4070 3.0 0.0001
Metanephric glomerulus vasculature development 4/8 112.6 0.0003
Localization of cell 21/759 3.6 0.0018
Renal system vasculature development 4/14 45.9 0.0019
Positive regulation of cellular component movement 10/212 5.8 0.0063
Female pregnancy 6/71 10.7 0.0094
Lymphangiogenesis 3/10 47.8 0.014
Positive regulation of monocyte chemotaxis 3/10 47.8 0.014
Retina vasculature development in camera-type eye 3/11 41.8 0.017
Regulation of cell motility 12/370 4.0 0.019
Positive regulation of cell proliferation by VEGF-activated platelet derived growth factor receptor signaling pathway
2/3 220.9 0.024
Metanephric glomerulus morphogenesis 2/3 220.9 0.024
Metanephric glomerular capillary formation 2/3 220.9 0.024
Metanephric nephron development 4/34 15.0 0.024
Positive regulation of chemotaxis 5/69 8.9 0.035
Positive regulation of ERK1 and ERK2 cascade 5/70 8.7 0.037
Lymphatic endothelial cell differentiation 2/4 110.4 0.037
Glomerular endothelium development 2/4 110.4 0.037
Middle ear morphogenesis 3/18 22.3 0.039
a GO: Gene ontology; b FDR: False Discovery Rate.
doi:10.1371/journal.pone.0118573.t005
Table 6. Molecular functions enriched for genes differentially expressed between the neurocognitive impairment and no impairment groups.
Molecular Function Category Differentially expressed genes/ total genes in GOa
term
Odds Ratio
FDRbadjusted
p-value
Vascular endothelial growth factor-activated receptor activity
3/5 173.1 0.0018
Vascular endothelial growth factor binding 2/3 228.6 0.032
Cytokine binding 4/40 13.0 0.037
a GO: Gene ontology b FDR: False Discovery Rate.
Table 7. Comparison of qRT-PCR and microarray analysis of select genes, with direction of change denoting change in group with neurocognitive impairment.
Gene Symbol
Gene Name Fold change
qRT-PCRa
P-value qRT-PCR
Fold change microarraya
P-value microarray
HAND1 heart and neural crest derivatives expressed 1 -5.18 0.000 -1.95 0.021
SPRED1 sprouty-related, EVH1 domain containing 1 1.81 0.001 1.62 0.024
LGMN Legumain 2.00 0.001 1.81 0.010
ADAMTS9 ADAM metallopeptidase with thrombospondin type 1 motif, 9
2.79 0.001 1.60 0.010
NRP1 neuropilin 1 2.09 0.002 1.61 0.019
VSIG4 V-set and immunoglobulin domain containing 4 2.27 0.003 1.60 0.002
ALDH1A3 aldehyde dehydrogenase 1 family, member A3 2.17 0.003 2.11 0.027
CD163 CD163 molecule 2.28 0.003 1.85 0.017
ANGPT2 angiopoietin 2 3.02 0.006 1.71 0.032
CD34 CD34 molecule 3.83 0.007 1.53 0.018
OSR1 odd-skipped related 1 (Drosophila) -2.90 0.007 -1.54 0.043
PECAM1 platelet/endothelial cell adhesion molecule 1 1.78 0.009 1.51 0.006
CTSB cathepsin B 1.48 0.009 1.69 0.012
WSB1 WD repeat and SOCS box containing 1 -1.41 0.009 -1.53 0.002
UCP2 uncoupling protein 2 (mitochondrial, proton carrier) 1.71 0.010 1.50 0.012
SEPP1 selenoprotein P, plasma, 1 2.49 0.010 2.58 0.009
LDHB lactate dehydrogenase B 1.69 0.011 1.64 0.007
SLCO2B1 solute carrier organic anion transporter family, member 2B1
2.30 0.011 1.61 0.014
LY6G6C lymphocyte antigen 6 complex, locus G6C -2.52 0.012 -1.34 0.058
VWF von Willebrand factor 3.52 0.013 2.35 0.047
VCAN versican 1.69 0.013 1.61 0.031
COLEC12 collectin sub-family member 12 1.89 0.015 1.77 0.014
LIPA lipase A, lysosomal acid, cholesterol esterase 1.71 0.016 1.63 0.025
CXCL12 chemokine (C-X-C motif) ligand 12 2.83 0.017 1.54 0.019
APOE apolipoprotein E 2.54 0.017 2.46 0.056
GPD1L glycerol-3-phosphate dehydrogenase 1-like 1.85 0.018 1.54 0.013
MS4A6A membrane-spanning 4-domains, subfamily A, member 6A
1.82 0.019 1.79 0.006
CSF1R colony stimulating factor 1 receptor 1.71 0.019 1.71 0.023
MMRN1 multimerin 1 3.79 0.021 1.62 0.020
LYVE1 lymphatic vessel endothelial hyaluronan receptor 1 2.03 0.021 1.59 0.024
RDH11 retinol dehydrogenase 11 (all-trans/9-cis/11-cis) 1.30 0.023 1.52 0.001
PDGFRA platelet-derived growth factor receptor, alpha polypeptide
1.82 0.023 1.63 0.029
OLFML2B olfactomedin-like 2B 2.07 0.023 1.63 0.005
PDGFRB platelet-derived growth factor receptor, beta polypeptide
1.97 0.026 1.97 0.039
DAB2 disabled homolog 2, mitogen-responsive phosphoprotein (Drosophila)
1.52 0.029 1.78 0.015
C1orf54 chromosome 1 open reading frame 54 1.63 0.029 1.72 0.016
STX4 syntaxin 4 -1.43 0.029 -1.54 0.023
FAM69A family with sequence similarity 69, member A 1.99 0.029 1.59 0.030
CHI3L2 chitinase 3-like 2 1.72 0.032 1.83 0.057
PROCR protein C receptor, endothelial 1.80 0.034 1.54 0.042
consists of three exons located on chromosome 2p24 [
63
], a region recently implicated as a
candidate risk susceptibility locus for autism spectrum disorder [
64
,
65
].
The Osr1 transcription factor encoded by this gene may have functional proteprotein
in-teractions with Oxidative stress responsive 1 kinase (OXSR1) [
66
,
67
]. This kinase
phosphory-lates the Na
+-K
+-2Cl
—(NKCC1) co-transporter, responsible for the high intra-cellular chloride
concentration of immature neurons contributing to their depolarization (and excitation) on
GABA binding [
68
]. GABA, the main inhibitory neurotransmitter in adults, serves as an
excit-atory neurotransmitter during fetal and early neonatal life [
69
,
70
]. GABA excitation stimulates
giant depolarizing potentials which mediate activity-dependent stimulation of neuronal
growth, migration, synapse formation and development of functional brain networks.
Dysre-gulation of early GABAergic signaling may lead to aberrant neuronal circuitry and impaired
cognitive functioning and is implicated in autism. Interestingly, the Osr1 transcription factor
plays a role in regulating renal development, a tissue rich in chloride transporters and vascular
tight junctions [
71
,
72
].
Molecular marker heart and neural crest derivatives expressed 1
(HAND1), downregulated in cases
Heart and neural crest derivatives expressed 1 (Hand1, also known as eHand) encodes a
Twist-family basic helix-loop-helix transcription factor that plays a role in placentation, trophoblast
differentiation [
73
–
76
], fetal cardiac [
77
,
78
] and fetal sympathetic nervous system
develop-ment [
79
–
81
]: tissues all known for their high energy demands and sensitivity to hypoxia
sig-naling. Until recently, understanding of Hand1 function remained poor due to the early
embryonic lethality of Hand1-knockout animals [
80
,
82
]. Null and hypomorphic mouse
models revealed defects in extraembryonic mesoderm and trophoblast giant cells associated
with reduced expression of Placental Lactogen I (
Pl1
), a placental hormone important for
maintenance of the corpus luteum and normal progesterone levels [
82
,
83
]. In addition, a
de-velopmental arrest in yolk sac vasculogenesis was revealed, followed by increased expression of
angiogenic growth factors [
75
]. Despite these findings, Hand1 deficient embryos had
down-regulated HIF-1
α
mRNA expression.
Recently, Breckenridge et al reported that Hand1 was induced by hypoxia and HIF-1
α
bind-ing upstream of the Hand1 transcriptional start site in mice; additionally, Hand1 expression
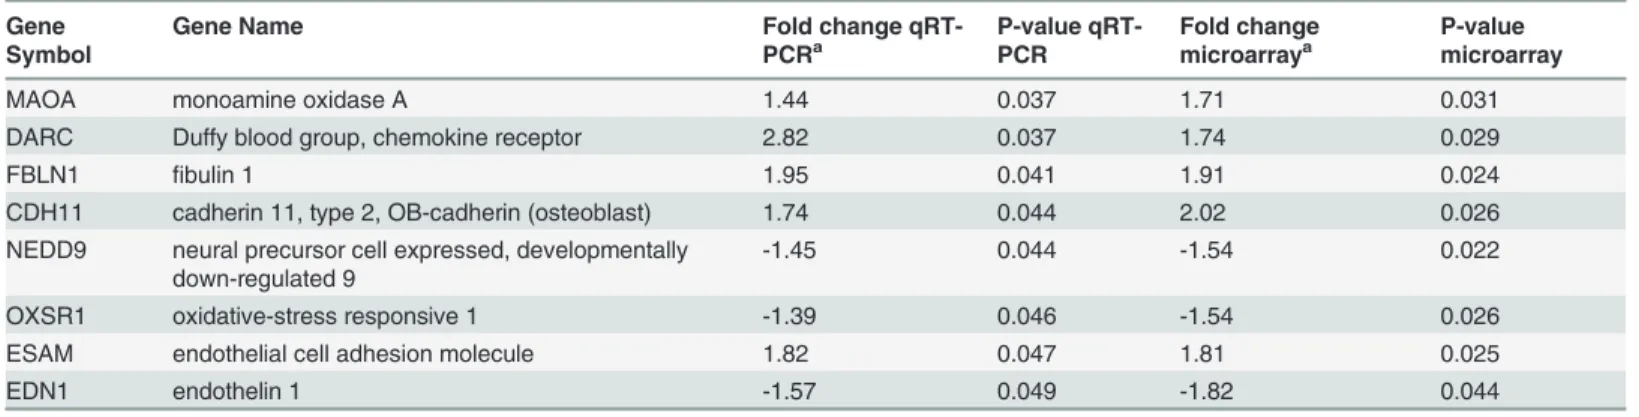
Table 7. (Continued)Gene Symbol
Gene Name Fold change
qRT-PCRa
P-value qRT-PCR
Fold change microarraya
P-value microarray
MAOA monoamine oxidase A 1.44 0.037 1.71 0.031
DARC Duffy blood group, chemokine receptor 2.82 0.037 1.74 0.029
FBLN1 fibulin 1 1.95 0.041 1.91 0.024
CDH11 cadherin 11, type 2, OB-cadherin (osteoblast) 1.74 0.044 2.02 0.026
NEDD9 neural precursor cell expressed, developmentally down-regulated 9
-1.45 0.044 -1.54 0.022
OXSR1 oxidative-stress responsive 1 -1.39 0.046 -1.54 0.026
ESAM endothelial cell adhesion molecule 1.82 0.047 1.81 0.025
EDN1 endothelin 1 -1.57 0.049 -1.82 0.044
a
Fold change- the number of times the average expression level in the chorioamniotic membranes of the neurocognitive impairment group differs from the average expression level in the normal comparison group; positive values (no sign) denote increased expression (up-regulation) in the neurocognitive impairment group, and negative values (minus sign) indicate decreased expression (down-regulation) in the neurocognitive impairment group.
was associated with decreased oxygen consumption via down-regulation of lipid metabolism
and uptake in fetal and adult cardiomyocytes [
84
]. Thus, Hand1 appears to mediate
mitochon-drial energy generation and the fetal to neonatal switch from glycolytic to oxidative metabolism
[
84
]. Decreased Hand1 expression is associated with up-regulation of genes encoding proteins
involved in lipid uptake and mitochondrial
β
-oxidation. Whether Hand1 plays a similar role in
the central nervous system (CNS) remains to be elucidated. In the CNS, Hand1 is expressed in
Fig 3. Gene expression-based classifier for neurocognitive impairment using OSR1/VWF and HAND1/VWF expression ratios.The Fig. shows the linear discriminant model (see oblique black line) built using qRT-PCR measured expression data from the training set. Since−Ct values are surrogate for log2 gene abundance, differences in−Ct values of two genes is equivalent to their log2expression ratios. Data are represented as log2 expression ratios (y-axis:−CtHAND1+CtVWF; x-axis:−CtOSR1+CtVWF). The dots represent data from patients from the test set. The model was tuned on the training data to yield a specificity of*85%. The actual performance on the test set was sensitivity of 74%, at specificity of 83%.sympathetic neurons [
80
] and regulates neuronal sympathetic survival and differentiation
along with Hand2 and homeodomain transcription factor Phox2b [
81
].
Apolipoprotein E (APOE) upregulated in cases
We identified several other genes involved in neuronal differentiation, lipid uptake and CNS
signaling. The Apolipoprotein E gene (
APOE
) encodes a multifunctional glycoprotein that
Fig 4. Performance of gene expression-based classifier on test set compared with a model using clinical covariates.When compared with clinical covariates available at the time of birth, the molecular prediction model had superior Area under the Receiver Operating Characteristic curve (AUC 0.77 vs 0.57, p = 0.049). Clinical covariates included the following: gestational age, gender, small for gestational age status, 5-minute Apgar score, labor and chorioamnionitis. The p-value for the difference between the two ROC curves was obtained using a bootstrap based method implemented in the pROC package in R (http://www.-r-project.org).transports lipids and cholesterol in the plasma and CNS by binding to low-density lipoprotein
receptors [
85
]. APOE/lipoprotein particles are produced by astrocytes [
86
] and to some extent
microglia [
87
]. With brain injury, APOE expression is up-regulated. APOE interacts with
cyto-kines and alters macrophage function, suppresses T cell proliferation, up-regulates platelet
ni-tric oxide production and increases lipid antigen presentation by CD1 molecules; it also
maintains the integrity of the blood brain and blood nerve barriers [
88
]. In the brain, APOE
binds to the very low-density lipoprotein receptor (VLDLR) and APOE receptor 2 (APOER2),
the two main reelin signaling receptors. APOE can significantly inhibit reelin binding and
sub-sequent phosphorylation of the adapter molecule disabled 1 protein (dab1) which initiates the
intracellular transduction of reelin signaling [
89
]. Mutations in the
RELN
and
DAB1
genes that
disrupt reelin signaling are associated with cerebellar hypoplasia and severe abnormalities in
neuronal organization and migration [
90
–
92
]; mutations in either VLDLR or APOER2 in
iso-lation result in more subtle defects in cell positioning, synapse and dendritic spine formation
[
93
]. APOE genotype/expression has been linked to human neurocognitive and
neuroinflam-matory disorders (e.g., Alzheimer
’
s disease [
94
], Parkinson
’
s disease [
95
–
97
] multiple sclerosis
[
98
] and HIV disease progression [
99
]). Preliminary evidence also suggests an association
be-tween APOE gene expression and altered brain structure at birth (alterations in regional
corti-cal brain volumes) [
100
].
Selenoprotein P, plasma 1 (SEPP1) upregulated in cases
The selenoprotein P, Plasma 1 (
Sepp1
) gene encodes a selenium rich extracellular protein
in-volved in selenium transport and antioxidant defense mechanisms in the brain [
101
]. In the
setting of brain injury, Sepp1 is up-regulated and secreted by astrocytes [
102
]; it is then taken
up by neurons via the APOER2 which also binds reelin [
103
–
105
]. Interruption of the reelin
signaling pathway may have devastating effects on brain development as previously noted.
In-creased Sepp1 expression is reported in neuroinflammatory disorders associated with impaired
cognition. Bellinger
et al
reported increased expression in post-mortem Parkinson
’
s disease
brain tissues (in Lewy bodies and the substantia nigra, relative to neuron count) [
106
] and in
Alzheimer
’
s disease (in amyloid beta plaques and neurofibrillary tangles) [
107
].
Disabled homolog 2, mitogen responsive phosphoprotein (DAB2)
upregulated in cases
The disabled homolog 2, mitogen responsive phosphoprotein (Drosophila) gene (
Dab2
)
en-codes disabled protein 2. Murine disabled-2 (initially termed p96) was isolated as a 96 kD
phosphoprotein involved in macrophage signaling via colony stimulating factor-1 [
108
].
Se-quence homology suggested that p96 was an ortholog of the Drosophila disabled gene[
109
]
and this was the origin for the names of neuronally expressed Dab1 and the more broadly
ex-pressed Dab2. Recently, Dab2 expression was shown to be up-regulated by macrophages and
astrocytes in various CNS injury models (e.g., cryoinjury [
110
] and autoimmune
encephalomy-elitis [
111
]). In humans, Dab2 was up-regulated in a microarray study of autopsy specimens in
multiple sclerosis lesions.
Other genes involved in vascular endothelial function and response to
injury: von Willebrand factor (VWF), Cluster of Differentiation 163
(CD-163) and C-X-C motif chemokine 12 (CXCL-12) upregulated in cases
compared with controls
VWF
gene is upregulated in cases. The von Willebrand factor gene encodes a large plasma
gly-coprotein that is synthesized by vascular endothelial cells and megakaryocytes in response to
endothelial injury. It plays a central role in platelet adhesion, activation and thrombin
genera-tion [
118
]. Compared with older individuals, preterm infants and fetuses have higher
concen-trations and larger multimers of VWF [
118
–
120
]. By combining the signal from this
up-regulated gene with that of the OSR1 and HAND1 genes that are down-up-regulated in disease,
we obtain two dimensionless variables (OSR1/VWF and HAND1/VWF) that 1) differ to a
greater extent between cases and controls, 2) are platform-independent and 3) lead to a gene
classifier that is more cost-effective as compared to one that uses a standard gene normalizer
(e.g., GAPDH) with no discriminatory power.
CD 163
gene is upregulated in cases. The protein encoded by the CD163 gene is a member
of the scavenger receptor cysteine-rich (SRCR) superfamily that is expressed by monocytes/
macrophages. In the CNS, CD163 is localized to perivascular macrophages and microglia. It is
thought to function as an innate immune sensor for bacteria altering local immune
responsive-ness and an acute phase-regulated receptor involved in the clearance and endocytosis of
hemo-globin/haptoglobin complexes protecting tissues from free hemoglobin-mediated oxidative
damage [
121
]. CD163 expression is regulated by both proinflammatory and anti-inflammatory
mediators (suppressed by lipopolysaccharide, interferon-gamma and tumor necrosis factor
alpha and strongly up-regulated by IL-6 and IL-10)[
122
]. Increased CD163 expression has
been linked to neuroinflammatory disease states such as multiple sclerosis[
123
], Alzheimer
’
s
disease[
124
]) HIV-associated neurocognitive disorders[
125
] and schizophrenia[
126
].
CXCL12
gene is upregulated in cases. The C-X-C motif chemokine 12 gene also known as
stromal cell-derived factor 1 alpha (SDF-1
α
) encodes a chemokine protein that binds to
che-mokine receptor 4 and 7 (G-protein coupled receptors). CXCL12 is induced by
proinflamma-tory stimuli (e.g., lipopolysaccharide, IL1
β
, TNF
α
) and has many diverse functions. In the
brain, CXCL12 is produced by both neurons and glial cells and is involved in neurogenesis,
ax-onal guidance, neurite outgrowth, modulation of neurax-onal excitability, neurotransmitter
re-lease (particularly GABA rere-lease), and neurotransmitter systems cross-talk (e.g., GABA,
glutamate, opioids)[
127
,
128
].
CXCL12 also is involved in immune functions (immune surveillance, response to
inflamma-tion, leukocyte activation) and vasculogenesis.
Strengths and limitations
Conclusion
Impaired brain function in preterm neonates is thought to arise from (1) inflammation and/or
hypoxic-ischemic injury to developing preoligodendrocytes and cortical neurons, (2)
second-ary atrophy after sublethal axonal injury and (3) an arrest or alteration of the developmental
trajectory postnatally [
129
,
130
]. We propose that this alteration in the developmental
trajecto-ry also arises
prenatally
from stimuli that alter cellular metabolism, neuronal differentiation,
signaling, vascular permeability and response to injury. Together, the genes and biological
pathways that we have identified provide important preliminary data for the mechanistic
pro-cesses that may mediate brain injury and aberrant neuronal development in utero. Prospective
cohort studies are needed to determine whether this information can be used to identify
new-borns that will develop neurocognitive impairment in early childhood and might benefit from
early intervention or neuro-protective strategies.
Supporting Information
S1 Table. Primers used in qRT-PCR assays with the Biomark system.
(DOCX)
Acknowledgments
We are indebted to our medical and nursing colleagues at the Perinatology Research Branch
and the Detroit Medical Center and the mothers and families who agreed to take part in
this study.
Author Contributions
Conceived and designed the experiments: AP TC RR AT. Performed the experiments: AP TC
RR JC NG. Analyzed the data: AP SK GB AT. Contributed reagents/materials/analysis tools:
RR AT. Wrote the paper: AP TC RR SK JC NG SH SS AT.
References
1. Hack M, Taylor HG, Drotar D, Schluchter M, Cartar L, Wilson-Costello D, et al. Poor predictive validity of the Bayley Scales of Infant Development for cognitive function of extremely low birth weight children at school age. Pediatrics. 2005; 116(2):333–41. doi:10.1542/peds.2005-0173PubMed PMID: PMID:
16061586.
2. Hintz SR, Kendrick DE, Wilson-Costello DE, Das A, Bell EF, Vohr BR, et al. Early-childhood neurode-velopmental outcomes are not improving for infants born at<25 weeks' gestational age. Pediatrics. 2011; 127(1):62–70. Epub 2010/12/29. doi:10.1542/peds.2010-1150PubMed PMID: PMID:
21187312.
3. Stoll BJ, Hansen NI, Bell EF, Shankaran S, Laptook AR, Walsh MC, et al. Neonatal outcomes of ex-tremely preterm infants from the NICHD Neonatal Research Network. Pediatrics. 2010; 126(3):443–
56. Epub 2010/08/25. doi:10.1542/peds.2009-2959PubMed PMID: PMID:20732945; PubMed Cen-tral PMCID: PMC2982806.
4. Vohr BR, Wright LL, Poole WK, McDonald SA. Neurodevelopmental outcomes of extremely low birth weight infants<32 weeks' gestation between 1993 and 1998. Pediatrics. 2005; 116(3):635–43. doi:
10.1542/peds.2004-2247PubMed PMID: PMID:16143580.
5. Vohr BR, Stephens BE, Higgins RD, Bann CM, Hintz SR, Das A, et al. Are outcomes of extremely pre-term infants improving? Impact of Bayley assessment on outcomes. The Journal of pediatrics. 2012; 161(2):222–8 e3. Epub 2012/03/17. doi:10.1016/j.jpeds.2012.01.057PubMed PMID: PMID:
22421261.
6. Saigal S, Doyle LW. An overview of mortality and sequelae of preterm birth from infancy to adulthood. Lancet. 2008; 371(9608):261–9. doi:10.1016/S0140-6736(08)60136-1PubMed PMID: PMID:
7. Hutchinson EA, De Luca CR, Doyle LW, Roberts G, Anderson PJ, Victorian Infant Collaborative Study G. School-age outcomes of extremely preterm or extremely low birth weight children. Pediat-rics. 2013; 131(4):e1053–61. doi:10.1542/peds.2012-2311PubMed PMID: PMID:23509167.
8. Centers for Disease C, Prevention. Economic costs associated with mental retardation, cerebral palsy, hearing loss, and vision impairment—United States, 2003. MMWR Morb Mortal Wkly Rep. 2004; 53(3):57–9. PubMed PMID: PMID:14749614.
9. Liggins GC, Howie RN. A controlled trial of antepartum glucocorticoid treatment for prevention of the respiratory distress syndrome in premature infants. Pediatrics. 1972; 50(4):515–25. PubMed PMID: PMID:4561295.
10. Roberts D, Dalziel S. Antenatal corticosteroids for accelerating fetal lung maturation for women at risk of preterm birth. Cochrane Database Syst Rev. 2006;(3: ):CD004454. doi:10.1002/14651858. CD004454pub2. PubMed PMID: PMID:16856047.
11. Crowther CA, Harding JE. Repeat doses of prenatal corticosteroids for women at risk of preterm birth for preventing neonatal respiratory disease. Cochrane Database Syst Rev. 2007;(3: ):CD003935. doi:
10.1002/14651858.CD003935pub2. PubMed PMID: PMID:17636741.
12. Brownfoot FC, Crowther CA, Middleton P. Different corticosteroids and regimens for accelerating fetal lung maturation for women at risk of preterm birth. Cochrane Database Syst Rev. 2008;(4: ):
CD006764. doi:10.1002/14651858.CD006764pub2. PubMed PMID: PMID:18843729.
13. Carlo WA, McDonald SA, Fanaroff AA, Vohr BR, Stoll BJ, Ehrenkranz RA, et al. Association of ante-natal corticosteroids with mortality and neurodevelopmental outcomes among infants born at 22 to 25 weeks' gestation. JAMA: the journal of the American Medical Association. 2011; 306(21):2348–58. Epub 2011/12/08. doi:10.1001/jama.2011.1752PubMed PMID: PMID:22147379.
14. Nelson KB, Grether JK. Can magnesium sulfate reduce the risk of cerebral palsy in very low birth-weight infants? Pediatrics. 1995; 95(2):263–9. PubMed PMID: PMID:7838646.
15. Crowther CA, Hiller JE, Doyle LW, Haslam RR, Australasian Collaborative Trial of Magnesium Sul-phate Collaborative G. Effect of magnesium sulfate given for neuroprotection before preterm birth: a randomized controlled trial. JAMA: the journal of the American Medical Association. 2003; 290 (20):2669–76. doi:10.1001/jama.290.20.2669PubMed PMID: PMID:14645308.
16. Marret S, Marpeau L, Benichou J. Benefit of magnesium sulfate given before very preterm birth to pro-tect infant brain. Pediatrics. 2008; 121(1):225–6. doi:10.1542/peds.2007–2971PubMed PMID: PMID:18166581.
17. Rouse DJ, Hirtz DG, Thom E, Varner MW, Spong CY, Mercer BM, et al. A randomized, controlled trial of magnesium sulfate for the prevention of cerebral palsy. The New England journal of medicine. 2008; 359(9):895–905. doi:10.1056/NEJMoa0801187PubMed PMID: PMID:18753646; PubMed Central PMCID: PMC2803083.
18. Doyle LW, Crowther CA, Middleton P, Marret S, Rouse D. Magnesium sulphate for women at risk of preterm birth for neuroprotection of the fetus. Cochrane Database Syst Rev. 2009;(1: ):CD004661. doi:10.1002/14651858.CD004661pub3. PubMed PMID: PMID:19160238.
19. Ho NT, Furge K, Fu W, Busik J, Khoo SK, Lu Q, et al. Gene expression in archived newborn blood spots distinguishes infants who will later develop cerebral palsy from matched controls. Pediatric re-search. 2013; 73(4 Pt 1):450–6. doi:10.1038/pr.2012.200PubMed PMID: PMID:23269123.
20. Glatt SJ, Tsuang MT, Winn M, Chandler SD, Collins M, Lopez L, et al. Blood-based gene expression signatures of infants and toddlers with autism. Journal of the American Academy of Child and Adoles-cent Psychiatry. 2012; 51(9):934–44 e2. doi:10.1016/j.jaac.2012.07.007PubMed PMID: PMID:
22917206; PubMed Central PMCID: PMC3756503.
21. Bailo M, Soncini M, Vertua E, Signoroni PB, Sanzone S, Lombardi G, et al. Engraftment potential of human amnion and chorion cells derived from term placenta. Transplantation. 2004; 78(10):1439–48. PubMed PMID: PMID:15599307.
22. Ilancheran S, Michalska A, Peh G, Wallace EM, Pera M, Manuelpillai U. Stem cells derived from human fetal membranes display multilineage differentiation potential. Biology of reproduction. 2007; 77(3):577–88. doi:10.1095/biolreprod.106.055244PubMed PMID: PMID:17494917.
23. Yawno T, Schuilwerve J, Moss TJ, Vosdoganes P, Westover AJ, Afandi E, et al. Human amnion epi-thelial cells reduce fetal brain injury in response to intrauterine inflammation. Developmental neurosci-ence. 2013; 35(2–3):272–82. doi:10.1159/000346683PubMed PMID: PMID:23571644.
24. Verlinsky Y, Strelchenko N, Kukharenko V, Rechitsky S, Verlinsky O, Galat V, et al. Human embryonic stem cell lines with genetic disorders. Reproductive biomedicine online. 2005; 10(1):105–10. PubMed PMID: PMID:15705304.