Correspondence to: Marko Banovi , Department of Cardiology, University Clinical Centre of Serbia, 8 Koste Todorovi a,
O R I G I N A L A R T I C L E UDC: 616.126.32-036-08:616.12-07
DOI: 10.2298/VSP110630031B
Association between aortic stenosis severity and contractile reserve
measured by two-dimensional strain under low-dose dobutamine
testing
Uticaj težine aortne stenoze na procenu kontraktilne rezerve procenjene pomo u
dvodimenzionalnog naprezanja tokom niskodoznog dobutaminskog testa
Marko Banoviü*, Bosiljka Vujisiü-Tešiü*, Vuk Kujaþiü†, Slobodan Obradoviü‡§, Zdenko Crkvenac†, Miodrag Ostojiü*
*Department of Cardiology, University Clinical Centre of Serbia, Belgrade, Serbia;†Sahlgrenska University Hospital/Östra, Gothenburg, Sweden; ‡Clinic of Urgent
Internal Medicine, Military Medical Academy, Belgrade, Serbia; §Faculty of Medicine of the Military Medical Academy, University of Defence, Belgrade, Serbia
Abstract
Background/Aim. Early detection of left ventricle (LV) systolic dysfunction could be a clue for surgical treatment in patients with significant aortic stenosis (AS). Therefore, we evaluated LV peak of global longitudinal strain (PGLS) using speckle tracking imaging at rest and during low-dose dobutamine infusion in asymptomatic patients with mod-erate and severe AS and preserved LV ejection fraction (EF). Methods. All the patients underwent coronary angi-ography and had no obstructive coronary disease (defined as having no stenosis greater than 50% in diameter). The patients were divided into two groups: above and below median of 0.785 cm2 aortic valve area (AVA). PGLS was
measured from acquired apical 4-chamber and 2-chamber cine loops using a EchoPac PC-workstation at rest and during 5 μg/kg/min, 10 μg/kg/min, and 20 μg/kg/min dobutamine infusion, respectively. The global strain was the average of segment strains from the apical views. Re-sults: A total of 62 patients with moderate and severe AS (AVA < = 1.5 cm2), the mean age 66.12 ± 9.91, (57.14%
males), were enrolled in this prospective study. At rest, mean gradient was 43.57 ± 0.29 mmHg and mean EF was
72.24 ± 0.45%. When divided according to median AVA, both groups had decreased average PGLS at rest (-9.33 ± 4.46% vs -8.95 ± 3.08%; p = ns). During dobutamine both groups increased their average PGLS, but only the group with AVA > median reached the statistical significance (-8.71 ± 2.68% vs -11.93 ± 3.74%, p = 0.002). In addition, PGLS increase was also significant in 4-chamber view in the patients with AVA above median, but only when comparing baseline to peak 20 μg/kg/min (-10.72 ± 3.07% vs -13.14 ± 4.79%; p = 0.034). Conversely, in both groups the increase of PGLS in 2-chamber view did not reach significance. Conclusion. Two-dimensional strain speckle tracking analysis of myocardial deformation with measurement of peak systolic strain during dobutamine in-fusion is a feasible and accurate method to determine myocardial longitudinal systolic function and contractile reserve and may contribute to clinical decision making in patients with significant AS.
Key words:
ventricular function, left; myocardial contraction; aortic value stenosis; dobutamine; heart function tests; ultrasonography.
Apstrakt
Uvod/Cilj. Rano otkrivanje sistolne disfunkcije leve ko-more kod bolesnika sa znatnom aortnom stenozom (AS) je važno, jer nam može na vreme ukazati na potrebu da se bolesnik uputi na hirurško le enje. Iz tog razloga, koriste i dvodimenzionalnu speckle tracking tehniku, ispitali smo ko-lika je vrednost maksimalnog globalnog longitudinalnog naprezanja (maximal global longitudinal strain – MGLS) u mi-ru i kako se menja tokom niskodoznog dobutaminskog te-sta kod bolesnika sa umerenom i tesnom AS i o uvanom
ejekcionom frakcijom (EF) u miru. Metode. Svim boles-nicima je ura en koronarni angiogram i nijedan bolesnik nije imao suženje ve e od 50% pre nika epikardnog koro-narnog krvnog suda. Bolesnici su na osnovu medijane po-vršine aortnog uš a (PAŠ) koja je iznosila 0,785 cm2
šupljine. Rezultati. Ukupno 62 bolesnika sa umerenom i tesnom AS (PAŠ 1,5 cm2), prose ne starosti 66.12 ±
9.91 godine, (57.14% muškarci), bile su uklju ena u ovu prospektivnu studiju. U miru, srednji gradijent preko aort-nog uš a iznosio je 43.57 ± 0.29 mmHg, a srednja vred-nost EF bila je 72.24 ± 0.45%. Obe grupe bolesnika imale su sniženu prose nu vrednost MGLS u miru (-9.33 ± 4.46% vs -8.95 ± 3.08%, p = ns). Tokom dobutaminskog testa obe grupe bolesnika pove ale su prose nu vrednost MGLS, ali je samo u grupi bolesnika ija je PAŠ bila iznad medijane taj porast bio statisti ki zna ajan (-8,71 ± 2,68%
vs -11,93 ± 3,74%, p = 0,002). Tako e, u ovoj grupi boles-nika statisti ki zna ajan bio je i porast MGLS u apikalnom preseku etiri šupljine (-10,72 ± 3,07% vs -13,14 ± 4,79%,
p = 0,034). Sa druge strane, nijedna grupa bolesnika nije dostigla statisti ki zna ajan porast MGLS u apikalnom preseku dve šupljine. Zakljuÿak. Dvodimenzionalna spec-kle tracking analiza miokardne deformacije sa merenjem MGLS u miru i tokom niskodoznog dobutaminskog testa sigurna je, izvodljiva i precizna metoda za odre ivanje lon-gitudinalne sistolne funkcije leve komore u miru i njene kontraktilne rezerve i može doprineti boljem klini kom ra-su ivanju kod bolesnika sa hemodinamski zna ajnom AS.
Kljuÿne reÿi:
srce, funkcija leve komore; miokard, kontrakcija; zalistak aorte, stenoza; dobutamin; srce, funkcijski testovi; ultrasonografija.
Introduction
Speckles are natural acoustic markers due to interfer-ence patterns caused by backscattered signals from small structures in myocardium 1. Long axis systolic left ventricu-lar (LV) function is governed by the subendocardial myocar-dial fibres that can be reliably quantified by the measurement of longitudinal myocardial deformation using the two dimen-sional, 2D speckle tracking imaging 2. Dobutamine is a po-tent beta-agonist which increases heart rate and contractility of the heart, but, in low dose, the effect is more pronounced on increasing myocardial contractility than heart rate 3.
LV response to chronic pressure overload and increased wall stress in aortic stenosis (AS) is a concentric hypertrophy – an increase in mass due to increased wall thickness without chamber dilatation 4. This mechanism enables left ventricle ejectin fraction (LVEF) to remain preserved until late in the disease course. However, revealing the progression from com-pensatory hypertrophy to heart failure, in timely manner, may be important because once symptoms start to occur and LVEF to decrease, outcome becomes significantly worse 5. Thus, early detection of diminished or absent LV long-axis myocar-dial deformation, as a marker of LV systolic dysfunction in AS, could be helpful for better decision-making in these patients 6.
The aim of this study was to evaluate the impact of AS on LV longitudinal systolic function by using 2D-speckle tracking of myocardial deformation at rest and during low-dose dobutamine infusion, in asymptomatic patients with moderate and severe AS and preserved LVEF.
Methods
A cohort of 70 patients with AS (effective orifice area of 1.5 cm2 or less) and preserved EF at rest (EF > 50%), as calculated by Doppler and 2D echocardiography, used to be enrolled consecutively from May 2009 to September 2010 in the clinical echocardiography laboratory of the University Clinical Center, Belgrade, Serbia. All the patients underwent coronary angiography and had no obstructive coronary dis-ease (defined as having no stenosis greater than 50% in di-ameter). Due to insufficient image quality at rest and during dobutamine testing (DBT) (of the 2D-strain especially), 8
patients were excluded forming the final group of 62 pa-tients. According to the median aortic valve area (AVA) of 0.785 cm2 the patients were divided into two groups: below and above the median level. Exclusion criteria were atrio-ventricular block or bradycardia with heart rate (HR) below 50 beats per minute, other significant valvular disease and uncontrolled hypertension (> 180/100 mmHg). The Ethics Committee of the University Clinical Center approved the study, and all the patients gave written informed consent.
Echocardiography
Transthoracic echocardiography exam was performed with an General Electric, Vivid 4 cardiac ultrasound system (BTO6, 1.5–3.6 MHz; GE Healthcare Technologies, Waukesha, WI, USA). The subjects were studied in the left lateral decubitus. Left ventricular internal dimension, posterior wall thickness (PWT) and interventricular septum thickness (IVST) were measured at end-diastole, at a level immediately apical to the mitral valve leaflet tips, in two-dimensional para-sternal long-axis view 7. The LV mass was calculated using the corrected formula of the American Society of Echocardi-ography and was indexed for body surface area (BSA) 8. Rela-tive wall thickness (RWT) was calculated with the formula: RWT = (PWT + IVST)/LVEDD. Significant LV hypertrophy was defined as LV mass index > 134 g/m2 for men and > 110 g/m2 for women and as RWT > 0.5 9. AS was graded using the continuity equation10 calculated as moderate (AVA from 1.0 cm2 to 1.5 cm2) or severe (AVA 1.0 cm2 or less). The subaortic diameter was measured from inner edge to inner edge at the level of the base of the aortic cusps in a parasternal long axis frame frozen in mid-systole. Pulsed Doppler recordings were made in apical 5-chamber view with the sample volume moved axially from the aortic annulus, usually 0.5 cm to 1 cm below the valve, recording maximal velocity and velocity-time integral. Continuous wave recordings were made from the apex and right intercostal positions and the optimal signal was traced to obtain peak velocity, velocity-time integral, systolic ejection time and peak and mean pressure difference, using the on-line software.
re-spectively. Each level was lasting for 3 minutes. All standard echocardiographic measures were recorded during the last minute of each level and analysed off-line.
Strain measurement
Strain measurement was based on the speckle tracking approach: the global longitudinal myocardial deformation was evaluated from the standard 2D images. The image acquisition frame rate was 60–90 Hz (mean value 75 Hz). Peak strain was measured from acquired apical 4-chamber and 2-chamber cine loops using an EchoPac PC-workstation at rest and during 5 μg/kg/min, 10 μg/kg/min, and 20 μg/kg/min DBT. In brief, by tracing the endocardial borders on an end-systolic frame, the software automatically tracked the contour on the subsequent frames. Adequate tracking was verified in real-time and was manually corrected, if necessary. The peak global longitudinal deformation was the average of segment strains from apical 4-and 2- chamber view. The inter-observer reproducibility of measurements was tested by random selection of 10 patients. Inter-observer agreement was 90%.
Statistical analysis
The data were expressed as mean values and standard deviations or percentages, and analyzed with the paired sam-ples t-test. The median split method was used to divide pa-tients into two equal cohorts: the cohort of papa-tients below
median level representing patients with severe AS and the cohort of patients above median level, representing patients with moderate AS. A p value < 0.05 was considered to be statistically significant. Statistical analysis was performed using SPSS statistical software (SPSS for Windows, release 17.0, SPSS, Chicago, IL).
Results
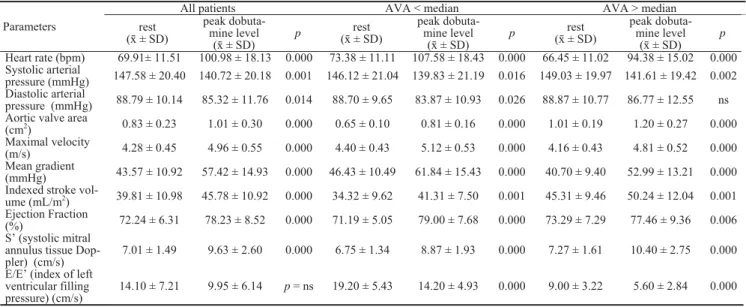
A total of 537 cine loops were analyzed in the cohort of 62 asymptomatic AS patients, mean age 66.12 ± 9.91 years; range from 33 to 83 years; 54.8% were males. Dobutamine infusion was generally well-tolerated, no adverse event was registered during or after the testing. Table 1 presents the echocardiographic data of our patient cohort. All the patients had normal end-systolic and end-diastolic LV measures, and, by definition, AVA was reduced and mean and peak gradi-ents increased. However, the signs of LV hypertrophy and diastolic dysfunction were present, with relatively high E/E’ relationship indicating increased LV end-diastolic pressure.
Heart rate was increasing under DBT (p< 0.05) parallel with dobutamine dose increase. All parameters describing the severity of AS and systolic LV function, and when ana-lyzing according to AVA median level, significantly changed in all patients (p< 0.05) during DBT (Table 2).
Table 1 Echocardiographic parameters describing diastolic function and left ventricle (LV) hypertrophy
in all the patients
Parameters ± SD
LV mass index (g/m2) 141.62 ± 33.52
Relative wall thickness 0.51 ± 0.08
Septum (cm) 1.31 ± 0.13
Posterior wall (cm) 1.24 ± 0.13
Isovolumetic relaxation time (ms) 94.00 ± 39.06
Deceleration time (ms) 243.88 ± 73.17
E/E’ (index of left ventricular filling pressure) (cm/s) 14.10 ± 7.21
LV end-diastolic volume (mL) 88.07 ± 22.35
LV end-systolic volume (mL) 25.04 ± 10.14
Table 2 Clinical and echocardiographic parameters at rest and during peak dobutamine infusion for all the patients and according to
aortic value area (AVA) median level
All patients AVA < median AVA > median
Parameters rest ( ± SD)
peak dobuta-mine level
( ± SD)
p ( ± SD)rest
peak dobuta-mine level
( ± SD)
p ( ± SD)rest
peak dobuta-mine level
( ± SD) p
Heart rate (bpm) 69.91± 11.51 100.98 ± 18.13 0.000 73.38 ± 11.11 107.58 ± 18.43 0.000 66.45 ± 11.02 94.38 ± 15.02 0.000 Systolic arterial
pressure (mmHg) 147.58 ± 20.40 140.72 ± 20.18 0.001 146.12 ± 21.04 139.83 ± 21.19 0.016 149.03 ± 19.97 141.61 ± 19.42 0.002 Diastolic arterial
pressure (mmHg) 88.79 ± 10.14 85.32 ± 11.76 0.014 88.70 ± 9.65 83.87 ± 10.93 0.026 88.87 ± 10.77 86.77 ± 12.55 ns Aortic valve area
(cm2) 0.83 ± 0.23 1.01 ± 0.30 0.000 0.65 ± 0.10 0.81 ± 0.16 0.000 1.01 ± 0.19 1.20 ± 0.27 0.000 Maximal velocity
(m/s) 4.28 ± 0.45 4.96 ± 0.55 0.000 4.40 ± 0.43 5.12 ± 0.53 0.000 4.16 ± 0.43 4.81 ± 0.52 0.000 Mean gradient
(mmHg) 43.57 ± 10.92 57.42 ± 14.93 0.000 46.43 ± 10.49 61.84 ± 15.43 0.000 40.70 ± 9.40 52.99 ± 13.21 0.000 Indexed stroke
vol-ume (mL/m2) 39.81 ± 10.98 45.78 ± 10.92 0.000 34.32 ± 9.62 41.31 ± 7.50 0.001 45.31 ± 9.46 50.24 ± 12.04 0.001 Ejection Fraction
(%) 72.24 ± 6.31 78.23 ± 8.52 0.000 71.19 ± 5.05 79.00 ± 7.68 0.000 73.29 ± 7.29 77.46 ± 9.36 0.006 S’ (systolic mitral
annulus tissue Dop-pler) (cm/s)
7.01 ± 1.49 9.63 ± 2.60 0.000 6.75 ± 1.34 8.87 ± 1.93 0.000 7.27 ± 1.61 10.40 ± 2.75 0.000
E/E’ (index of left ventricular filling pressure) (cm/s)
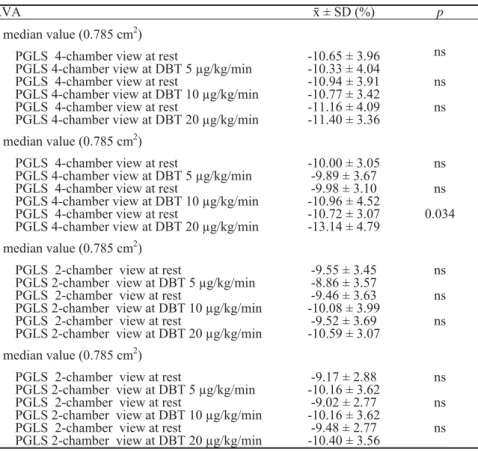
When divided according to median AVA, both groups of patients had a decreased average peak of global longitudi-nal strain (PGLS) at rest. No significant difference was found between them (p = ns), although patients with moderate AS had somewhat lower baseline values. However, during DBT both groups increased their average PGLS, but only the group with AVA > median level reached the statistical sig-nificance, during both 10 μg/kg/min and 20 μg/kg/min
infu-sion (p = 0.012 and p = 0.020), while the increase during 5 μg/kg/min infusion was very close to statistical significance (p = 0.053) (Figure 1). In addition, PGLS increase was also significant in 4-chamber view in the patients with AVA above median level, but only when comparing baseline to peak 20 μg/kg/min DBT. In contrast, the patients with AVA below the median did not reach a significant increase in PGLS during DBT (Table 3). Conversely, in both groups the
AVA < median value (0.785 cm2) AVA > median value (0.785 cm2) PGSrest - PGS5; p = ns p = 0.053 PGSrest - PGS10; p = ns p = 0.012 PGSrest - PGS20; p = ns p = 0.020
Fig. 1 – Peak average global longitudinal strain (PGS) at rest and during dobutamine infusion according to median aortic value area (AVA) level.
Table 3 Peak global longitudinal strain (PGLS) at rest and during dobutamine infusion from apical 4- and 2- chamber view
according to median aortic value area (AVA) level
AVA ± SD (%) p
< median value (0.785 cm2)
PGLS 4-chamber view at rest
PGLS 4-chamber view at DBT 5 μg/kg/min -10.65 ± 3.96-10.33 ± 4.04
ns
PGLS 4-chamber view at rest
PGLS 4-chamber view at DBT 10 μg/kg/min
-10.94 ± 3.91 -10.77 ± 3.42
ns
PGLS 4-chamber view at rest
PGLS 4-chamber view at DBT 20 μg/kg/min -11.16 ± 4.09-11.40 ± 3.36 ns
> median value (0.785 cm2)
PGLS 4-chamber view at rest
PGLS 4-chamber view at DBT 5 μg/kg/min
-10.00 ± 3.05 -9.89 ± 3.67
ns
PGLS 4-chamber view at rest
PGLS 4-chamber view at DBT 10 μg/kg/min
-9.98 ± 3.10 -10.96 ± 4.52
ns
PGLS 4-chamber view at rest
PGLS 4-chamber view at DBT 20 μg/kg/min -10.72 ± 3.07-13.14 ± 4.79 0.034
< median value (0.785 cm2)
PGLS 2-chamber view at rest
PGLS 2-chamber view at DBT 5 μg/kg/min
-9.55 ± 3.45 -8.86 ± 3.57
ns
PGLS 2-chamber view at rest
PGLS 2-chamber view at DBT 10 μg/kg/min
-9.46 ± 3.63 -10.08 ± 3.99
ns
PGLS 2-chamber view at rest
PGLS 2-chamber view at DBT 20 μg/kg/min
-9.52 ± 3.69 -10.59 ± 3.07
ns
> median value (0.785 cm2)
PGLS 2-chamber view at rest
PGLS 2-chamber view at DBT 5 μg/kg/min
-9.17 ± 2.88 -10.16 ± 3.62
ns
PGLS 2-chamber view at rest
PGLS 2-chamber view at DBT 10 μg/kg/min -10.16 ± 3.62-9.02 ± 2.77 ns PGLS 2-chamber view at rest
PGLS 2-chamber view at DBT 20 μg/kg/min
-9.48 ± 2.77 -10.40 ± 3.56
increase of PGLS in 2-chamber view did not reach signifi-cance. When analyzing mean LVEF at rest, we found, in contrast, that both groups have normal LVEF at rest (71.19 ± 5.05% vs 73.29 ± 7.29%, p = ns), and significant increase during DBT (71.19 ± 5.05% vs 79.00 ± 7.68%, p < 0.01, for AVA < median value and 73.29 ± 7.29 cm2vs 77.46 ± 9.36 cm2, p < 0.01, for AVA > median level).
Discussion
The present study showed that 2D-speckle tracking analysis of myocardial deformation with measurement of PGLS during dobutamine infusion is a feasible and accurate method to determine myocardial systolic function and con-tractile reserve and may contribute to decision making in pa-tients with moderate or severe AS. When compared to nor-mal subjects, extensively investigated in the HUNT11 study (in which authors reported normal PGLS around 16%), pa-tients with AS have reduced longitudinal systolic function in spite of preserved LVEF at rest. This finding was recently showed by Donal et al. 6 who used exercise testing for esti-mating contractile reserve, and was confirmed with DBT in our study. To the best of the author’s knowledge, this is the first study that used low-dose DBT for estimating longitudi-nal systolic function contractile reserve.
In hemodynamically significant AS, when chronically increased LV global afterload exceeds the limit of LV com-pensatory mechanism, intrinsic impairment of myocardial function can occur. However, despite the presence of myo-cardial dysfunction, often associated with disturbed myocar-dial architecture, LVEF is commonly normal in patients with AS. This might be due to the fact that LVEF is influenced not only by intrinsic myocardial function, but LV cavity ge-ometry, also 2, 12, 13. In AS, wall thickening as an adaptive mechanism to pressure overload, can thus mask subtle LV dysfunction 5. Subclinical LV dysfunction is classically de-tected by a decrease in longitudinal myocardial function which, as we confirmed, can be reliably quantified by the measurement of myocardial deformation using 2D-speckle tracking analysis 14, 15. Longitudinal function is governed by the subendocardial myocardial fibres which are aligned lon-gitudinally and more sensitive to microvascular ischae-mia 16, 17. This may lead to progressive myocardial fibrosis that participates to reduce longitudinal myocardial function. In asymptomatic AS patients reduced subendocardial func-tion has been showed to be associated with changes in symptomatic status during follow-up and adverce out-comes 14. However, when the reactive subendocardial fibro-sis becomes distinct, irreversible myocardial damage may
occur. Therefore, early detection of intrinsic myocardial dys-function in AS patients with preserved EF could be of help for risk assessment.
The present study showed that both patients with mod-erate and severe AS had impaired longitudinal myocardial function at rest. However, changes in longitudinal function during DBT were not homogenous, with the patients with AVA > 0.785 cm2 (thus considered as moderate stenosis) having more increase (becomes more negative) in PGLS. The present observation suggest that patients with moderate stenosis better adapt to acute change in LV load, by recruit-ing LV contractile reserve to the increased afterload. Both inotropic contractile reserve and rise in transaortic pressure gradients are thus concomitant. Conversely, when the aortic valve is no longer compliant, or in case of a significant myo-cardial damage (ie ischaemia), mismatch between afterload and contractility can occur, which is often the case in more advanced stage of a disease 6. Hence, limited longitudinal contractile reserve during DBT probably reflects a more ad-vanced disease process with more extensive myocardial fi-brosis, myocytes degeneration and exhausted coronary flow reserve.
Identification of subclinical LV dysfunction in hemo-dynamically significant AS is challenging and of clinical im-portance. The results of the present study show that the mag-nitude of DBT-induced changes in LVEF are not equal to changes in PGLS (as a measurement of LV long-axis func-tion) and that different categories of asymptomatic AS pa-tients can be identified according to changes in longitudinal function. In addition, PGLS, in contrast to LVEF, is de-creased even during maximal DBT. This emphasizes that in AS, the assessment of myocardial contractile function by 2D-speckle tracking is more appropriate than by changes in LVEF in the setting of pressure overload. Also, the role of mitral annulus pulse tissue Doppler in distinguishing patients with limited contractile reserve, according to Van Pelt et al. 18, is less accurate.
Conclusion
2D-speckle tracking analysis of PGLS during DBT is a feasible and accurate method to determine subnormal myo-cardial systolic function and contractile reserve and may contribute to decision making in asymptomatic moderate and severe AS patients with preserved LVEF. However, a de-crease in LV longitudinal systolic function in a significant AS cannot simply be related to the severity of valve obstruc-tion and needs to be evaluated in comparison with control groups.
R E F E R E N C E S
1. Geyer H, Caracciolo G, Abe H, Wilansky S, Carerj S, Gentile F, et al. Assessment of myocacardial mechanics using speckle tracking echocardiography: fundamentals and clinical applica-tions. J Am Soc Echocardiogr 2010; 23(4): 351 69.
2. Donal E, Bergerot C, Thibault H, Ernande L, Loufoua J, Augeul L, et al. Influence of afterload on left ventricular
radial and longitudinal systolic function: a two-dimensional strain imaging study. Eur J Echocardiogr 2009; 10(8): 914 21.
pre-dicting outcome as a function of management strategy. Chest 2001; 119(6): 1766 77.
4. Faggiano P, Rusconi C, Ghizzoni G. Left ventricular remodeling in valvular aortic stenosis. Echocardiographic and clinical changes in two patients during follow up. Chest 1994; 105(4): 1273 5.
5. Serri K, Reant P, Lafitte M, Berhouet M, Le Bouffos V, Roudaut R, et al. Global and regional myocardial function quantification by two-dimensional strain: Application in hypertrophic car-diomyopathy. J Am Coll Cardiol 2006; 47(6): 1175 81. 6. Donal E, Thebault C, O’Connor K, Veillard D, Rosca M, Pierard L,
et al. Impact of aortic stenosis on longitudinal myocardial de-formation during exercise. Eur J Echocardiogr 2011; 12(3): 235 41.
7. Lang RM, Bierig M, Devereux RB, Flachskampf FA, Foster E, Pe-likka PA, et al. Recommendations for chamber quantification. Eur J Echocardiogr 2006; 7(2): 79 108.
8. Sahn DJ, DeMaria A, Kisslo J, Weyman A. The committee on M-Mode Standardization of the American Society of Echocardi-ography: Recommendations regarding quantificationin M-mode echocardiography: Results of a survey of echocardio-graphic measurements. Circulation 1978; 58(6): 1072 83. 9. Hammond IW, Devereux RB, Alderman MH, Lutas EM, Spitzer
MC, Crowley JS, et al. The prevalence and correlates of echo-cardiographic left ventricular hypertrophy among patients with uncomplicated hypertension. J Am Coll Cardiol 1986; 7(3): 639 50.
10.Baumgartner H, Hung J, Bermejo J, Chambers JB, Evangelista A, Griffin BP, et al. Echocardiographic assessment of valve steno-sis: EAE/ASE recommendations for clinical practice. Eur J Echocardiogr 2009; 10(1): 1 25.
11.Dalen H, Thorstensen A, Aase A, Ingul CB, Torp H, Vatten LJ, et al. Segmental and global longitudinal strain and strain rate
based on echocardiography of 1266 healthy individuals: the HUNT study in Norway. Eur J Echocardiogr 2010; 11(2): 176 83.
12.Buermans HP, Paulus WJ. Iconoclasts topple adaptive myocar-dial hypertrophy in aortic stenosis. Eur Heart J 2005; 26(17): 1697 9.
13.Carabello B. Evolution of the study of left ventricular function: everything old is new again. Circulation 2002; 105(23): 2701 3.
14.Lafitte S, Perlant M, Reant P, Serri K, Douard H, DeMaria A, et al. Impact of impaired myocardial deformations on exercise toler-ance and prognosis in patients with asymptomatic aortic ste-nosis. Eur J Echocardiogr 2009; 10(3): 414 9.
15.Vinereanu D, Lim PO, Frenneaux MP, Fraser AG. Reduced myocardial velocities of left ventricular long-axis contraction identify both systolic and diastolic heart failure-a comparison with brain natriuretic peptide. Eur J Heart Fail 2005; 7(4): 512 9.
16.Garcia D, Camici PG, Durand LG, Rajappan K, Gaillard E, Ri-moldi OE, et al. Impairment of coronary flow reserve in aortic stenosis. J Appl Physiol 2009; 106(1): 113 21.
17.Delgado V, Tops LF, van Brommel RJ, van der Kley F, Marsan NA, Klautz RJ, et al. Strain analysis in patients with severe aortic stenosis and preserved left ventricular ejection fraction under-going surgical valve replacement. Eur Heart J 2009; 30(24): 3037 47.
18.Van Pelt NC, Stewart RA, Legget ME, Whalley GA, Wong SP, Zeng I, et al. Longitudinal left ventricular contractile dysfunc-tion after exercise in aortic stenosis. Heart 2007; 93(6): 732 8.