Cross-cultural analysis of the motor development of Brazilian, Greek
and Canadian infants assessed with the Alberta Infant Motor Scale
Análise transcultural do desenvolvimento motor de crianças brasileiras, gregas e canadenses avaliadas com a Alberta Infant Motor ScaleAnálisis transcultural del desarrollo motor de niños brasileños, griegos y canadienses evaluados con la Alberta Infant Motor Scale
Raquel Saccani1, Nadia Cristina Valentini2
Instituição: Universidade Federal do Rio Grande do Sul (UFRGS), Porto Alegre, RS, Brasil
1Doutoranda em Ciências do Movimento Humano da UFRGS; Docente da
Universidade de Caxias do Sul (UCS), Caxias do Sul, RS, Brasil
2PhD em Health and Human Performance da Auburn University; Docente
da UFRGS, Porto Alegre, RS, Brasil ABSTRACT
Objective: To compare the motor development of infants from three population samples (Brazil, Canada and Greece), to investigate differences in the percentile curves of motor de-velopment in these samples, and to investigate the prevalence of motor delays in Brazilian children.
Methods: Observational, descriptive and cross-sectional study with 795 Brazilian infants from zero to 18 months of age, assessed by the Alberta Infant Motor Scale (AIMS) at day care centers, nurseries, basic health units and at home. The Brazilian infants’ motor scores were compared to the results of two population samples from Greece (424 infants) and Canada (2,400 infants). Descriptive statistics was used, with one-sample
t-test and binomial tests, being significant p≤0.05.
Results: 65.4% of Brazilian children showed typical motor development, although with lower mean scores. In the begin-ning of the second year of life, the differences in the motor development among Brazilian, Canadian and Greek infants were milder; at 15 months of age, the motor development became similar in the three groups. A non-linear motor de-velopment trend was observed.
Conclusions: The lowest motor percentiles of the Brazil-ian sample emphasized the need for national norms in order to correctly categorize the infant motor development. The different ways of motor development may be a consequence of cultural differences in infant care.
Key-words: child development; performance tests; motor skills.
RESUMO
Objetivo: Comparar o desempenho motor de crianças de três amostras populacionais (Brasil, Canadá e Grécia), verifi-car as diferenças nas curvas de percentis do desenvolvimento motor para essas amostras e investigar a prevalência de atrasos motores em crianças brasileiras.
Métodos: Estudo observacional, descritivo e transver-sal, do qual participaram 795 crianças brasileiras com
idade entre zero e 18 meses, avaliadas com a Alberta Infant
Motor Scale (AIMS) nas escolas infantis, maternidades, unidades de saúde pública e em domicílio. Os escores motores de crianças brasileiras foram comparados aos resultados de pesquisas com os grupos populacionais da Grécia (424 crianças) e do Canadá (2.400 crianças).
Utilizou-se estatística descritiva, com os testes one-sample
t-test e binomial, sendo significante p≤0,05.
Resultados: Observou-se que 65,4% das crianças brasi-leiras apresentaram desempenho motor normal, embora com escores médios mais baixos que os outros grupos. No início do segundo ano de vida, as diferenças de desempenho entre as crianças brasileiras, canadenses e gregas diminuíram e, aos 15 meses, o desempenho motor tornou-se semelhante. Verificou-se tendência de aquisições motoras não lineares.
Endereço para correspondência: Raquel Saccani
Avenida Loureiro da Silva, 1.788, apto 209 – Cidade Baixa CEP 90050-240 – Porto Alegre/RS
E-mail: [email protected]
Fonte financiadora: Conselho Nacional de Desenvolvimento Científico e Tecnológico (CNPq)
Conclusões: Os percentis mais baixos da amostra brasileira reforçam a necessidade de se usarem normas nacionais para categorizar adequadamente o desempenho motor. As diferen-tes trajetórias do desenvolvimento motor são possivelmente decorrentes de diferenças culturais no cuidado das crianças.
Palavras-chave: desenvolvimento infantil; provas de rendimento; destreza motora.
RESUMEN
Objetivo: Comparar el desarrollo motor de niños de tres muestras poblacionales (Brasil, Canadá y Grecia), verificar las diferencias en las curvas de percentiles del desarrollo motor para esas muestras e investigar la prevalencia de retardos motores en niños brasileños.
Métodos: Estudio observacional, descriptivo y transversal, del que participaron 795 niños brasileños con edad entre 0 y
18 meses, evaluados con la Alberta Infant Motor Scale (AIMS)
en las escuelas infantiles, maternidades, unidades de salud pública y en domicilio. Los escores motores de niños brasi-leños fueron comparados a los resultados de investigaciones con los grupos poblacionales de Grecia (424 niños) y de Canadá (2.400 niños). Se utilizó la estadística descriptiva,
con las pruebas one-sample t-test y binominal, siendo
signi-ficante p≤0,05.
Resultados: Se observó que el 65,4% de los niños bra-sileños presentaron desempeño motor normal, aunque con escores medianos más bajos que los otros grupos. En el inicio del segundo año de vida, las diferencias de desempeño entre los niños brasileños, canadienses y griegos se redujeron y, a los 15 meses, el desempeño motor se hizo semejante. Se verificó tendencia de adquisiciones motoras no lineales.
Conclusiones: Los percentiles más bajos de la muestra brasileña reforzaron la necesidad de usarse normas nacionales para categorizar adecuadamente el desempeño motor. Los distintos recorridos del desarrollo motor son posiblemente decurrentes de diferencias culturales en el cuidado del niño.
Palabras clave: desarrollo infantil; pruebas de rendimiento; destreza motora
Introduction
In early childhood, the acquisition of postural skills is ex-tremely variable from child to child, since different biological and environmental factors may inluence development over
time(1). This variability has been a challenge for
profession-als who direct their studies to assess motor development, especially considering clinical, diagnosis, intervention, and monitoring studies on children(2-4). Motor evaluations are
usu-ally performed with different purposes, including detection and discrimination of delays, implementation of prevention policies for children exposed to risks, and monitoring the
achievement of milestones and new skills over time(5).
During the irst year of life, when the child has great potential for preventing or minimizing the installation of disorders, an evaluation is essential(6). The diagnosis of
ab-normalities enables the organization of appropriate interven-tions for each child in his or her context, such as the family home(7), nurseries(8), or Basic Health Units(9). Therefore,
proper diagnosis allows the inclusion of children in compen-satory programs, which aim to minimize the consequences
of short-, mid- and long-term motor disorders(8).
Different tools are used for motor assessment of children
in early childhood(5), among which the Alberta Infant Motor
Scale (AIMS) stands out, a Canadian observational assessment scale, whose main aim is to measure gross motor maturation, assessing the sequence of motor development and control
of antigravity muscles in different postures(10). Due to the
easy applicability and metric characteristics, the AIMS has
become an important tool for research support(5), clinical
practice(11-13), and intervention(8,14).
The increasing use of AIMS, although considered gold standard to identify delays in the irst months of life(15), has
raised concerns for researchers from various countries. First, it is questionable whether the interference of cultural and economic factors could explain different motor trajectories in the development of children assessed with the AIMS(12,13,16-20).
Moreover, researchers question whether adaptations and new standards, in other cultures, are necessary for the instrument(12,16,17,19,20-22).
One way to answer these questions is by means of studies which, using the AIMS, seek to identify children at risk or with abnormalities already installed, in different cultures and with different socioeconomic levels(12,13,16-18,20,23). For
instance, the results of national surveys aligned to this goal demonstrate delays in postural development in Brazilian children(17-19,21).
the motor performance of children assessed with the AIMS in three large population samples; b) detect differences in performance curves of children from the three countries in the 5th, 10th, 25th, 50th, 75th, and 90th percentiles; c) investigate the prevalence of motor delays in the group of Brazilian children. Considering the results of national studies, the observation of lower performance in Brazilian children when compared to children from other countries with different economic and socio-cultural characteristics was established as a hypothesis, and the high prevalence of children with inappropriate motor development to age.
Method
This was a cross-sectional, descriptive, and compara-tive study, approved by the Research Ethics Committee of Universidade Federal do Rio Grande do Sul (UFRGS), under protocol n. 14.126. The study included 795 children from zero to 18 months old, from different municipalities in the south-ern region of Brazil (Porto Alegre, São Leopoldo, Erechim, Caxias do Sul and Antônio Prado), from 2009 to 2011.
Among the total number of participants, 407 were female and 388 male, 658 were term infants and 137, pre-term, from different socioeconomic classes. Family income ranged from R$ 300.00 to R$ 7,100.00, resulting in a mean of
R$ 1,401.00 (standard-deviation – SD±1,305.00) and
median of R$ 750.00 (25th percentile=650.00; 75th per-centile =1,775.00). Regarding the biological characteristics of the sample, the children presented the following means: a) weeks of gestation: 37.3±3.62; b) birth weight (in grams):
2,938±758; c) birth length (in centimeters): 47.8±3.9; and
d) head circumference at birth (in centimeters): 33.6±2.9.
Children were included consecutively, with the permis-sion of institutions (kindergartens, hospitals, and Basic Health Units) and the signature of consent by those respon-sible, according to inclusion criteria (aged zero to 18 months and non-participation in intervention programs). Children with congenital malformation, acute diseases, and musculo-skeletal disorders, such as fractures, peripheral nerve injury, musculoskeletal infection, among others, were excluded. In data collection, 37 children were excluded, and the three main causes were participating in interventional activities, acute diseases (pneumonia, bronchiolitis) and inability to complete the assessment by crying and clinical condition.
The sample calculation was carried out in the Program for Epidemiologists, version 4.0. For a conidence level of 95%, a response rate of 50% and an error rate of 4%, the
assessment of at least 600 children would be necessary. We sought to maintain a similar distribution of children in each age group, to enable comparison between population groups (Brazil, Canada and Greece) in each of the age groups.
As parameters for comparison, data from two studies on
regulation of AIMS in different population groups were
used: a sample of 2,400 Canadian children(24) born at term
and pre-term, from different regions and different
socio-economic status, and a sample of 424 Greek children(20),
born at term, aged between 7 days and 18 months, from all socioeconomic classes (children with a history of perinatal problems, neurological diseases, as well as any acute or chronic disease were excluded).
The AIMS, target-instrument of this study, has been
validated for the Brazilian population(21), with results that
demonstrate content validity — content validity index (CVI) for clarity between 66.7 and 92.8; CVI for relevance higher than 98.0; temporal stability – Spearman correlation (rho) 0.85; p<0.001; internal consistency – Cronbach’s coeficient alpha (αtotal) 0.88, αprone=0.86, αsupine=0.89, αseated=0.80,
α standing=0.85, and discriminating power (-4.842; p<0.001). AIMS assesses motor development of infants from birth to independent walking and consists of 58 motor criteria, distributed in four subscales that describe the development
of spontaneous movement and motor skills in prone(21),
supine(9), seated(12), and standing(16) postures. Each item
ob-served in the motor repertoire of the child receives score one if the child performs all key motor criteria; each item not observed receives score zero. At the end of the evaluation, the gross score is obtained from the sum of the score in each of the subscales, which can be converted into percentiles(24).
The percentiles allow for determining the motor develop-ment of the infant, categorized according to the following criteria: a) normal/expected motor performance, when the result in the test is above the 25th percentile in the curve; b) suspect motor development, when the result is from 25 to 6% in the curve; c) abnormal motor development, when the result is less than or equal to 5% in the percentile curve.
on aspects such as body surface that supports the weight, posture, and antigravity movements. Through the analysis of the footage, the concordance index was calculated, whose
values of interclass correlation ranged from α=0.86 to
α=0.99, indicating high levels of agreement. Furthermore,
according to the Friedman and Wilcoxon tests, no sig-niicant difference was found between the responses of the three evaluators (p>0.05).
To characterize the sample, a questionnaire was delivered to the parents, with the following items: date of birth, sex,
type of delivery, gestational age, Apgarscore at 5 minutes,
birth weight, birth length, head circumference and monthly family income. Parents and/or guardians answered the ques-tionnaire and forwarded it to the researcher.
Analyses were carried out in the Statistical Package for the Social Sciences (SPSS), version 17.0. The gross score of the AIMS was described as mean, median, standard deviation, minimum, maximum, and percentiles for the total sample. For comparison of total scores in the population groups, the one sample t-test was used, and for the comparison of percentiles, the binomial test of comparison was applied.
The level of signiicance was established at 5% (p≤0.05).
Results
Motor development of Brazilian children was lower than expected in 34.6% of the sample, 83 (10.4%) children presented motor delay and 192 (24.2%), suspected motor delay. However, most participants (520; 65.4%) presented normal motor development.
The performance results of Brazilian children showed, according to Table 1, lower gross scores, when compared to values in studies with Canadian and Greek children. Comparing Brazilian and Canadian children, only at 18 months of age it was observed signiicant greater values for motor development in Brazilian children. In other age groups, Canadian children presented higher scores. When performance was compared with Greek children, Brazilians showed lower scores in all age groups.
It can be observed lower performance in the development of Brazilian children by the curves of Figure 1, in which the national sample remained always below the Canadian and Greek reference scores. However, this variability decreases at the age extremes, being lower in newborns and in children over 15 months of age. From 13 months, overlapping curves
Table 1 - Comparison of motor development of Brazilian, Canadian, and Greek children, in gross scores of the Alberta Infant Motor Scale (AIMS)
Age (months)
M±SD BRxCA BRxGR
n F/M BR CA GR p-value p-value
0-<1 33 17/16 4.3±1.3 4.5±1.3 5±1.4 0.36 0.007*
1-<2 35 17/18 6.2±1.3 7.3±1.9 7.7±1.2 <0.0001* <0.001*
2-<3 35 17/18 8.4±1.9 9.8±2.45 10.6±1.9 <0.0001* <0.001*
3-<4 31 13/18 11.2±2.9 12.6±3.3 13±2.8 0.012* 0.002*
4-<5 44 23/21 14,9±3,5 17.8±4.1 16.9±3.2 <0.0001* <0.001*
5-<6 49 24/25 18.0±5.7 23.2±4.7 23.4±3.8 <0.0001* <0.001*
6-<7 42 20/22 22.6±6.4 28.3±5.5 28±5.0 <0.0001* <0.001*
7-<8 52 28/24 30.7±5.5 32.2 ±6.8 31.5±6.8 0.43 0.28
8-<9 47 17/30 36.8±7.7 39.7 ±8.7 37.1±8.6 0.12 0.81
9-<10 43 23/20 40.8±8.7 45.4 ±7.4 43.9±7.3 0.001* 0.025*
10-<11 45 26/19 43.4±8.1 49.3±5.9 49.4±4.5 <0.0001* <0.001*
11-<12 48 27/21 49.3±4.8 51.2±7.1 51.2±3.2 0.008* 0.01*
12-<13 35 21/14 53.4±3.4 55.5±4.5 54±2.2 0.01* 0.28
13-<14 54 25/29 54.0±3.9 55.6±5.0 55.9 ±2.2 0.005* 0.001*
14-<15 44 19/25 56.3±2.9 56.8±1.9 57.4±1.4 0.18 0.012*
15-<16 41 19/22 56.9±2.0 57.8±0.4 57.9±0.3 0.008* 0.003*
16-<17 46 21/25 57.8±0.6 57.8±0.5 57.7±1.1 0.96 0.23
17-<18 33 10/23 57.8±0.9 57.8±0.3 58±0 0.84 0.24
18-<19 38 21/17 57.9±0.5 57.7±0.6 – 0.035* –
begin to appear. In addition, there was greater similarity among the newborns of the three sample groups and there were an increasing number of motor skills in the following months. However, a non-linear motor development trend was observed in Brazilian children, tending to stabilize from 16 months of age, as observed in the scores of Canadian and Greek children from this age.
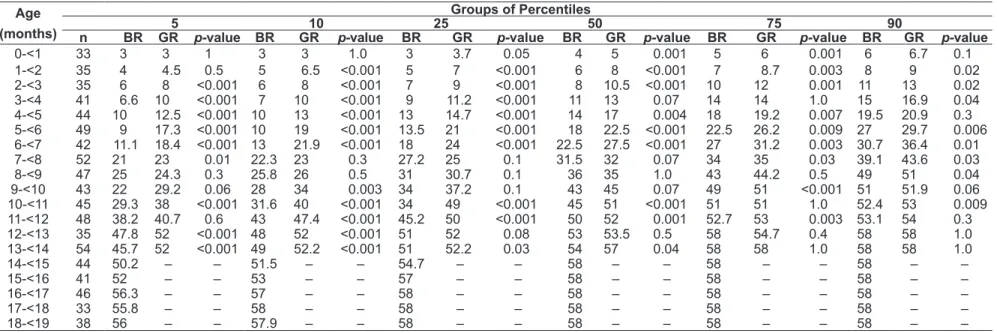
The overall mean of percentiles of the studied children was 42.38 (SD=27.52), 424 infants (53.34%) were below the 50th percentile. In Tables 2 and 3, the values of the 5th, 10th, 25th, 50th, 75th and 90th percentiles in the studied populations, demonstrating lower values in Brazilian chil-dren compared to Greek (Table 2) and Canadian (Table 3) children in all percentiles analyzed. Less variability between countries was identiied in the 75th and 90th percentiles.
Figure 2 shows that the similarities in the performance of Brazilian, Greek, and Canadian children occurred in the 75th and 90th percentiles. The curves for 5th, 10th, 25th and 50th percentiles demonstrated greater disparity between infant motor performances of the three countries, with Brazilian children below the other two groups. The analysis by age group showed greater similarity among newborn children in all percentiles.
Discussion
The development of motor skills in children investigated in this study occurs differently from Canadian and Greek children. National studies indicated motor delays in Brazilian children and reported lower motor scores when compared
to the Canadian standard established by AIMS(17-19,21).
For instance, Formiga and Linhares(17), while describing
the motor development of preterm children, demonstrated that the development curves, in a group of 308 infants from zero to 12 months old, denoted underperformance for age. A similar trend was previously reported in several studies
of children of different age groups(18,19,21). A study with
children from northeastern Brazil, is to date, one of the few studies that have found similarities in motor performance of northeastern and Canadian children(25).
In this work, the different motor trajectories of Brazilian children may have been determined by risk factors hat increase vulnerability and predisposition to motor
abnor-malities(26). Children in developing countries have greater
exposure to biological risk factors, such as prematurity and malnutrition(13,26), and local conditions, such as low demand
for health services(27), inappropriate maternal practices(28-30),
as well as low maternal and paternal education,
socioeco-nomic vulnerability, and little stimulation at home(31,32).
This exposure has negative repercussion on the acquisition of motor milestones of childhood. For instance, a recent
national study(33) showed that children with motor
devel-opment levels below those expected for their age had been breastfed for a short time and were from low-income families, where the father was absent. Therefore, the quality of the stimulus offered at home is determining to the development
of motor behaviors(31), one of the possible mechanisms by
which low income, factor present in developing countries, adversely affects children’s behavioral acquisitions(26) and may
be responsible for the observed differences.
Although this is a plausible explanation for the observed differences, it draws the attention of researchers in perfor-mance observed also in developed countries such as, for instance, Netherlands and Australia. Fleuren et al(16), assessed
Dutch children up to 12 months of age, and showed that 75% were below the 50th percentile, and scores were lower in all age groups. A study with 800 Dutch children con-verged to similar results of lower scores in preterm infants,
even using corrected age(13). A longitudinal study developed
in Australia found a similar trend, when analyzing preterm and term infants at 4, 8, and 12 months, demonstrating infe-riority in performance levels, regardless of gestational age(12).
In Greece, however, Syrengelas et al(20), in a study with 424
children, showed that the curves of motor development in Greek and Canadian babies are similar, highlighting that the AIMS reference values can be used without loss of important clinical information. This contradiction of international
Brazil Canada
AIMS crude score
Greece 0 1 2 3 4 5 6 7 8 9 10 11 12 13 14 15 16 17 18 70
60
50
40
30
20
10
0
Age (months)
355
Raquel Saccani et al
(months) n BR GR5 p-value BR GR10 p-value BR 25GR p-value BR 50GR p-value BR GR75 p-value BR 90GR p-value
0-<1 33 3 3 1 3 3 1.0 3 3.7 0.05 4 5 0.001 5 6 0.001 6 6.7 0.1
1-<2 35 4 4.5 0.5 5 6.5 <0.001 5 7 <0.001 6 8 <0.001 7 8.7 0.003 8 9 0.02
2-<3 35 6 8 <0.001 6 8 <0.001 7 9 <0.001 8 10.5 <0.001 10 12 0.001 11 13 0.02
3-<4 41 6.6 10 <0.001 7 10 <0.001 9 11.2 <0.001 11 13 0.07 14 14 1.0 15 16.9 0.04
4-<5 44 10 12.5 <0.001 10 13 <0.001 13 14.7 <0.001 14 17 0.004 18 19.2 0.007 19.5 20.9 0.3
5-<6 49 9 17.3 <0.001 10 19 <0.001 13.5 21 <0.001 18 22.5 <0.001 22.5 26.2 0.009 27 29.7 0.006
6-<7 42 11.1 18.4 <0.001 13 21.9 <0.001 18 24 <0.001 22.5 27.5 <0.001 27 31.2 0.003 30.7 36.4 0.01
7-<8 52 21 23 0.01 22.3 23 0.3 27.2 25 0.1 31.5 32 0.07 34 35 0.03 39.1 43.6 0.03
8-<9 47 25 24.3 0.3 25.8 26 0.5 31 30.7 0.1 36 35 1.0 43 44.2 0.5 49 51 0.04
9-<10 43 22 29.2 0.06 28 34 0.003 34 37.2 0.1 43 45 0.07 49 51 <0.001 51 51.9 0.06
10-<11 45 29.3 38 <0.001 31.6 40 <0.001 34 49 <0.001 45 51 <0.001 51 51 1.0 52.4 53 0.009
11-<12 48 38.2 40.7 0.6 43 47.4 <0.001 45.2 50 <0.001 50 52 0.001 52.7 53 0.003 53.1 54 0.3
12-<13 35 47.8 52 <0.001 48 52 <0.001 51 52 0.08 53 53.5 0.5 58 54.7 0.4 58 58 1.0
13-<14 54 45.7 52 <0.001 49 52.2 <0.001 51 52.2 0.03 54 57 0.04 58 58 1.0 58 58 1.0
14-<15 44 50.2 – – 51.5 – – 54.7 – – 58 – – 58 – – 58 – –
15-<16 41 52 – – 53 – – 57 – – 58 – – 58 – – 58 – –
16-<17 46 56.3 – – 57 – – 58 – – 58 – – 58 – – 58 – –
17-<18 33 55.8 – – 58 – – 58 – – 58 – – 58 – – 58 – –
18-<19 38 56 – – 57.9 – – 58 – – 58 – – 58 – – 58 – –
The data concerning the Greek sample were published by Syrengelas et al(20)
Table 3 - Performance Comparison between Brazil (BR) and Canada (CA), considering the mean of the 5th, 10th, 25th, 50th, 75th and 90th percentiles from the Alberta
Infant Motor Scale (AIMS)
Age
(months)
Groups of Percentiles
5 10 25 50 75 90
n BR CA p-value BR CA p-value BR CA p-value BR CA p-value BR CA p-value BR CA p-value
0-<1 33 3 2.2 0.2 3 2.7 0.03 3 3.6 0.05 4 4.5 0.7 5 5.4 0.4 6 6.3 0.1
1-<2 35 4 4.1 0.5 5 4.8 0.3 5 6 <0.001 6 7.3 <0.001 7 8.6 0.003 8 9.8 0.02
2-<3 35 6 5.8 0.2 6 6.7 0.02 7 8.2 <0.001 8 9.8 0.2 10 11.4 0.001 11 12.9 0.1
3-<4 41 6.6 7.2 0.02 7 8.4 0.08 9 10.4 0.012 11 12.6 0.5 14 14.8 0.08 15 16.8 0.04
4-<5 44 10 11.1 0.001 10 12.6 0.03 13 15.1 <0.001 14 17.9 0.004 18 20.7 0.002 19.5 23.2 0.01
5-<6 49 9 15.4 <0.001 10 17.1 <0.001 13.5 20 <0.001 18 23.2 <0.001 22.5 26.4 0.009 27 29.3 0.006
6-<7 42 11.1 19.3 <0.001 13 21.2 <0.001 18 24.6 <0.001 22.5 28.3 <0.001 27 32 0.003 30.7 35.4 0.01
7-<8 52 21 21 0.5 22.3 23.5 0.3 27.25 27.7 0.6 31.5 32.3 0.07 34 36.9 0.01 39.1 41.1 0.03
8-<9 47 25 25.5 0.2 25.8 28.7 0.2 31 33.9 0.1 36 39.8 0.02 43 45.7 0.07 49 50.9 0.04
9-<10 43 22 33.2 <0.001 28 35.9 0.001 34 40.5 0.01 43 45.5 0.07 49 50.5 0.06 51 55.1 0.01
10-<11 45 29.3 29.6 <0.001 31.6 41.7 <0.001 34 45.3 <0.001 45 49.3 0.07 51 53.3 <0.001 52.4 56.9 0.009
11-<12 48 38.2 39.6 0.6 43 42.2 0.3 45.25 46.5 0.4 50 51.3 0.3 52.75 56.1 0.001 53.1 58 0.006
12-<13 35 47.8 47.2 0.5 48 48.8 0.5 51 51.6 0.2 53 54.6 0.02 58 57.6 0.5 58 58 1.0
13-<14 54 45.7 47.4 0.5 49 49.2 0.5 51 52.2 0.03 54 55.6 0.5 58 58 1.0 58 58 1.0
14-<15 44 50.2 – – 51.5 – – 54.75 – – 58 – – 58 – - 58 -
-15-<16 41 52 – – 53 – – 57 – – 58 – – 58 – - 58 -
-16-<17 46 56.35 – – 57 – – 58 – – 58 – – 58 – - 58 -
-17-<18 33 55.8 – – 58 – – 58 – – 58 – – 58 – - 58 -
-AIMS gross score – 5th percentile
AIMS gross score – 25th percentile
Age (months)
Brazil Canada Greece
0 1 2 3 4 5 6 7 8 9 10 11 12 13 14 15 16 17 18
Age (months)
Brazil Canada Greece
0 1 2 3 4 5 6 7 8 9 10 11 12 13 14 15 16 17 18 60
50
40
30
20
10
0
70
60
50
40
30
20
10
0
AIMS gross score – 75th percentile
Age (months)
Brazil Canada Greece
0 1 2 3 4 5 6 7 8 9 10 11 12 13 14 15 16 17 18 70
60
50
40
30
20
10
0
AIMS gross score – 10th percentile
70
60
50
40
30
20
10
0
Age (months)
Brazil Canada Greece
0 1 2 3 4 5 6 7 8 9 10 11 12 13 14 15 16 17 18
AIMS gross score – 50th percentile
Age (months)
Brazil Canada Greece
0 1 2 3 4 5 6 7 8 9 10 11 12 13 14 15 16 17 18 70
60
50
40
30
20
10
0
AIMS gross score – 90th percentile
Age (months)
Brazil Canada Greece
0 1 2 3 4 5 6 7 8 9 10 11 12 13 14 15 16 17 18 70
60
50
40
30
20
10
0
results emphasizes that the properties of evaluation tools such as the AIMS suffer interference in the results in the face of adaption to another environment and to distinct socioeconomic, ethnic, and cultural factors(16,34).
The mean and variability of gross scores indicated a tendency in stabilization of motor skills from the age of 16 months, in the three countries. We highlight the interfer-ence of the limited number of items on the AIMS to assess motor performance in the age extremes, reducing, thus, the scale’s parameters of dificulty(21,35). Valentini and Saccani
reported the poor sensitivity of the AIMS in the age extremes until 2 months of age and after 15 months, as also observed
in the Canadian reference values(21,24) and in an Australian
study by Pin et al(12). It is observed, therefore, with the use
of the AIMS, the “ceiling effect” in behavioral acquisitions of children from 15 months of age.
The results showed that after 15 months, Brazilian chil-dren present a similar performance to the other two popu-lation samples. A possible explanation lies in the further exploration and interaction with the environment, after the advent of independent walking, which makes the child more independent and less dependent on parental stimulation. This possibility should be considered, once a national study showed similar performance of Brazilian children compared
to the U.S. children from 6 months, using the Bayley scale(34)
as an assessment tool. This explanation should be further investigated, especially after the acquisition of independent walking. Although performance differences prevailed be-tween the investigated samples, moments of similarity can be observed in the motor performance of children from the three countries; only in speciic percentiles (for example, in Brazilian and Greek children aged 4 months in the 90th percentile and Brazilian and Canadian children at nine months in the 50th and 75th percentiles). These data are challenging, and point to the need for further research on the comparisons in speciic percentiles.
Another interesting aspect of this study was the observation of nonlinear motor performance and periods of greater stability in motor skill acquisitions, as noted in previous studies(17,18).
This instability in motor skill acquisition signals the im-portance of monitoring the child over time to identify the actual motor changes and direct the intervention to the needs observed, providing better quality of life for many children.
The present study presents a unique and original contri-bution to existing knowledge, since it is the irst research to compare the percentiles in three population groups. However, the lack of detailed characterization of Canadian
and Greek samples limited, in part, the comparison of population samples, as well as the discussion regarding the peculiarities of biologic and environmental impacts. The het-erogeneity of the samples from Brazil, Canada, and Greece, although it may represent a bias, justiies the importance of the study and encourages the use of national parameters in research development performance. It is noteworthy that the generalization of the results to the entire Brazilian popula-tion will only be possible after further research, including different regions of the country and that ensure control over the existing cultural variations. However, the results of this study point to a possible inaccurate categorization of the performance of Brazilian children, and, therefore, they should be considered, especially for samples of the national population with socioeconomic and cultural characteristics similar to those presented.
The cross-sectional design of the study can be seen as a limitation by some researchers, but some essential advan-tages were established with this design. It allowed the inves-tigation of a large group of participants, readiness to collect information about the investigated phenomenon and lower sample loss. Cross-sectional studies deine demographic and clinical characteristics and are regarded as adequate in the study of prevalence of delays and risk factors, object of this work. Future research may, from this research, determine a sample for cohort and/or clinical trials.
In conclusion, the differences between Brazilian, Canadian, and Greek children were prevalent until 15 months of age and a representative number of the Brazilian sample presented performance below the expected for age (34.6%). The results may represent a different trajectory in motor development, due, possibly, to the inluence of sociocultural factors, which reinforces the need to use the Brazilian rules to categorize the motor performance of children.
References
1. Clark JE, Metcalfe JS. Themountain of motor development: ametaphor. In: Clark JE, Humphrey JH, editors.Motor development: research and reviews.
Reston: Naspe; 2002.
2. Blackman JA. Early intervention: a global perspective. Inf Young Children 2002;15:11-9.
3. Blauw-Hospers CH, de Graaf-Peters VB, Dirks T, Bos AF, Hadders-Algra M. Does early intervention in infants at high risk for a developmental motor disorder improve motor and cognitive development? Neurosci Biobehav Rev 2007;31:1201-12.
4. Vanderveen JA, Bassler D, Robertson CM, Kirpalani H. Early interventions involving parents to improve neurodevelopmental outcomes of premature infants: a meta-analysis. J Perinatol 2009;29:343-51.
5. Spittle AJ, Doyle LW, Boyd RN. A systematic review of the clinimetric properties of neuromotor assessments for preterm infants during the irst year of life. Dev Med Child Neurol 2008;50:254-66.
6. Vaccarino FM, Ment LR. Injury and repair in the developing brain. Arch Dis Child Fetal Neonatal Ed 2004;89:F190-2.
7. Formiga CK, Pedrazzani ES, Silva FP, Lima CD. Effectiveness of the early intervention program with preterm infants. Paideia 2004;14:301-11. 8. Almeida CS, Valentini NC.Information integration and memory reactivation: the
positive effects of a cognitive-motor intervention in babies. Rev Paul Pediatr 2010;28:15-22.
9. Müller AB. Efeitos da intervenção motora em diferentes contextos no desenvolvimento da criança com atraso motor [tese de mestrado]. Rio Grande do Sul (RS): UFRGS; 2008.
10. Piper MC, Pinnell LE, Darrah J, Maguire T, Byrne PJ. Construction and validation of the Alberta Infant Motor Scale (AIMS).Can J Public Health 1992;83 (Suppl 2):S46-50.
11. Pin TW, Darrer T, Eldridge B, Galea MP. Motor development from 4 to 8 months corrected age in infants born at or less than 29 weeks’ gestation. Dev Med Child Neurol 2009;51:739-45.
12. Pin TW, Eldridge B, Galea MP. Motor trajectories from 4 to 18 months corrected age in infants born at or less than 30 weeks of gestation. Early Hum Dev 2010;86:573-80.
13. Van Haastert IC, de Vries LS, Helders PJ, Jongmans MJ. Early gross motor development of preterm infants according to the Alberta Infant Motor Scale. J Pediatr 2006;149:617-22.
14. Spittle AJ, Ferretti C, Anderson PJ, Orton J, Eeles A, Bates L et al. Improving the outcome of infants born at <30 weeks’ gestation – a randomized controlled trial of preventative care at home. BMC Pediatr 2009;9:73.
15. Harris SR, Backman CL, Mayson TA. Comparative predictive validity of the Harris Infant Neuromotor Test and the Alberta Infant Motor Scale. Dev Med Child Neurol 2010;52:462-7.
16. Fleuren KM, Smit LS, Stijnen T, Hartman A. New reference values for the Alberta Infant Motor Scale need to be established. Acta Paediatr 2007;96: 424-7.
17. Formiga CK, Linhares MB. Motor development curve from 0 to 12 months in infants born preterm. Acta Paediatr 2011;100:379-84.
18. Lopes VB, Lima CD, Tudella E. Motor acquisition rate in Brazilian infants. Infant Child Dev 2009;18:122-32.
19. Saccani R, Valentini NC. Reference curves for the Brazilian Alberta Infant Motor Scale: percentiles for clinical description and follow-up over time. J Pediatr (Rio J) 2012;88:40-7.
20. Syrengelas D, Siahanidou T, Kourlaba G, Kleisiouni P, Bakoula C, Chrousos GP. Standartization of the Alberta Infant Motor Scale in full-term Greek infants: preliminary results. Early Hum Dev 2010;86:245-9.
21. Valentini NC, Saccani R. Brazilian validation of the Alberta Infant Motor Scale. Phys Ther 2012;92:440-7.
22. Uesugui M, Tokuhisa K, Shimada T. The reliability and validity of the Alberta Infant Motor Scale in Japan. J Phys Ther Sci 2008;20:169-75.
23. Manacero S, Nunes ML. Evaluation of motor performance of preterm newborns during the irst months of life using the Alberta Infant Motor Scale (AIMS). J Pediatr (Rio J) 2008;84:53-9.
24. Piper MC, Darrah J. Motor assessment of the developing infant. Philadelphia: WB Saunders; 1994.
25. Maia PC, Silva LP, Oliveira MM, Cardoso MV. Motor development of preterm and term infants – using the Alberta Infant Motor Scale. Acta Paul Enferm 2011;24:670-5.
26. Walker SP, Wachs TD, Gardner JM, Lozoff B, Wasserman GA, Pollitt E, Carter JA; International Child Development Steering Group. Child development: risk factors for adverse outcomes in developing countries. Lancet 2007;369:145-57. 27. Campos D, Santos DC, Gonçalves VM, Montebello MIL, Goto MM, Gabbard C. Postural control of small for gestacional age infants born at term. Rev Bras Fisioter 2007;11:7-12.
28. Pin T, Eldridge B, Galea MP. A review of the effects of sleep position, play position, and equipment use on motor development in infants. Dev Med Child Neurol 2007;49:858-67.
29. Kuo YL, Liao HF, Chen PC, Hsieh WS, Hwang AW. The inluence of wakeful prone positioning on motor development during the early life. J Dev Behav Pediatr 2008;29:367-76.
30. Fetters L, Huang HH. Motor development and sleep, play, and feeding positions in very-low-birthweight infants with and without white matter disease. Dev Med Child Neurol 2007;49:807-13.
31. Hamadani JD, Tofail F, Hilaly A, Huda SN, Engle P, Grantham-Mcgregor SM. Use of family care indicators and their relationship with child development in Bangladesh. J Health Popul Nutr 2010;28:23-33.
32. Raniero EP, Tudella E, Mattos RS. Pattern and rate of motor skill acquisition among preterm infants during the irst four months corrected age. Rev Bras Fisioter 2010;14:396-403.
33. Zajonz R, Müller AB, Valentini NC. The inluence of environmental factors in motor and social performance of children from the suburb of Porto Alegre. Rev Educ Fis 2008;19:159-71.
34. Santos DC, Gabbard C, Goncalves VM. Motor development during the irst 6 months: the case of Brazilian infants. Infant Child Dev 2000;9:161-6. 35. Liao PJ, Campbell SK. Examination of the item structure of the Alberta Infant