SUMMARY
BACKGROUND AND OBJECTIVES: Pain is a subject-ive and individual sensation causing major discomfort. So, it is necessary to put into practice methods to objectively quantify it. Several studies indicate that evoked potentials (EP) generate responses which may relect painful process -es. Our study has used characteristics extracted from the M wave, which is a type of EP related to neuromuscular response, as possible pain sensation markers.
METHOD: Participated in this study 13 volunteers, being 6 males and 7 females. Five sessions of an ex-perimental protocol were held. In each session, volun-teers received electrical stimulations on the abductor hallucis muscle. Initially, 1 mA current with 20 pulses of 2 Hz was applied. Then, the electric current was in-cremented in 1 mA until volunteer reported maximum pain. For female volunteers, menstrual cycle day in each session was also recorded. Several M wave char-acteristics were evaluated.
RESULTS: Global minimum of the M wave is correlat-ed to increascorrelat-ed electric current amplitude of stimulation, and consequently to more pain felt by the individual. Fe-male participants have reported pain threshold and toler-ance with lower electric current intensity as compared to male volunteers.
Analysis of the relationship between M wave parameters and pain *
Análise da relação entre parâmetros da onda M e a dor
Alessandro Ribeiro de Pádua Machado
1, Iraides Moraes de Oliveira
1, Adriano Pereira Alves
2, Adriano
Oliveira Andrade
2* Received fro the Laboratory of Biomedical Engineerig (BIOLAB), School of Electric Engineering, Federal University of Uberlândia. Uberlândia, MG.
1. Doctorate Student of the Post-Graduation Course in Elec-tric Engineering, Federal University of Uberlândia. Uberlân-dia, MG, Brazil.
2. Professor of the School of Electric Engineering, Federal University of Uberlândia. Uberlândia, MG, Brazil.
Correspondence to:
Alessandro Ribeiro de Pádua Machado
Avenida João Naves de Ávila, 2121, Campus Santa Mônica Bloco 1E, Sala 8
38408-100 Uberlândia, MG. Phone: (34) 3239-4771
E-mail: [email protected]
CONCLUSION: Global minimum of the M wave was related to increased pain and in males pain threshold and tolerance were higher as compared to females. Dif-ferent menstrual cycle phases have not interfered with evaluations.
Keywords: Electric stimulation, Evoked potentials, Pain, Sensory threshold.
RESUMO
JUSTIFICATIVA E OBJETIVOS: A dor é uma sen-sação subjetiva e individual que causa muitos descon-fortos para quem a sente. Dessa forma, é necessário por em prática métodos que a quantiiquem objetiva -mente. Vários estudos indicam que os potenciais evo-cados (PE) produzem respostas que podem reletir os processos dolorosos. Este estudo utilizou característi-cas extraídas da onda M, sendo esta um tipo de PE re-lacionado à resposta neuromuscular, como possíveis marcadores da sensação de dor.
MÉTODO: Treze voluntários, sendo 6 do sexo mas-culino e 7 do sexo feminino, foram incluídos no estu-do. Foram realizadas cinco sessões de um protocolo experimental. Em cada sessão o voluntário recebeu estímulos elétricos no músculo abdutor do hálux. Ini-cialmente foi aplicada uma corrente de 1 mA com 20 pulsos de 2 Hz. Depois a corrente elétrica foi incre-mentada de 1 mA em 1 mA até que o voluntário rela-tasse a dor máxima. Nos voluntários do sexo femini-no foi registrado também o dia do ciclo menstrual em cada sessão do experimento. Foram avaliadas várias características das ondas M.
de corrente elétrica menor quando comparados aos vo-luntários do sexo masculino.
CONCLUSÃO: O mínimo global da onda M mostrou relação com o aumento da sensação dolorosa sendo que no sexo masculino o limiar e a tolerância à dor foram maiores que no sexo feminino, e as diferentes fases do ciclo menstrual não interferiram nas avaliações.
Descritores: Dor, Estimulação elétrica, Limiar senso-rial, Potenciais evocados.
INTRODUCTION
Pain is a subjective and individual sensation, cur-rently measured with subjective scales with potential susceptibility to contamination by several factors ex-ternal to the immediate pain sensation, such as anx-iety, expectations, past experiences, among others, which may contribute to errors and confuse subject-ive pain variations1.
For causing so much trouble and being unable to be ob-jectively measured2, it is necessary to look for alterna-tives to objectively quantify pain to use the most ad-equate treatment according to its real intensity, that is, detecting pain via a mechanism not inluenced by emo -tional factors. Pain intensity evaluation is, in general, done with the help of the visual analog scale (VAS)3, which is also subjective.
Several studies report the importance of identifying pain intensity, however they use subjective and not always reliable methods for such measurements, since most methods require some voluntary answer from the patient who, sometimes, is unable to react or to understand what should be done4-6.
Pain may be evaluated with tools such as electro-myography (EMG), evoked potentials analysis and electrical stimulation7. Electrical stimulation is widely used in physical therapies8. A study carried out to assess the level of sensory discomfort caused by low and medium frequency currents in electrical stimulation of femoral quadriceps muscles in healthy women makes clear the presence of pain during elec-trical stimulation sessions9.
This study aimed at using electrical stimulation as pain stimulation means and at assessing the possible correla-tion between M wave parameters and pain sensacorrela-tions reported by volunteers and evaluated with VAS.
METHOD
After the approval of the Research Ethics
Commit-tee, Federal University of Uberlândia (UFU), protocol 036/09, this study was carried out with 13 healthy in-dividuals, being 6 males and 7 females, aged between 18 and 30 years, students of UFU courses. Data were collected in the Laboratory of Biomedical Engineering (Biolab) of the university.
Inclusion criteria were no history of surgery, domin-ant lower limb pain or injury. Exclusion criteria were presence of central or peripheral neurological disor-ders and rheumatic impairment; use of pacemaker or heart problems; obesity; use of drugs changing mo-tor control and peripheral sensitivity, such as benzo-diazepines, opioids, anti-histaminics, anticonvulsants and antidepressants; lower limb amputation and dia-betes mellitus.
Every volunteer participated in ive experimental ses -sions. All sessions were carried out in the same period of the day due to possible Circadian rhythm inluences. During the experiments, volunteers remained com-fortably in the supine position in a reclining chair, with plantar ankle flexion and foot inversion. Domin-ant foot was used. Before positioning the electrodes, skin was cleaned with alcohol and, when needed, it was shaved. Reference electrode of the electrical stimulation was fixed at the lateral foot margin and electrical stimulation electrode was placed at the medial foot margin, at the motor point of the abduct-or hallucis muscle.
To detect the motor point of the abductor hallucis muscle a pen-shaped electrode was used which was slid over the medial foot margin simultaneously with electrical pulses emission. The point with the max-imum mechanical response with minmax-imum current was considered the motor point of the abductor hal-lucis muscle (Figure 1).
EMG electrodes were ixed between the motor point and the distal muscle tendon, with the reference elec-trode positioned on the medial malleolus of the same limb. Electromyographical signal capturing electrode and the reference electrode were ixed with tapes speciic for this purpose and an electroslag paste was used between the electrodes and the skin (Figure 2). To ensure that EMG and electrical stimulation elec-trodes were positioned at the same place during the ive days of test, each electrode received a staining layer which remains on the skin for approximately one week, popularly known as henna, because medial malleolus is very protuberant.
max-parameters and pain
imum supportable limit using VAS, and the volunteer has verbally indicated pain perception from zero to 10, being zero no pain and 10 maximum tolerable pain. Volunteers received stimulations of 20 pulses of 2 Hz and 0.3 ms as from 1 mA. After each series of 20 pulses, volunteers have reported pain intensity perceived ac-cording to VAS and made observations they considered necessary for the researcher. After volunteers’ report, other 20 pulses were emitted with 1 mA increments and so on, until volunteers reported pain intensity = 10. During each 20 pulses session, the researcher has record-ed pain perceivrecord-ed by the volunteer on a table according to VAS and also reported observations. The researcher
has also recorded birth date, period of the day in which the experiment was carried out, experiment day, gender and menstrual cycle period for females.
Electrical stimulation and electromyographic data were recorded with the Neuropack S1 MEB-9400 equipment, from Nihon Kohden, Japan.
M wave data generated by the Neuropack equipment were stored in text format (.txt) and analyzed by custom-ized programs developed by MatLab (MathWorks). From these programs, it was possible to estimate the following M wave parameters: minimum and maximum peak and time when they occurred. Each parameter was correlated to pain sensation reported in VAS. Preliminary evaluations have shown that only the minimum peak, that is, M wave global minimum, was correlated to pain sensation and so, only re-sults with correlation with pain sensation were considered.
RESULTS
Graph 3 shows the relationship between applied current value (in mA) in the X-axis and minimum M wave peak value (in µV) in the Y-axis. Tables 1 and 2 show values of applied current in mA when each subject has reported the presence of pain sensation. The leftmost column describes general mean of all volunteers described in each one of the tables, with their respective standard deviation.
Tables 3 and 4 show values where each subject has reported tolerance to pain in each session and table 5 shows the menstrual cycle day in which female volun-teers where submitted to tests, considering day one the day in which the volunteer menstruated and that all vol-unteers have a menstrual cycle of 28 days.
Figure 1 – Detection of abductor hallucis muscle motor point (medial margin).
Figure 2 – Positioning of electrodes on foot medial margin.
(1) EMG electrodes, (2) electrical stimulation electrode, (3) EMG reference electrode.
Graph 3 – Relationship between M wave minimum peak and applied current.
Current Applied (mA)
W
a
ve
M
Mi
n
imu
m
Pe
a
k
(µ
g
)
Session 1
Session 2
Session 3
Session 4
Subjects Session 1 Session 2 Session 3 Session 4 Session 5 Mean ± SD General mean ± SD
1 15 17 19 20 22 18.6 ± 2.7
2 17 19 19 18 21 18.8 ± 1.4
3 27 19 26 30 30 26.4 ± 4.5 16.8 ± 5.7
4 9 9 11 10 12 10.2 ± 1.3
5 13 12 14 13 13 13 ± 0.7
6 17 13 13 14 14 14.2 ± 1.6
Table 2 – Current values in mA in which volunteers have reached pain threshold and mean and standard deviation of female subjects in each test.
Subjects Session 1 Session 2 Session 3 Session 4 Session 5 Mean ± SD General mean ± SD
7 14 14 14 16 17 15 ± 1.4
8 11 11 15 16 14 13.4 ± 2.3
9 15 16 13 22 22 17.6 ± 4.1 14.9 ± 2.8
10 11 14 10 10 12 11.4 ± 1.6
11 15 11 11 11 10 11.6 ± 1.9
12 15 18 17 15 21 17.2 ± 2.4
13 17 18 19 19 18 18.2 ± 0.8
Table 3 – Stimulation current values in mA in which volunteers have reached pain tolerance reported by each male subject with individual and general mean and standard deviation.
Subjects Session 1 Session 2 Session 3 Session 4 Session 5 Mean ± SD General mean ± SD
1 30 30 33 33 38 32.8 ± 3.2
2 39 44 43 43 49 43.6 ± 3.5
3 - - - 36.5 ± 7.4
4 21 29 26 24 31 26.2 ± 3.9
5 44 41 47 45 42 43.8 ± 2.3
6 35 39 35 35 38 36.4 ± 1.9
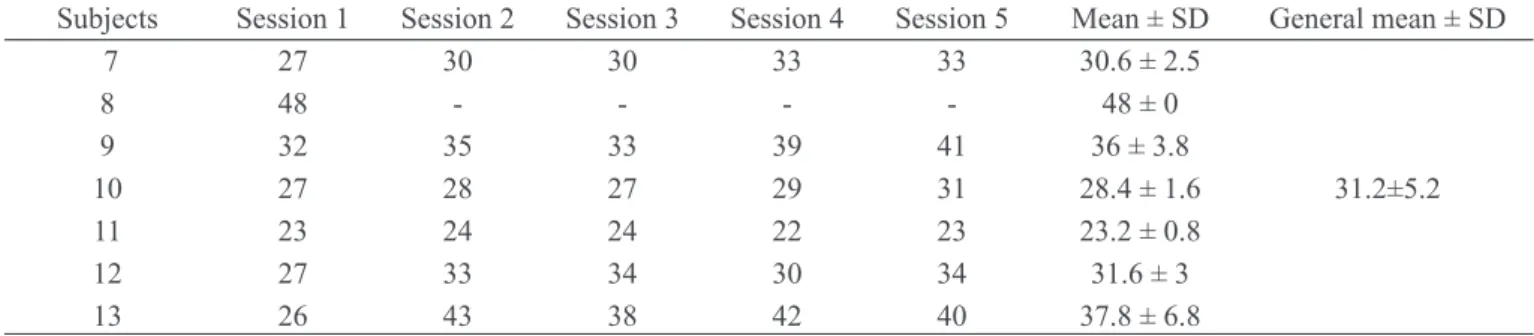
Table 4 – Stimulation current values in mA in which volunteers have reached pain tolerance reported by each female subject with individual and general mean and standard deviation.
Subjects Session 1 Session 2 Session 3 Session 4 Session 5 Mean ± SD General mean ± SD
7 27 30 30 33 33 30.6 ± 2.5
8 48 - - - - 48 ± 0
9 32 35 33 39 41 36 ± 3.8
10 27 28 27 29 31 28.4 ± 1.6 31.2±5.2
11 23 24 24 22 23 23.2 ± 0.8
12 27 33 34 30 34 31.6 ± 3
13 26 43 38 42 40 37.8 ± 6.8
Table 5 – Menstrual cycle day in which volunteers were submitted to tests.
Subjects Session 1 Session 2 Session 3 Session 4 Session 5
7 Day 7 Day 10 Day 11 Day 12 Day 14
8 Day 20 Day 21 Day 22 Day 23 Day 24
9 - - - -
-10 Day 2 Day 3 Day 6 Day 9 Day 10
11 Day 14 Day 15 Day 17 Day 18 Day 24
12 Day 2 Day 3 Day 4 Day 5 Day 7
parameters and pain
DISCUSSION
There is major correlation between M wave min-imum peak decrease and increased intensity of the current applied to individuals, both males and fe-males. Results were as expected, showing a strong correlation between analyzed M waves parameter, minimum peak and increased current, consequently with increased pain.
A study using as pain stimulation hypertonic saline solution injection has not shown M wave changes with regard to conduction velocity, spectral ampli-tude and content10, leading the author to conclude that saline solution injection does not change muscle ibers membrane properties and that muscle activity decrease during voluntary contractions was probably due to a central, spinal or supraspinal phenomenon. In our study, the pain induction protocol has shown that M waves had their amplitudes changed. Some au-thors understand that a change in M wave amplitude is related to changes in pH, temperature and muscle ibers diameter10,11. M wave valley is exactly the point were there is major change in membrane patency and ibers contract due to a fast ions inlow caused by this patency change. This contraction is closely related to pain perception, which is the focus of the study. Such factor clearly shows the high correlation between minimum peak of this wave and the stimulating elec-trical current.
Pain threshold and its means in male subjects in each test (Table 1) allow us to observe that in subjects 2, 4, 5 and 6 values were maintained close in all tests, with a maximum standard deviation of 1.6 without major variations.
This brings more reliability to the method used be-cause it shows that even in different days, the sub-jects had the same perception of the stimulation and reported pain with levels very close to the current, if not equal. Table 1 also shows that in most male subjects pain threshold was reported with a lower stimulation current in the first session with regard to subsequent sessions. This may be explained by subject’s pain expectations because all of them have reported at the end of the first session that pain perceived was lower than pain expected before the experiment.
With regard to females, subjects 8, 9 and 12 (Table 2) had standard deviation higher than 2 with regard to pain threshold mean. As with males, pain threshold reported during the irst session was with low currents
as compared to other sessions. Only subject 11 has reported pain perception at 15 mA in the irst session, at 11 mA in the second, third and fourth sessions and at 10 mA in the last session.
In comparing males and females, it was observed that mean pain threshold value was higher for males, 16.8 and 14.9, respectively. These results are in line with a study aiming at assessing physio-logical and psychophysio-logical measurements related to gender in experimental pain reports12, study where females have reported lower pain thresholds and tolerance. Our study supports the literature re-view13,18 which has concluded that further studies are needed to differentiate pain sensation between males and females.
The analysis of pain tolerance between males and fe-males (Tables 3 and 4) shows that, as in pain thresh-old, in the irst session, with exception of subject 5, all subjects have reported such threshold with a lower current value as compared to other sessions. Subject 3 could not be evaluated because in all sessions he reached 50 mA reporting VAS values below 10. With regard to females, current value needed to reach max-imum pain in the irst session was not higher than in other sessions.
In comparing males and females, it was noticed that current value needed to reach maximum pain value was higher for males (36.5) as compared to females (31.2). These data are also in line with a study show-ing signiicant difference in pain tolerance between males and females12.
Table 5 shows menstrual cycle phase of each volun-teer during each test. First menstrual cycle day was considered the day in which menstruation has started. Except to volunteer 3, all volunteers have reported the cycle phase they were in. When women are in the pre-menstrual cycle, they feel abdominal and muscle pain and so we have supposed that volunteers could be more susceptible to pain sensation during this per-iod, but this was not conirmed14,15.
The most rigorous tool about pre-menstrual param-eters, the Daily Symptom Report (DSR), states that pre-menstruation presents symptoms 6 days before menstruation14. So, subjects 9 (tests 4 and 5), 11 (test 5) and 13 (tests 3 4 and 5) were in the pre-menstrual cycle during the tests. There has been no difference when tests performed in the pre-menstrual cycle were compared to other menstrual cycle periods of volun-teer females.
dif-ferent factors to pain, aiming at inding a way to quan -tify this sensation. Biopotentials may be very helpful for this task because they are processes not sensitive to personal changes, such as past experiences, mood status, etc. Such changes may impair studies evaluat-ing pain only through subjective scales.
Our study has chosen the M wave because it is an evoked potential free from personal changes, thus being able to use physiological parameters to meas-ure pain. Our protocol has shown that M wave par-ameter with higher correlation with the stimulation is its lower peak, or valley. So, our study has cor-related M wave valley to pain inducing electrical stimulation. This correlation was very consistent in all volunteers, indicating that we have followed the right path.
The study has also observed that females had a lower pain threshold as compared to males and that pain tolerance in females was also lower, showing higher pain sensitivity of females.
A major contribution of this study was the develop-ment and validation of a new pain induction proto-col. Another major contribution was the inding of a major M wave parameter which may be correlated to pain. Showing the difference in pain perception be-tween males and females was also a major aspect of this study which should be taken into consideration. Further studies should be carried out to expand the validity of our results: using the same protocol with a higher number of subjects for further validation of our data; assessment of other M wave characteristics as possible pain sensation markers; statistical analysis to assess the relevance of pain threshold differences between males and females; using this protocol to compare healthy subjects to those with chronic pain.
CONCLUSION
M wave global minimum has shown relationship with pain sensation increase and in males pain threshold and tolerance were higher than in females. Differ-ent menstrual cycle phases have not interfered with evaluations.
ACKNOWLEDGMENTS
We acknowledge the Laboratory of Biomedical En-gineering team (Biolab - http://www.biolab.eletrica. ufu.br/) of the School of Electric Engineering, Fed-eral University of Uberlândia (Uberlândia, MG) and
the Coordination of Senior Staff Upgrading (CAPES) for the inancial support during this research (Project PE 030/2008).
REFERENCES
1. Chan CW, Dallaire M. Subjective pain sensation is linearly correlated with the lexion relex in man. Brain Res 1989;479(1):145-50.
2. Sousa FA. Pain: the ifth vital sign. Rev Lat Am Enfermagem 2002;10(3):446-7.
3. Averbuch M, Katzper M. Baseline pain and response to analgesic medications in the post surgery dental pain model. J Clin Pharmacol 2000;40(2):133-7.
4. Hlers SJ, van Gulik L, van der Veen AM, et al. Com-parison of different pain scoring systems in critically ill patients in a general ICU. Crit Care 2008;12(1) R15.
5. Bottega FH, Fontana RT. A dor como o quinto sin-al vitsin-al: utilização da escsin-ala de avsin-aliação por enfer-meiros de um hospital geral. Texto & Contexto Enfer-magem 2010;19(2):283-90.
6. Lee JS. Pain measurement: understanding existing tools and their application in the emergency depart-ment. Emerg Med 2001;13(3):279-87.
7. Minetto MA, Botter A, Ravenni R, et al. Reliability of a novel neurostimulation method to study involuntary muscle phenomena. Muscle Nerve 2008;37(1):90-100. 8. Avila MA, Brasileiro JS. Electrical stimulation and isokinetic training: effects on strength and neuro-muscular properties of healthy young adults. Rev Bras Fisioter 2009;12(6):435-40.
9. Liebano RE, Alves LM. Comparação do índice de desconforto sensorial durante a estimulação elétrica neuromuscular com correntes excitomotoras de baixa e média frequência em mulheres saudáveis. Rev Bras Med Esporte 2009;15(1):50-3.
10. Farina D, Arendt-Nielsen L, Graven-Nielsen T. Experimental muscle pain decreases voluntary EMG activity but does not affect the muscle potential evoked by transcutaneous electrical stimulation. Clin Neurophysiol 2005;116(7):1558-65.
11. Merletti R, Knalitz M, Deluca CJ. Electrically evoked myoelectric signals. Crit Rev Biomed Eng 1992;19(4):293-340.
parameters and pain
13. Hurley RW, Adams MC. Sex, gender, and pain: an overview of a complex ield. Anesth Analg 2008;107(1):309-17.
14. Vieira Filho AHG, Teng CT, Artes R. Escalas de avaliação de transtorno pré-menstrual. Rev Psiquiatr Clín 1998;25(5):273-8.
15. Allen SS, McBride CM, Pirie PL. The short-ened premenstrual assessment form. J Reprod Med 1991;36(11):769-72.
Presented in August 08, 2011.