Trends in healthy life expectancy
among older Brazilian women
between 1998 and 2008
Tendências da expectativa de vida
saudável de idosas brasileiras,
1998-2008
I Programa de Pós-Graduação em Demografia. Centro de Desenvolvimento e Planejamento Regional. Faculdade de Ciências Econômicas. Universidade Federal de Minas Gerais. Belo Horizonte, MG, Brasil II Departamento de Demografia. Centro de
Desenvolvimento e Planejamento Regional. Faculdade de Ciências Econômicas. Universidade Federal de Minas Gerais. Belo Horizonte, MG, Brasil
Correspondence:
Marília Regina Nepomuceno Cedeplar – FACE – UFMG
Av. Antônio Carlos, 6627 Belo Horizonte 31270-901 Belo Horizonte, MG, Brasil E-mail: [email protected] Received: 3/27/2014 Approved: 6/28/2014
Article available from: www.scielo.br/rsp
ABSTRACT
OBJECTIVE: To analyze conditional and unconditional healthy life expectancy among older Brazilian women.
METHODS: This cross-sectional study used the intercensal technique to estimate, in the absence of longitudinal data, healthy life expectancy that is conditional and unconditional on the individual’s current health status. The data used were obtained from the Pesquisa Nacional por Amostra de
Domicílios (National Household Sample Survey) of 1998, 2003, and 2008.
This sample comprised 11,171; 13,694; and 16,259 women aged 65 years or more, respectively. Complete mortality tables from the Brazilian Institute of Geography and Statistics for the years 2001 and 2006 were also used.
The deinition of health status was based on the dificulty in performing
activities of daily living.
RESULTS: The remaining lifetime was strongly dependent on the current health status of the older women. Between 1998 and 2003, the amount of time lived with disability for healthy women at age 65 was 9.8%. This percentage increased to 66.2% when the women already presented some disability at age 65. Temporal analysis showed that the active life expectancy of the women at age 65 increased between 1998-2003 (19.3 years) and 2003-2008 (19.4 years). However, life years gained have been mainly focused on the unhealthy state.
CONCLUSIONS: Analysis of conditional and unconditional life expectancy indicated that live years gained are a result of the decline of mortality in unhealthy states. This pattern suggests that there has been no reduction in morbidity among older women in Brazil between 1998 and 2008.
DESCRIPTORS: Women. Life Style. Health Behavior. Quality of Life.
Sickness Impact Proile. Active Life Expectancy.
Marília Regina NepomucenoI
The increase in longevity has led to growing concerns with the quality of life. Together with the extended human life span, quality of life in later ages with autonomy and independence is expected.10,21 However, health deterio-ration in later life increases healthcare spending, espe-cially the costs related to long-term care.15,24
One of the most used indicators to estimate the distribu-tion of time that one expect to live between healthy and unhealthy statuses is the healthy life expectancy (HLE). The HLE is easy to understand and considers both the quality and quantity of years lived.13 This is a cumula-tive measure that summarizes the combined effect of different levels of mortality and morbidity that individ-uals were exposed to throughout life.8 Thereby it indi-cates the general state of health in older individuals.22
Comparisons between trends in HLE and total life expectancy lead us to understand whether the increase in longevity is followed by a similarly increased in healthy lifetime. At least three theories relate to this
issue. The irst, proposed by Gruenberg,11 is known as failures of success or expansion of morbidity. This
RESUMO
OBJETIVO: Analisar a expectativa de vida saudável condicional e não condicional de idosas brasileiras.
MÉTODOS: Estudo transversal, utilizando a técnica intercensitária, para estimar, na ausência de dados longitudinais, a expectativa de vida saudável não condicional e condicional ao estado de saúde corrente do indivíduo. Os dados utilizados foram obtidos da Pesquisa Nacional por Amostra de Domicílios de 1998, 2003 e 2008, cuja amostra foi composta, respectivamente, por 11.171, 13.694 e 16.259 mulheres com idade igual ou superior a 65 anos. Foram utilizadas, também, tábuas completas de mortalidade do Instituto Brasileiro de
Geograia e Estatística, para os anos de 2001 e 2006. A deinição dos estados de saúde baseou-se na diiculdade em realizar as atividades de vida diária.
RESULTADOS: O tempo de vida remanescente apresentou forte dependência com o
estado de saúde corrente das idosas. No período 1998-2003, a proporção do tempo a
ser vivido com incapacidade por mulheres saudáveis aos 65 anos era de 9,8%. Esse percentual aumentou para 66,2% quando as mulheres aos 65 anos já apresentavam alguma incapacidade. A análise temporal mostrou que a expectativa de vida ativa das mulheres aos 65 anos aumentou entre 1998-2003 (19,3 anos) e 2003-2008 (19,4 anos). No entanto, ganhos de vida se concentraram, sobretudo, no estado não saudável.
CONCLUSÕES: A análise da expectativa de vida condicional e não
condicional indica concentração dos ganhos de vida, provenientes do declínio
da mortalidade, em estados não saudáveis. Esse padrão sugere que não houve
redução da morbidade entre as idosas brasileiras entre 1998 e 2008.
DESCRITORES: Mulheres. Estilo de Vida. Comportamentos Saudáveis. Qualidade de Vida. Peril de Impacto da Doença. Expectativa de Vida Ativa.
INTRODUCTION
In Brazil, several studies3-6,23,a estimated HLE of older individuals for different periods and according to
different deinitions for state of health. The results suggest signiicant differences for sex and age, in addi -tion to showing that approximately 20.0% of total life expectancy is lived with severe functional limitation.3,a Studies that examined the trend of HLE indicated that the time lived free of functional limitation increased between 1998 and 2003; however, these results differ in relation to the magnitude of this effect.12,a
Although Brazil has a tradition of cross-sectional data collection through numerous household surveys, existing longitudinal health studies such as
Projeto Bambuí19 and Projeto Saúde, Bem-estar e
Envelhecimentob do not have samples that are
nation-ally representative. This complicates the calculation of HLE for the Brazilian population as a whole, from the transitions observed between the health states during the life cycle. Because of the absence of this information, there is a dearth of estimates of healthy life expectancy to individuals in a given health state at a given age. In
this article, we aim to ill this gap by applying Guillot
& Yu’s intercensal technique.13 It permits the estima-tion of condiestima-tional HLE based on cross-secestima-tional data. This is possible because the technique is based on the multistate approach, which relates the proportion of healthy individuals in two successive cross-sectional
surveys, in terms of transition functions deined a priori
based on alternative data sources. We also discuss the process of compression of morbidity using estimates of conditional and unconditional HLE.
A recurring issue in the debate about morbidity
scenarios is how to deine health states. Different
concepts based on the presence of diseases, functional limitation, disability, or self-rated health25 may lead to differing morbidity scenarios. In this article, the states
of health were deined based on the ability to perform
activities of daily living (ADL). Individuals unable to perform these activities were considered to have serious levels of functional limitation. Therefore, this indicator is associated with health deterioration and mortality in older individuals.1
Consequently, the objective of this study was to analyze conditional and unconditional HLE among older Brazilian women.
METHODS
This cross-sectional study used data obtained from the
Pesquisa Nacional por Amostra de Domicílios (PNAD
– National Household Sample Survey) from 1998,c 2003,d and 2008.e The sample of this survey comprised 11,171; 13,694; and 16,259 women aged 65 years or more, respectively. Because of the small size of the sample of men in later ages, we opted to analyze only women in order to avoid compromising the quality of the estimates.
To deine the state of health, we used the question: “Do
you normally have dificulty eating, bathing, or going
to the bathroom as a result of health problems?”. This question evaluates functional limitation based on three of the six tasks of the ADL index developed by Katz et al.16 From this information, we deine two health states.
Women who responded that they “cannot” or “have great dificulty” performing the tasks were considered “disabled”, and women who declared that they “have no dificulty” or “have little dificulty” performing the
tasks were considered healthy and were therefore
classi-ied as “active”. As a result, the unhealthy category was
restricted to women who reported to have severe levels of disability. Women who reported little limitations performing the three activities were considered healthy.
To estimate HLE and combine health and mortality data, we used the probabilities of death from the complete female mortality tables created by IBGE for the years 2001f and 2006g as a means of capturing the average mortality during the two periods studied (1998-2003 and 2003-2008). Because the probabilities
of death in the oficial IBGE tablesf,g are limited to age 80, we used the mortality relational model proposed by Himes et al14 to estimate the probabilities of death until the age of 95.
To estimate conditional and unconditional HLE among
women aged 65-95 by ive-year age groups, we used the
a Camargos MCS, Machado CJ, Rodrigues RN. Expectativa de vida livre de incapacidade funcional para idosos: um estudo comparativo para o Brasil, grandes regiões e unidades da federação, 1998 e 2003. Anais do 16º Encontro da Associação Brasileira de Estudos Populacionais; 2008 29 set a 3 out; Caxambu (MG): Associação Brasileira de Estudos Populacionais; 2008.
b Lebrão ML, Yeda AOD. SABE – Saúde, Bem-estar e Envelhecimento – O Projeto Sabe no município de São Paulo: uma abordagem inicial. Brasília (DF): Organização Pan-Americana de Saúde; 2003.
c Instituto Brasileiro de Geografia e Estatística. Acesso e utilização dos serviços de saúde 1998. Brasília (DF); 2000 [cited 2011 Nov 20]. Available from: http://www.ibge.gov.br/home/estatistica/populacao/trabalhoerendimento/pnad98/saude/saude.pdf
d Instituto Brasileiro de Geografia e Estatística. Acesso e utilização dos serviços de saúde 2003. Brasília (DF); 2005 [cited 2011 Nov 20]. Available from: http://www.ibge.gov.br/home/estatistica/populacao/trabalhoerendimento/pnad2003/saude/saude2003.pdf
e Instituto Brasileiro de Geografia e Estatística. Um Panorama da Saúde no Brasil: acesso e utilização dos serviços, condições de saúde e fatores de risco e proteção à saúde 2008. Brasília (DF); 2008 [cited 2011 Nov 20]. Available from: http://www.ibge.gov.br/home/estatistica/ populacao/panorama_saude_brasil_2003_2008/defaulttabzip_2008.shtm
f Instituto Brasileiro de Geografia e Estatística. Tábuas completas de Mortalidade 2001. Brasília (DF); 2001 [cited 2011 Nov 20]. Available from: ftp://ftp.ibge.gov.br/Tabuas_Completas_de_Mortalidade/Revisao2004_Tabua_Comp_Mortalidade_2001
intercensal technique developed by Guillot & Yu.13 This indirect technique is based on the multistate approach, and despite its name, it can also be applied to data from sample surveys. In order to calculate HLE, we
consid-ered age-speciic proportions of active individuals in
two consecutive cross-sectional surveys, as well as the
current age-speciic probabilities of death between the
dates of the surveys.
Because only two states of health were considered, we
estimated four sets of age-speciic transition probabil
-ities: nqx
AI (the probability that an “active” individual aged x at time t becoming “disabled” at time t+n), nqxIA
(the probability that a “disabled” individual aged x at time t becoming “active” at time t+n), nqxAM(the
prob-ability that an “active” individual aged x at time t dying between t and t+n) and nqxIM(the probability that a
“disabled” individual aged x at time t dying between
t and t+n). The technique starts from the basic equation of the intercensal approach, which expresses the propor-tion of individuals active at time t+n (Π(x+n, t+n)) in terms of the proportion of individuals who are active and of the same cohort at time t (Π(x, t)):
where nqx represents the probability of an individual aged x at time t dying between t and t+n, regardless of the health status at age x.
After some modiications to equation (1) and having deined nrxas the ratio between death probabilities for disabled and active individuals (nrx = nqxIM /
nqx IM), the
following equation is obtained:
When the data are available for k age groups, equation (2) expands to a system of k equations and 3 times k
unknowns, becoming an unsolvable system. However, the unknowns of equation (2) (nqxIA,
nqx AI e
nrx) do not vary randomly with age; on the contrary, these quan-tities correspond to health processes that have a func-tional relationship with age. If we know how the quantities nqxIA,
nqx AI e
nrx vary with age, the number of unknowns in the system of equations is reduced, and allow us solve the system using a non-linear optimiza-tion technique.
Two assumptions were required to apply the inter-censal technique. We assumed that the age pattern of the transition probabilities between the states of health (active/disabled/dead) for ages greater than or equal to 65 years was well described by an exponential func-tion. We also assumed that only one health transition occurred during each established observation period.
With these assumptions established, it was possible to produce estimates for nqxIA,
nqx AI e
nrx, which along with nqx were suficient to ind the entire set of transition probabilities consistent with the changes observed in the proportions of active individuals between t and t+n. From there, it was possible to construct multistate life tables and estimate HLE.
RESULTS
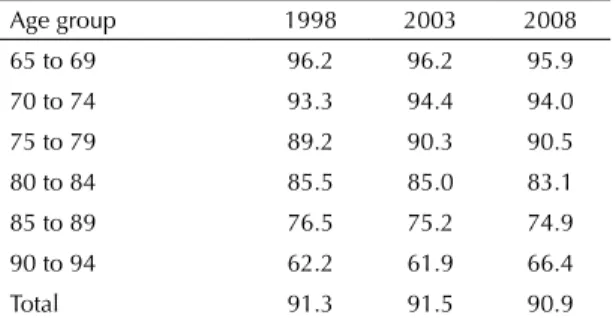
Table 1 shows the proportion of active women. This proportion decreases with age. The decline in the proportion of active women was accentuated above age 80. The total prevalence of active women increased between 1998 (91.3%) and 2003 (91.5%) and decreased in 2008 (90.9%). However, these variations were not
statistically signiicant at a level of 5% according to
the bilateral test for the difference in proportions. The
distribution of age-speciic prevalence also maintained
similar patterns in the periods examined.
The results in Table 1 were more consistent with the intercensal approach for estimating HLE employed in this study. Therefore, rather than following the rates by age in the same column (period), we should follow the diagonals in Table 1. In this way, we see
the age-speciic rates in different birth cohorts. These
results show that the reduction in the prevalence of active women by age-cohort was similar to the reduction that occurred by age-period. For example, following the cohort of women in the age group 65-69 years old in 2003, the prevalence of active women fell from 96.2% to 94.0% in 2008 (age group 70-74 years). If we compare these age groups in the same period, e.g. 2003, the reduction was from 96.2% to 94.4%.
Π(x+n, t+n) = Equation (1)
Π(x, t) · (1 - nqx AM -
nqx
AI) + [1 - Π(x, t)] · ( nqx
IA)
1 - nqx
Equation (2)
Π(x+n, t+n) - (nqxIA)
nqx AI
1 - Π(x, t)
= · -
-·
1 - nqx
Π(x, t) 1 - nqx
Π(x, t) · nqx/ (1 - nqx)
Π(x, t) + [1 - Π(x, t)] · nrx
-Π(x, t)
1 - nqx
Table 1. Proportion (%) of active older women by age. Brazil, 1998, 2003, and 2008.
Age group 1998 2003 2008 65 to 69 96.2 96.2 95.9 70 to 74 93.3 94.4 94.0
75 to 79 89.2 90.3 90.5 80 to 84 85.5 85.0 83.1 85 to 89 76.5 75.2 74.9 90 to 94 62.2 61.9 66.4
Total 91.3 91.5 90.9
Table 2 presents the transition probabilities between health states, calculated for women between 1998-2003 and 2003-2008. The probability of a disabled woman becoming active decreased with age. Between 1998 and 2003, for example, nqxIA was 0.04 at age 85-89, i.e., around 1/5 of the chance for the 65-69 age group (0.202). On the other hand, the probability of a woman becoming disabled increased with age, rising from 0.035 at 65-69 years to 0.088 at 85-89 years of age between 1998 and 2003. In addition, the probability of death for both disabled and active individuals also increased with age, following the typical pattern of the mortality function. The risk of death for a disabled individual was greater than that of an active individual. Table 2 also shows that the probability of an older woman recover from disability in the 65-69 and 70-74 age groups was greater than or similar to the probability of becoming disabled in the two periods studied.
The comparison of probability functions (Table 2) in the two periods of analysis indicated an increase in the probability of an active woman becoming disabled. Meanwhile, in the same period, the prob-ability of recover from disprob-ability also increased but to a lesser magnitude than the probability of becoming disabled. Additionally, the probabilities of death reduced for both active and disable women.
The combination of the health transitions listed in Table 2 allows the estimation of conditional HLE to different health states at a given age. Table 3 presents life expectancy at 65 and 80 years old, given the initial health state (with functional limi-tation or active) and the expected time lived with a disability or actively. The total number of years to be lived was smaller for women who already had functional limitation at a given age. Between 1998 and 2003, women with disability at age 65 expected to live 14.2 years, i.e., 5.1 fewer years than those women who were healthy at the same age (19.3 years). The dependence on initial health condition became more evident when comparing the
time lived with disability among active women with those who already had some disability. Between 1998 and 2003, the proportion of time lived with some disability was 66.2% and 92.4%, respectively, for women with disability at age 65 and at age 80. These values were significantly higher than those
for initially healthy women at these same ages: 9.8%
and 11.9% at age 65 and at age 80, respectively.
The results in Table 3 show that the life expec-tancy of active women at age 65 increased between 1998-2003 (19.3) and 2003-2008 (19.4). However, the years gained were concentraded in unhealthy state. The number of years and the proportion of time lived with disability among women who were initially healthy at age 65 rose from 9.8% (1.9 years) between 1998 and 2003 to 17.0% (3.3 years) between 2003 and 2008. On the other hand, the time lived in the active state fell from 17.4 years to 16.1 years. A similar pattern was observed among women who initially had some disability at age 65, as well as among older women at age 80.
Table 4 presents the trends of unconditional HLE among Brazilian women. Looking at the absolute values, we observed that at age 65, both total life expectancy and life expectancy with functional limitation increased during the period of study, whereas active life expectancy decreased (Table 4). Regarding the relative changes, the proportion of time lived with functional limitation at age 65 increased between 1998-2003 and 2003-2008 from 11.8% to 18.8%, whereas the proportion of time lived in a healthy state decreased from 88.2% to 81.2%. The same pattern was observed for women at age 80. The proportion of total life expectancy lived with functional limitation at age 80 increased from 20.4% to 33.2% between 1998-2003 and 2003-2008.
DISCUSSION
The results showed a strong dependence on the total time lived, as well the amount of time that one expect to live free of disability in relation to the current health
Table 2. Transition probabilities by age in older women. Brazil, 1998-2003 and 2003-2008.
Age
1998–2003 2003–2008
Disabled Active
Disabled Dead
Active Disabled
Active Dead
Disabled Active
Disabled Dead
Active Disabled
Active Dead
(nqxI A) ( nqx
I M) ( nqx
A I) ( nqx
A M) ( nqx
I A) ( nqx
I M) ( nqx
A I) ( nqx
A M)
65 0.2020 0.2358 0.0350 0.0674 0.2000 0.2263 0.0650 0.0618
state at a given age. The temporal comparison of HLE indicated expansion of morbidity among older Brazilian women between 1998 and 2008.
A limitation of this study was the non-detailed information of functional limitation to estimate the transition probabil-ities between the health states. The PNAD data combined different levels of functional limitation into a single ques-tion, which prevented the precise measurement of the true process of health deterioration in the individuals. Furthermore, PNAD did not specify the minimum dura-tion of each disability, which prevented distincdura-tion between temporary and chronic disabilities. These limitations may have contributed to the observed pattern between the prob-ability of recover from disprob-ability and the probprob-ability of becoming disabled at age groups 65-69 and 70-74. Contrary to expectations, the probability of recovery was greater than or similar to the probability of becoming disabled. To mini-mize the confounding effects from the inclusion of
tempo-rary disabilities in the deinition of health states, this study
provided estimates for women at age 80. Therefore, the esti-mates were more accurate at this age. Because of the nature of the PNAD data, it was necessary to assume that only one health transition occurred within each observation period.
This assumption was somewhat weakbecause the
ive-years period between each survey was long and therefore, individuals could be subjected to more than one transition,
mainly in the irst age groups (60-64 years, 65-69 years,
70-74 years), when the chances of recovery were higher.
To estimate HLE, the technique used in this study incor-porated the dynamic process between health states at two points in time. This makes it the most appropriate method-ological alternative for time trend analysis, compared with the Sullivan method,26 which is widely used in Brazilian literature. Another advantage is the non-assumption of stationarity and homogeneous risks of death among health states.h Nevertheless, care should be taken in concluding that the expansion of morbidity was observed among the older Brazilian women during the decade analyzed. This is because the estimated changes in HLE between the two periods studied were subject to both sampling variability as well as the limitations of the data. One possible
solu-tion would be the calculasolu-tion of conidence intervals, but
one of the limitations of the technique was the absence of these intervals. Another limitation of the technique was the assumption of a transition pattern that were not observ-able. The assumption that the age pattern for the transition probabilities followed an exponential function was based on international literature, given that this information is not available for the whole Brazil. Studies in the United States,7,13,17,18 Mexico,i and Puerto Rico i demonstrated that for ages greater than or equal to 60, these distributions are well described by an exponential function.
h Palloni A, Guillen M, Monteverde M, Ayuso M, White R. A microsimulation model to estimate errors in cross-sectional estimates of life expectancy in disability. Philadelphia: Population Association of America Meetings; 2005.
i Gonzaga MR. Uma proposta metodológica para estimar o padrão etário das transições de incapacidade e tendências na expectativa de vida ativa dos idosos: um estudo para o Brasil entre 1998 e 2008 [thesis]. Belo Horizonte (MG): Universidade Federal de Minas Gerais; 2012. Table 4. Life expectancy in older women. Brazil, 1998-2003 and 2003-2008.
Period Exact age (x)
Life expectancy (years)* Percentage of life expectancy
Total Active Disabled Active Disabled
1998 to 2003 65 19.0 16.8 2.3 88.2 11.8
80 9.0 7.2 1.8 79.6 20.4
2003 to 2008 65 19.2 15.6 3.6 81.2 18.8
80 9.1 6.1 3.0 66.8 33.2
Source: IBGE-PNAD of 1998d, 2003e, and 2008f and Complete female morbidity tables for 2001g and 2006h.
* The life expectancies presented here represent the expected number of years to be lived between the exact ages x and 95 years. Table 3. Conditional life expectancy (nex) by age in older women. Brazil, 1998-2003 and 2003-2008.
Period Exact age (x) n Life expectancy (nex)*
I II IA A AA AI
1998 to 2003 65 30 14.2 9.4 4.8 19.3 17.4 1.9
80 15 7.9 7.3 0.7 9.2 8.1 1.1
2003 to 2008 65 30 14.4 9.9 4.6 19.4 16.1 3.3
80 15 8.0 7.2 0.7 9.3 7.5 1.9
Source: IBGE-PNAD of 1998c, 2003d, and 2008e and Complete female morbidity tables for 2001f and 2006g. I: life expectancy conditional on disabled state; II: disabled life expectancy conditional on disabled state; IA: active life expectancy conditional on disabled state; A: life expectancy conditional on active state; AA: active life expectancy conditional on active state; AI: disabled life expectancy conditional on active state.
Previous studies12,b that also analyzed temporal trends in HLE for Brazil between 1998 and 2003 indicated a slight increase in the proportion of time lived without functional limitation. These results are also subject to sampling variability, besides the fact that they do not capture changes between cohorts and ignore the
transi-tions between health states. Dificulty in assessing the
process of compression and expansion of morbidiy in Brazil based on cross-sectional data indicates a need for nationwide longitudinal health studies.
This present study showed the importance of current health status in older individuals for their remaining lifespan. Because health is a cumulative process in the life cycle, the conditional results pointed to the need for direct and indirect health interven-tions from the early stages of life. Such measures could increase the proportion of individuals who reach more advanced ages free of disability, which generally ensures a longer lifespan and better quality of life.
1. Agree ME. The influence of personal care and assistive devices on the measurement of disability. Soc Sci Med. 1999;48(4):427-43. DOI:10.1016/S0277-9536(98)00369-4
2. Camarano AA. Cuidados de longa duração para população idosa. Família ou instituição de longa permanência? Rev Sinais Soc. 2008;3(7):10-39.
3. Camargos MCS, Perpetuo IHO, Machado CM. Expectativa de vida com incapacidade funcional em idosos em São Paulo, Brasil. Rev Panam Salud Publica. 2005;17(5/6):379-86. DOI:10.1590/S1020-49892005000500010
4. Camargos MCS, Machado CJ, Rodrigues RN. Disability life expectancy for the elderly, city of São Paulo, Brazil, 2000: gender and educational differences. J Biosoc Sci. 2006;39(3):455-63. DOI:10.1017/S0021932006001428
5. Camargos MCS, Machado CJ, Rodrigues RN. Sex differences in healthy life expectancy from self-perceived assessments of health in the City of São Paulo, Brazil. Ageing Soc. 2008;28(1):35-48. DOI:10.1017/S0144686X07006277
6. Camargos MCS, Rodrigues RN, Machado CJ. Expectativa de vida saudável para idosos brasileiros, 2003. Cienc Saude Coletiva. 2009;14(5):1903-9. DOI:10.1590/S1413-81232009000500032
7. Crimmins EM, Hayward MD, Saito Y. Changing mortality and morbidity rates and the health status and life expectancy of the older population. Demography. 1994;31(1):159-75. DOI:10.2307/2061913
8. Crimmins EM, Saito Y. Trends in healthy life expectancy in the United States, 1970-1990: gender, racial, and educational differences. Soc Sci Med. 2001;52(11):1629-41. DOI:10.1016/S0277-9536(00)00273-2
9. Fries JF. Aging, natural death, and the compression of morbidity. N Engl J Med. 1980;303(3):130-5. DOI:10.1056/NEJM198007173030304
10. Fries JF. Measuring and monitoring success in compressing morbidity. Ann Intern Med. 2003;139(5 Pt 2):455-9. DOI:10.7326/0003-4819-139-5_Part_2-200309021-00015
11. Gruenberg EM. The Failures of Success. Milbank Q. 1977;83(4):779-80. DOI:10.1111/j.1468-0009.2005.00400.x
12. Guedes RG, Camargos MCS, Siviero PCL, Machado CJ, Oliveira DR. Educational and sex diferences in the funcional disability life expectancy of the elderly: Brazil 1998 and 2003. Cad Saude Coletiva. 2011;19(2):187-96.
13. Guillot M, Yu Y. Estimating health expectancies from two cross-sectional surveys: the intercensal method. Demogr Res. 2009;21(17):503-34. DOI:10.4054/DemRes.2009.21.17
14. Himes CL, Preston SH, Condran GA. A relational model of mortality at older ages in low mortality countries. Popul Stud. 1994;48(2):269-91. DOI:10.1080/0032472031000147796
15. Jacobzone S. Ageing and care for frail elderly persons: an overview of international perspectives. OECD. 1999;20:1-50. DOI:10.1787/313777154147
16. Katz S, Ford AB, Moskowitz RW, Jackson BA, Jaffe MW. Studies of illness in the aged. The index of ADL: a standardized measure of biological and psychosocial function. JAMA. 1963;185(12):914-19. DOI:10.1001/jama.1963.03060120024016
17. Laditka SB, Wolf DA. New methods for analyzing active life expectancy. J Aging Health. 1998;10(2):214-41. DOI:10.1177/089826439801000206
18. Lièvre A, Brouard N. The estimation of heath expectancies from cross- longitudinal surveys. Math Popul Stud. 2003;10:211-48. DOI:10.1080/713644739
19. Lima-Costa MF, Uchoa E, Guerra HL, Firmo JOA, Vidigal PG, Barreto SM. The Bambuí health and ageing study (BHAS): methodological approach and preliminary results of a population-based cohort study of the elderly in Brazil. Rev Saude Publica. 2000;34(2):126-35. DOI:10.1590/S0034-89102000000200005
20. Manton KG. Changing concepts of morbidity and mortality in the elderly population. Milbank Mem Fund Q Health Soc.1982;60(2):183-244. DOI:10.2307/3349767
21. Moraes EN, Moraes FL, Lima SPP. Características biológicas e psicológicas do envelhecimento. Rev Med Minas Gerais. 2010;20(1):67-73.
23. Romero DE, Leite IC, Szwarcwald CL. Expectativa de vida saudável no Brasil: uma aplicação do método de Sullivan. Cad Saude Publica. 2005;21 Suppl 1:7-18. DOI:10.1590/S0102-311X2005000700002
24. Schoen R. Modeling Multigroup Populations. New York: Plenum Press; 1988. The multistate life table; p. 63-105.
25. Sermet C, Cambois E. Measuring the state of health. In: Caselli G, Vallin J, Wunsch G. Demography: analysis and synthesis. Burlington: Academic Press, 2006. v.2, p. 13-27.
26. Sullivan DF, A single index of mortality and morbidity. HSMHA Health Reports. 1971:86(4):347-54