Quality of life in adults from a rural area
in Southern Brazil: a population-based
study
Caroline Cardozo BortolottoI, Christian Loret de MolaII, Luciana Tovo-RodriguesI
I Universidade Federal de Pelotas. Faculdade de Medicina. Programa de Pós-Graduação em Epidemiologia. Pelotas, RS, Brasil
II Universidade Federal de Pelotas. Faculdade de Enfermagem. Pelotas, RS, Brasil
ABSTRACT
OBJECTIVE: To analyze the quality of life and its determinants in a population living in a rural area.
METHODS: This is a population-based, cross-sectional study with individuals aged 18 years or over from the rural area of Pelotas, State of Rio Grande do Sul, Brazil. We evaluated quality of life using the WHOQOL-BREF, which has four domains (physical, psychological, social relations, and environment) and two questions: overall quality of life and satisfaction with health. We considered as independent variables the demographic, socioeconomic, and health variables. We evaluated the associations using linear regression in the four domains and ordinal logistic regression in the two general questions on quality of life and satisfaction with health.
RESULTS: The sample consisted of 1,479 individuals. The prevalence of the perception of overall very poor quality of life and dissatisfaction with health were 22.5% and 26.3%, respectively. Individuals who were older (p < 0.001), non-white (p = 0.004), with lower education level (p < 0.001), poorer (p = 0.001), and who had always lived in the rural area (p = 0.049) were less likely to have a better perception of overall quality of life. As for satisfaction with health, women (p = 0.001), older individuals (p = 0.001), those unemployed (p = 0.023), and those with diseases were less likely to report higher satisfaction with health. For the four domains evaluated, the results were consistent with those observed for the general questions.
CONCLUSIONS: The most relevant aspects that negatively defined the quality of life of the population were being a woman, older, non-white, having a low income, having a lower education level, having always lived in the rural area, being unemployed, and having a disease. Given that they are significant factors as determinants of health, these results suggest that quality of life is an issue that should be placed among health needs, especially regarding the most vulnerable groups in rural areas.
DESCRIPTORS: Adult. Quality of Life. Socioeconomic Factors. Gender and Health. Rural Population.
Correspondence:
Caroline Cardozo Bortolotto Rua Marechal Deodoro, 1160 3º piso Centro
Caixa Postal 464
96020-220 Pelotas, RS, Brasil E-mail: [email protected]
Received: May 31, 2017
Approved: Dec 21, 2017
How to cite: Bortolotto CC, Loret de Mola C, Tovo-Rodrigues L. Quality of life in adults from a rural area in Southern Brazil: a population-based study. Rev Saude Publica. 2018;52 Suppl 1:4s.
Copyright: This is an open-access article distributed under the terms of the Creative Commons Attribution License, which permits unrestricted use, distribution, and reproduction in any medium, provided that the original author and source are credited.
INTRODUCTION
Quality of life (QOL) covers the aspects of physical and mental health, social relationships, and personal beliefs, as well as environmental characteristics1. In addition, it has been
growing in importance in the evaluation of therapeutic interventions and services and in the daily health care practices in the health area2.
Brazilian rural populations are different from urban populations in a series of factors that influence quality of life, such as demographic and socioeconomic aspects, with lower education level3 and monthly average income4. Regarding health indicators, the results in
the literature are contradictory5–8. However, the lower access to health services is reported
consistently, and the low coverage by health plans has already been described in these
regions6,8. Furthermore, differences related to the physical and social environments, such as
air quality, noise pollution, and lifestyle have been highlighted in the literature9. Specifically
in Brazil, the National Health Survey (PNS) has indicated that the prevalence of smoking and physical activity at work are higher in rural than in urban inhabitants6. It has also verified
that exposure to pesticides reaches a significant portion of the population7. In addition,
there is considerable data on the mental health of rural residents where the frequency of self-reported depression is approximately 6% and more prevalent in women6.
In 2010, approximately 15% of the Brazilian population lived in rural areas, which is similar to the amount described for the state of Rio Grande do Sul at the time10. However, knowledge
about the health and QOL aspects of this considerable portion of the population is scarce. The objective of this study was to characterize the QOL and factors that may be associated with the health of an adult population living in a rural area of Southern Brazil.
METHODS
This population-based, cross-sectional study is part of a larger study named “Evaluation of the Health of Adults Living in the Rural Area of the City of Pelotas, State of Rio Grande do Sul, Brazil” (“Avaliação da Saúde de Adultos Residentes na Zona Rural do Município de Pelotas, RS”), carried out between January and July 2016. We evaluated a representative
sample of the adult population (aged 18 years or over) living in the rural area of the city of Pelotas, State of Rio Grande do Sul, Brazil. This region has eight districts and 50 census tracts and comprises 7% of the population of the city11.
We used a multistage cluster sampling. A total of 24 census tracts were drawn systematically, proportional to the number of permanent households in each district. In total, 720 households were visited (30 per tract). Individuals institutionalized at the time of the research or if they had some cognitive impairment that made them unable to answer the questionnaire were excluded from the sample. More details on the methodology can be obtained in the methodological article12.
The QOL was evaluated with the WHOQOL-BREF instrument1. This instrument has 26
questions and two of them separately evaluate overall QOL and satisfaction with health. The remaining 24 questions encompass four domains: physical (pain and discomfort, energy and fatigue, sleep and rest, mobility, activities of daily living, dependence on medication or treatments, and ability to work), psychological (positive feelings, thinking, learning, memory, and concentration, self-esteem, body image and appearances, negative feelings, spirituality, religiosity, and personal beliefs), social relations (personal relationships, social support, and sexual activity), and environment [physical security and protection, home environment, financial resources, health and social care, availability and quality, opportunity to acquire new information and skills, participation in recreation or leisure opportunities, physical environment (pollution, noise, traffic, climate), transport]. These questions represent each of the 24 aspects that make up the original instrument (WHOQOL-100)13. We used the period
one of the domains on a scale from one to 100, according to the protocol suggested by the WHOQOL Group13. For the analyses, we grouped the original five categories of responses
into three: very good; good; fair, poor, or very poor for the perception of overall QOL, and very satisfied; satisfied; fair, dissatisfied, or very dissatisfied for the perception of health. We evaluated the association between determinant variables and outcomes based on a hierarchical conceptual model with four levels. At the first level, we included the following variables: sex (male, female), age (18 to 24, 25 to 39, 40 to 59, 60 years or over), and self-reported race (white, non-white); in the second level, we used: education level (zero to four, five to eight, nine to eleven, twelve or more years of study), index of goods (quintiles), employment (no, yes), and number of residents (of any age group) of the domicile (one, two, three, four, five or more); in the third level, we used: living with a partner (no, yes) and percentage of time living in the rural area (less than 50%, between 50 and 99%, 100%). At the fourth level, we included the variables of self-reported diagnosis of:)high blood pressure (HBP), diabetes, high cholesterol, cardiovascular diseases (heart failure or angina), and respiratory (asthma or bronchitis) and rheumatic diseases (arthritis, rheumatism, or osteoarthritis) (yes, no). We obtained the index of goods from the principal component analysis containing 22 questions asked to the head of the family, who evaluated the amount of goods in the household at the time: piped water, vacuum cleaner, washing machine, dryer, dishwasher, DVD, VCR, refrigerator, microwave, computer (notebook or netbook), television, radio, air conditioner, cable TV or internet, car or motorcycle. Furthermore, it also contained the number of toilets/bathrooms, number of rooms used to sleep, and whether they employed a domestic worker. This variable of index of goods was analyzed in quintiles, ranging from the poorest quintile (1st) to the richest quintile (5th).
We used the survey (svy) command in all analyses, considering the effect of cluster sampling.
In addition, we used a weighting considering the percentage of households sampled in relation to the number of permanent households of each district according to IBGE data11.
For the four domains of QOL, we performed the crude and adjusted analyses by linear regression. We presented the average score (crude), the adjusted coefficients (β) and the 95% confidence interval (95%CI). For both questions of overall QOL and satisfaction with health, we performed the crude and adjusted analyses by ordinal logistic regression, obtaining estimates of odds ratio (OR) and 95%CI. For these analyses, we obtained estimates of the probability of going from one category of perception of QOL and satisfaction with health to the subsequent category, considering the directionality from the best to the worst category of response in all cases. We used the Brant test to evaluate the assumption of proportionality of the OR among the categories of outcome. We performed adjusted analyses according to the conceptual hierarchical level model, in which the variables were adjusted for all variables of the same level, as well as for those of the previous level in the model. This method was repeated for the other levels. We considered the level of statistical significance of 0.05 for associations between variables and outcomes. We calculated the Kappa value based on the question “Do you know how to read or write?”, indicating 76% of repeatability.
The project was approved by the Research Ethics Committee of the Faculdade de Medicina of the Universidade Federal de Pelotas (Process 1.363.979). All research participants signed an informed consent.
RESULTS
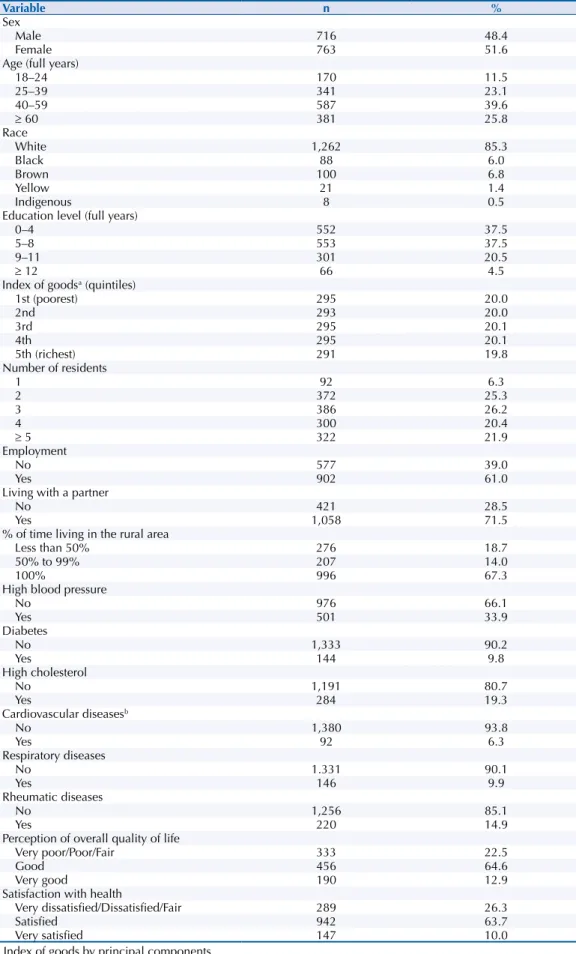
were high cholesterol and rheumatic diseases, 14.9% and 19.3%, respectively. Regarding the perception of overall QOL and health, 22.5% reported fair, poor, or very poor QOL and 26.3% were dissatisfied with their health (Table 1).
Table 1. Characterization of the sample according to socioeconomic, demographic, and behavioral characteristics. Pelotas, State of Rio Grande do Sul, Brazil, 2016. (n = 1,479)
Variable n %
Sex
Male 716 48.4
Female 763 51.6
Age (full years)
18–24 170 11.5
25–39 341 23.1
40–59 587 39.6
≥ 60 381 25.8
Race
White 1,262 85.3
Black 88 6.0
Brown 100 6.8
Yellow 21 1.4
Indigenous 8 0.5
Education level (full years)
0–4 552 37.5
5–8 553 37.5
9–11 301 20.5
≥ 12 66 4.5
Index of goodsa (quintiles)
1st (poorest) 295 20.0
2nd 293 20.0
3rd 295 20.1
4th 295 20.1
5th (richest) 291 19.8
Number of residents
1 92 6.3
2 372 25.3
3 386 26.2
4 300 20.4
≥ 5 322 21.9
Employment
No 577 39.0
Yes 902 61.0
Living with a partner
No 421 28.5
Yes 1,058 71.5
% of time living in the rural area
Less than 50% 276 18.7
50% to 99% 207 14.0
100% 996 67.3
High blood pressure
No 976 66.1
Yes 501 33.9
Diabetes
No 1,333 90.2
Yes 144 9.8
High cholesterol
No 1,191 80.7
Yes 284 19.3
Cardiovascular diseasesb
No 1,380 93.8
Yes 92 6.3
Respiratory diseases
No 1.331 90.1
Yes 146 9.9
Rheumatic diseases
No 1,256 85.1
Yes 220 14.9
Perception of overall quality of life
Very poor/Poor/Fair 333 22.5
Good 456 64.6
Very good 190 12.9
Satisfaction with health
Very dissatisfied/Dissatisfied/Fair 289 26.3
Satisfied 942 63.7
Very satisfied 147 10.0
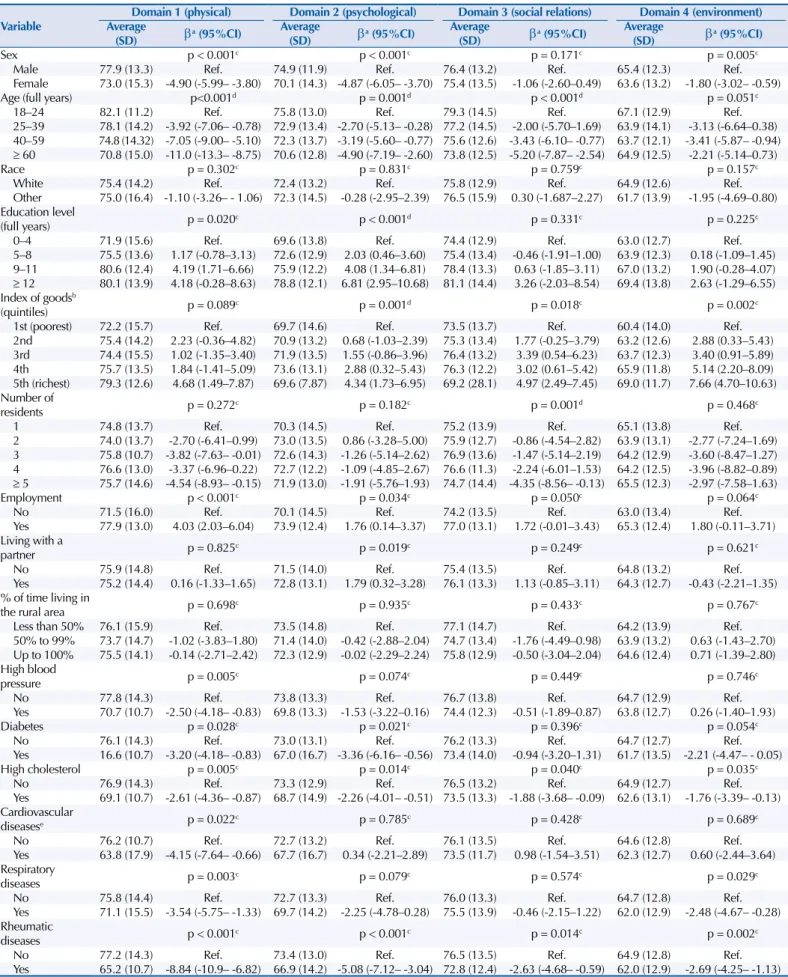
Table 2 presents the estimates of association between the independent variables and the four domains of QOL evaluated based on the hierarchical theoretical model. For the physical domain, women presented, on average, approximately five points less for QOL than men. As the age group increased, we observed a linear trend of worse QOL in this domain (p < 0.001), so that individuals aged 60 years or over presented, on average, 11.0 points less than younger individuals. Individuals with lower education level (zero to four years, five to eight years) reported worse QOL than those with nine to eleven years and twelve years or more. As for the index of goods, the poorest quintile also presented a significant difference in relation to the richest quintile. Finally, employed individuals had, on average, 4.0 points more of QOL than those not employed. All diseases assessed were associated with lower QOL scores in the physical domain. Rheumatic diseases had the worst average score (95%CI -10.9– -6.82). Regarding the psychological domain, women reported, on average, 5.0 points less than men. Regarding age, we observed worse QOL with increasing age (p = 0.001). Older individuals had 4.9 points less for QOL than younger persons. As for education level, there was an improvement in QOL with increasing study years (p < 0.001). Individuals with a lower education level had, on average, 7.9 points less for QOL than those with a higher education level. As for index of goods, the poorest quintile presented, on average, 3.6 points less for QOL than the richest quintile. Being employed (p = 0.034) and living with a partner (p = 0.019) were associated with the highest average QOL. Individuals who reported having diabetes, high cholesterol, or rheumatic diseases had worse QOL averages than the reference groups (Table 2).
For the domain of social relations, we observed a linear trend of worse QOL averages with increasing age (p < 0.001). Older adults presented, on average, 5.2 points less than younger individuals. In relation to the index of goods, the poorest quintile had a lower QOL score than the richest quintile (Table 2). As the number of residents per household increased, the average QOL scores were worse (p = 0.001). The individuals who were employed at the time of the interview reported, on average, 1.7 points more than their reference category (p = 0.050). In relation to diseases, having high cholesterol or rheumatic diseases were associated with worse QOL scores (Table 2).
For the environmental domain, women had, on average, 1.8 points less than men. In relation to age, only the category between 40 and 59 years showed a statistically significant decrease in QOL points compared to younger individuals. The richest quintile had a better QOL than the poorest quintile (7.7 points on average). The presence of high cholesterol and respiratory and rheumatic diseases was associated with worse QOL scores. Rheumatic diseases again had the worst score (95%CI -4.67– -0.28).
The variables of race and the percentage of time living in the rural area were not associated with any of the four domains.
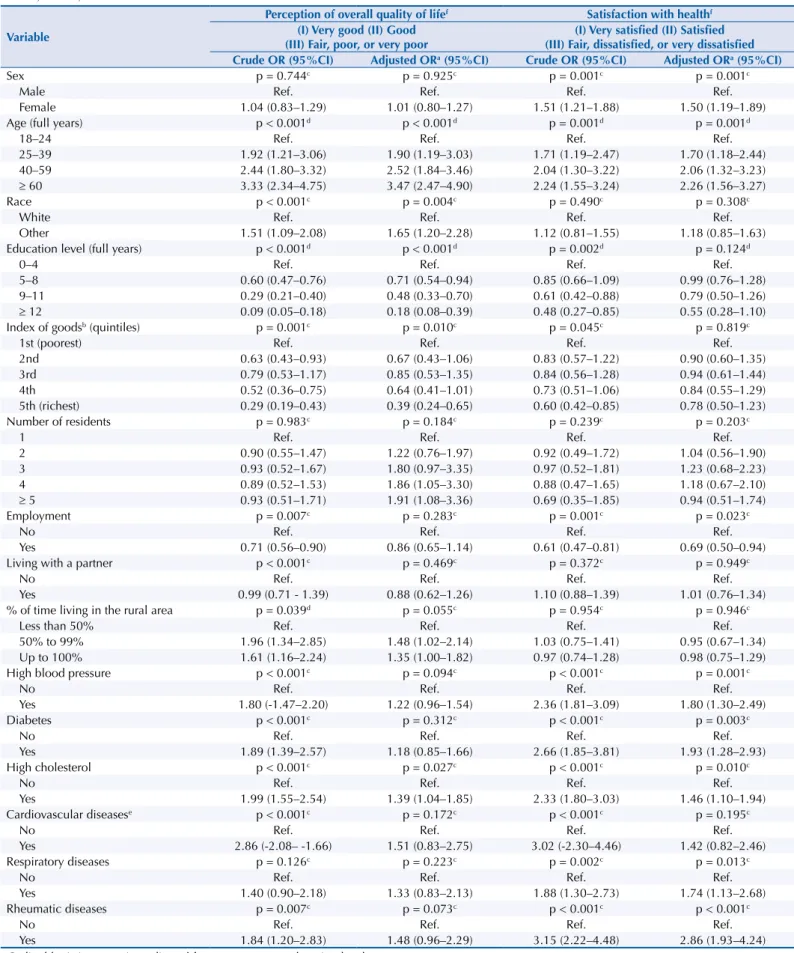
Considering the two general questions (Table 3), we observed that, as age increased, the chances of having worse QOL (going from very good to good and from good to fair, poor, or very poor) also increased (p = 0.001). Non-white individuals were 1.7 times more likely to report categories of worse QOL (95%CI 1.20–2.28). In addition, we observed greater protection for the reporting of worse QOL in the richest quintiles and in the higher education levels. For the individuals who lived their entire lives in the rural area, the chance of reporting a worse perception of overall QOL was 35% higher than for those who lived less than half of their lives (p = 0.049). In the presence of diseases, the chance of having a worse QOL was higher among individuals with high cholesterol (95%CI 1.04–1.85).
Table 2. Average quality of life scores and their coefficients (β) adjusted according to the socioeconomic, demographic, and behavioral variables. Pelotas, State of Rio Grande do Sul, Brazil, 2016.
Variable
Domain 1 (physical) Domain 2 (psychological) Domain 3 (social relations) Domain 4 (environment) Average
(SD) βa (95%CI)
Average
(SD) βa (95%CI)
Average
(SD) βa (95%CI)
Average
(SD) βa (95%CI)
Sex p < 0.001c p < 0.001c p = 0.171c p = 0.005c
Male 77.9 (13.3) Ref. 74.9 (11.9) Ref. 76.4 (13.2) Ref. 65.4 (12.3) Ref.
Female 73.0 (15.3) -4.90 (-5.99– -3.80) 70.1 (14.3) -4.87 (-6.05– -3.70) 75.4 (13.5) -1.06 (-2.60–0.49) 63.6 (13.2) -1.80 (-3.02– -0.59)
Age (full years) p<0.001d p = 0.001d p < 0.001d p = 0.051c
18–24 82.1 (11.2) Ref. 75.8 (13.0) Ref. 79.3 (14.5) Ref. 67.1 (12.9) Ref.
25–39 78.1 (14.2) -3.92 (-7.06– -0.78) 72.9 (13.4) -2.70 (-5.13– -0.28) 77.2 (14.5) -2.00 (-5.70–1.69) 63.9 (14.1) -3.13 (-6.64–0.38) 40–59 74.8 (14.32) -7.05 (-9.00– -5.10) 72.3 (13.7) -3.19 (-5.60– -0.77) 75.6 (12.6) -3.43 (-6.10– -0.77) 63.7 (12.1) -3.41 (-5.87– -0.94)
≥ 60 70.8 (15.0) -11.0 (-13.3– -8.75) 70.6 (12.8) -4.90 (-7.19– -2.60) 73.8 (12.5) -5.20 (-7.87– -2.54) 64.9 (12.5) -2.21 (-5.14–0.73)
Race p = 0.302c p = 0.831c p = 0.759c p = 0.157c
White 75.4 (14.2) Ref. 72.4 (13.2) Ref. 75.8 (12.9) Ref. 64.9 (12.6) Ref.
Other 75.0 (16.4) -1.10 (-3.26– - 1.06) 72.3 (14.5) -0.28 (-2.95–2.39) 76.5 (15.9) 0.30 (-1.687–2.27) 61.7 (13.9) -1.95 (-4.69–0.80) Education level
(full years) p = 0.020c p < 0.001d p = 0.331c p = 0.225c
0–4 71.9 (15.6) Ref. 69.6 (13.8) Ref. 74.4 (12.9) Ref. 63.0 (12.7) Ref.
5–8 75.5 (13.6) 1.17 (-0.78–3.13) 72.6 (12.9) 2.03 (0.46–3.60) 75.4 (13.4) -0.46 (-1.91–1.00) 63.9 (12.3) 0.18 (-1.09–1.45) 9–11 80.6 (12.4) 4.19 (1.71–6.66) 75.9 (12.2) 4.08 (1.34–6.81) 78.4 (13.3) 0.63 (-1.85–3.11) 67.0 (13.2) 1.90 (-0.28–4.07)
≥ 12 80.1 (13.9) 4.18 (-0.28–8.63) 78.8 (12.1) 6.81 (2.95–10.68) 81.1 (14.4) 3.26 (-2.03–8.54) 69.4 (13.8) 2.63 (-1.29–6.55) Index of goodsb
(quintiles) p = 0.089c p = 0.001d p = 0.018c p = 0.002c
1st (poorest) 72.2 (15.7) Ref. 69.7 (14.6) Ref. 73.5 (13.7) Ref. 60.4 (14.0) Ref. 2nd 75.4 (14.2) 2.23 (-0.36–4.82) 70.9 (13.2) 0.68 (-1.03–2.39) 75.3 (13.4) 1.77 (-0.25–3.79) 63.2 (12.6) 2.88 (0.33–5.43) 3rd 74.4 (15.5) 1.02 (-1.35–3.40) 71.9 (13.5) 1.55 (-0.86–3.96) 76.4 (13.2) 3.39 (0.54–6.23) 63.7 (12.3) 3.40 (0.91–5.89) 4th 75.7 (13.5) 1.84 (-1.41–5.09) 73.6 (13.1) 2.88 (0.32–5.43) 76.3 (12.2) 3.02 (0.61–5.42) 65.9 (11.8) 5.14 (2.20–8.09) 5th (richest) 79.3 (12.6) 4.68 (1.49–7.87) 69.6 (7.87) 4.34 (1.73–6.95) 69.2 (28.1) 4.97 (2.49–7.45) 69.0 (11.7) 7.66 (4.70–10.63) Number of
residents p = 0.272c p = 0.182c p = 0.001d p = 0.468c
1 74.8 (13.7) Ref. 70.3 (14.5) Ref. 75.2 (13.9) Ref. 65.1 (13.8) Ref.
2 74.0 (13.7) -2.70 (-6.41–0.99) 73.0 (13.5) 0.86 (-3.28–5.00) 75.9 (12.7) -0.86 (-4.54–2.82) 63.9 (13.1) -2.77 (-7.24–1.69) 3 75.8 (10.7) -3.82 (-7.63– -0.01) 72.6 (14.3) -1.26 (-5.14–2.62) 76.9 (13.6) -1.47 (-5.14–2.19) 64.2 (12.9) -3.60 (-8.47–1.27) 4 76.6 (13.0) -3.37 (-6.96–0.22) 72.7 (12.2) -1.09 (-4.85–2.67) 76.6 (11.3) -2.24 (-6.01–1.53) 64.2 (12.5) -3.96 (-8.82–0.89)
≥ 5 75.7 (14.6) -4.54 (-8.93– -0.15) 71.9 (13.0) -1.91 (-5.76–1.93) 74.7 (14.4) -4.35 (-8.56– -0.13) 65.5 (12.3) -2.97 (-7.58–1.63)
Employment p < 0.001c p = 0.034c p = 0.050c p = 0.064c
No 71.5 (16.0) Ref. 70.1 (14.5) Ref. 74.2 (13.5) Ref. 63.0 (13.4) Ref.
Yes 77.9 (13.0) 4.03 (2.03–6.04) 73.9 (12.4) 1.76 (0.14–3.37) 77.0 (13.1) 1.72 (-0.01–3.43) 65.3 (12.4) 1.80 (-0.11–3.71) Living with a
partner p = 0.825c p = 0.019c p = 0.249c p = 0.621c
No 75.9 (14.8) Ref. 71.5 (14.0) Ref. 75.4 (13.5) Ref. 64.8 (13.2) Ref.
Yes 75.2 (14.4) 0.16 (-1.33–1.65) 72.8 (13.1) 1.79 (0.32–3.28) 76.1 (13.3) 1.13 (-0.85–3.11) 64.3 (12.7) -0.43 (-2.21–1.35) % of time living in
the rural area p = 0.698
c p = 0.935c p = 0.433c p = 0.767c
Less than 50% 76.1 (15.9) Ref. 73.5 (14.8) Ref. 77.1 (14.7) Ref. 64.2 (13.9) Ref. 50% to 99% 73.7 (14.7) -1.02 (-3.83–1.80) 71.4 (14.0) -0.42 (-2.88–2.04) 74.7 (13.4) -1.76 (-4.49–0.98) 63.9 (13.2) 0.63 (-1.43–2.70) Up to 100% 75.5 (14.1) -0.14 (-2.71–2.42) 72.3 (12.9) -0.02 (-2.29–2.24) 75.8 (12.9) -0.50 (-3.04–2.04) 64.6 (12.4) 0.71 (-1.39–2.80) High blood
pressure p = 0.005c p = 0.074c p = 0.449c p = 0.746c
No 77.8 (14.3) Ref. 73.8 (13.3) Ref. 76.7 (13.8) Ref. 64.7 (12.9) Ref.
Yes 70.7 (10.7) -2.50 (-4.18– -0.83) 69.8 (13.3) -1.53 (-3.22–0.16) 74.4 (12.3) -0.51 (-1.89–0.87) 63.8 (12.7) 0.26 (-1.40–1.93)
Diabetes p = 0.028c p = 0.021c p = 0.396c p = 0.054c
No 76.1 (14.3) Ref. 73.0 (13.1) Ref. 76.2 (13.3) Ref. 64.7 (12.7) Ref.
Yes 16.6 (10.7) -3.20 (-4.18– -0.83) 67.0 (16.7) -3.36 (-6.16– -0.56) 73.4 (14.0) -0.94 (-3.20–1.31) 61.7 (13.5) -2.21 (-4.47– - 0.05)
High cholesterol p = 0.005c p = 0.014c p = 0.040c p = 0.035c
No 76.9 (14.3) Ref. 73.3 (12.9) Ref. 76.5 (13.2) Ref. 64.9 (12.7) Ref.
Yes 69.1 (10.7) -2.61 (-4.36– -0.87) 68.7 (14.9) -2.26 (-4.01– -0.51) 73.5 (13.3) -1.88 (-3.68– -0.09) 62.6 (13.1) -1.76 (-3.39– -0.13) Cardiovascular
diseasese p = 0.022c p = 0.785c p = 0.428c p = 0.689c
No 76.2 (10.7) Ref. 72.7 (13.2) Ref. 76.1 (13.5) Ref. 64.6 (12.8) Ref.
Yes 63.8 (17.9) -4.15 (-7.64– -0.66) 67.7 (16.7) 0.34 (-2.21–2.89) 73.5 (11.7) 0.98 (-1.54–3.51) 62.3 (12.7) 0.60 (-2.44–3.64) Respiratory
diseases p = 0.003
c p = 0.079c p = 0.574c p = 0.029c
No 75.8 (14.4) Ref. 72.7 (13.3) Ref. 76.0 (13.3) Ref. 64.7 (12.8) Ref.
Yes 71.1 (15.5) -3.54 (-5.75– -1.33) 69.7 (14.2) -2.25 (-4.78–0.28) 75.5 (13.9) -0.46 (-2.15–1.22) 62.0 (12.9) -2.48 (-4.67– -0.28) Rheumatic
diseases p < 0.001c p < 0.001c p = 0.014c p = 0.002c
No 77.2 (14.3) Ref. 73.4 (13.0) Ref. 76.5 (13.5) Ref. 64.9 (12.8) Ref.
Yes 65.2 (10.7) -8.84 (-10.9– -6.82) 66.9 (14.2) -5.08 (-7.12– -3.04) 72.8 (12.4) -2.63 (-4.68– -0.59) 62.0 (12.9) -2.69 (-4.25– -1.13) a Multiple linear regression adjusted for sex, age, race, education level.
b Index of goods by principal components, employment, number of residents in the household, living with a partner, percentage of time living in the rural area, work, and number of residents.
Table 3. Odds ratio (OR) adjusted according to the socioeconomic, demographic, and behavioral variables. Pelotas, State of Rio Grande do Sul, Brazil, 2016.
Variable
Perception of overall quality of lifef Satisfaction with healthf
(I) Very good (II) Good (III) Fair, poor, or very poor
(I) Very satisfied (II) Satisfied (III) Fair, dissatisfied, or very dissatisfied Crude OR (95%CI) Adjusted ORa (95%CI) Crude OR (95%CI) Adjusted ORa (95%CI)
Sex p = 0.744c p = 0.925c p = 0.001c p = 0.001c
Male Ref. Ref. Ref. Ref.
Female 1.04 (0.83–1.29) 1.01 (0.80–1.27) 1.51 (1.21–1.88) 1.50 (1.19–1.89)
Age (full years) p < 0.001d p < 0.001d p = 0.001d p = 0.001d
18–24 Ref. Ref. Ref. Ref.
25–39 1.92 (1.21–3.06) 1.90 (1.19–3.03) 1.71 (1.19–2.47) 1.70 (1.18–2.44)
40–59 2.44 (1.80–3.32) 2.52 (1.84–3.46) 2.04 (1.30–3.22) 2.06 (1.32–3.23)
≥ 60 3.33 (2.34–4.75) 3.47 (2.47–4.90) 2.24 (1.55–3.24) 2.26 (1.56–3.27)
Race p < 0.001c p = 0.004c p = 0.490c p = 0.308c
White Ref. Ref. Ref. Ref.
Other 1.51 (1.09–2.08) 1.65 (1.20–2.28) 1.12 (0.81–1.55) 1.18 (0.85–1.63)
Education level (full years) p < 0.001d p < 0.001d p = 0.002d p = 0.124d
0–4 Ref. Ref. Ref. Ref.
5–8 0.60 (0.47–0.76) 0.71 (0.54–0.94) 0.85 (0.66–1.09) 0.99 (0.76–1.28)
9–11 0.29 (0.21–0.40) 0.48 (0.33–0.70) 0.61 (0.42–0.88) 0.79 (0.50–1.26)
≥ 12 0.09 (0.05–0.18) 0.18 (0.08–0.39) 0.48 (0.27–0.85) 0.55 (0.28–1.10)
Index of goodsb (quintiles) p = 0.001c p = 0.010c p = 0.045c p = 0.819c
1st (poorest) Ref. Ref. Ref. Ref.
2nd 0.63 (0.43–0.93) 0.67 (0.43–1.06) 0.83 (0.57–1.22) 0.90 (0.60–1.35)
3rd 0.79 (0.53–1.17) 0.85 (0.53–1.35) 0.84 (0.56–1.28) 0.94 (0.61–1.44)
4th 0.52 (0.36–0.75) 0.64 (0.41–1.01) 0.73 (0.51–1.06) 0.84 (0.55–1.29)
5th (richest) 0.29 (0.19–0.43) 0.39 (0.24–0.65) 0.60 (0.42–0.85) 0.78 (0.50–1.23)
Number of residents p = 0.983c p = 0.184c p = 0.239c p = 0.203c
1 Ref. Ref. Ref. Ref.
2 0.90 (0.55–1.47) 1.22 (0.76–1.97) 0.92 (0.49–1.72) 1.04 (0.56–1.90)
3 0.93 (0.52–1.67) 1.80 (0.97–3.35) 0.97 (0.52–1.81) 1.23 (0.68–2.23)
4 0.89 (0.52–1.53) 1.86 (1.05–3.30) 0.88 (0.47–1.65) 1.18 (0.67–2.10)
≥ 5 0.93 (0.51–1.71) 1.91 (1.08–3.36) 0.69 (0.35–1.85) 0.94 (0.51–1.74)
Employment p = 0.007c p = 0.283c p = 0.001c p = 0.023c
No Ref. Ref. Ref. Ref.
Yes 0.71 (0.56–0.90) 0.86 (0.65–1.14) 0.61 (0.47–0.81) 0.69 (0.50–0.94)
Living with a partner p < 0.001c p = 0.469c p = 0.372c p = 0.949c
No Ref. Ref. Ref. Ref.
Yes 0.99 (0.71 - 1.39) 0.88 (0.62–1.26) 1.10 (0.88–1.39) 1.01 (0.76–1.34)
% of time living in the rural area p = 0.039d p = 0.055c p = 0.954c p = 0.946c
Less than 50% Ref. Ref. Ref. Ref.
50% to 99% 1.96 (1.34–2.85) 1.48 (1.02–2.14) 1.03 (0.75–1.41) 0.95 (0.67–1.34)
Up to 100% 1.61 (1.16–2.24) 1.35 (1.00–1.82) 0.97 (0.74–1.28) 0.98 (0.75–1.29)
High blood pressure p < 0.001c p = 0.094c p < 0.001c p = 0.001c
No Ref. Ref. Ref. Ref.
Yes 1.80 (-1.47–2.20) 1.22 (0.96–1.54) 2.36 (1.81–3.09) 1.80 (1.30–2.49)
Diabetes p < 0.001c p = 0.312c p < 0.001c p = 0.003c
No Ref. Ref. Ref. Ref.
Yes 1.89 (1.39–2.57) 1.18 (0.85–1.66) 2.66 (1.85–3.81) 1.93 (1.28–2.93)
High cholesterol p < 0.001c p = 0.027c p < 0.001c p = 0.010c
No Ref. Ref. Ref. Ref.
Yes 1.99 (1.55–2.54) 1.39 (1.04–1.85) 2.33 (1.80–3.03) 1.46 (1.10–1.94)
Cardiovascular diseasese p < 0.001c p = 0.172c p < 0.001c p = 0.195c
No Ref. Ref. Ref. Ref.
Yes 2.86 (-2.08– -1.66) 1.51 (0.83–2.75) 3.02 (-2.30–4.46) 1.42 (0.82–2.46)
Respiratory diseases p = 0.126c p = 0.223c p = 0.002c p = 0.013c
No Ref. Ref. Ref. Ref.
Yes 1.40 (0.90–2.18) 1.33 (0.83–2.13) 1.88 (1.30–2.73) 1.74 (1.13–2.68)
Rheumatic diseases p = 0.007c p = 0.073c p < 0.001c p < 0.001c
No Ref. Ref. Ref. Ref.
Yes 1.84 (1.20–2.83) 1.48 (0.96–2.29) 3.15 (2.22–4.48) 2.86 (1.93–4.24)
a Ordinal logistic regression adjusted for sex, age, race, education level.
b Index of goods by principal components, employment, number of residents in the household, living with a partner, percentage of time living in the rural area, work, and number of residents.
c P-value for heterogeneity. d P-value for linear trend. e Variable with most missing data.
DISCUSSION
In this study, we investigated quality of life and its demographic and socioeconomic determinants in the rural population of the city of Pelotas, Brazil, where 23% of the individuals reported having a fair, poor, or very poor overall QOL and 26% reported not being satisfied with their health.
Regarding the determinants of QOL in the rural population of Pelotas, we highlight the negative association between QOL in most domains and females, which has been previously observed in rural and urban areas in Brazil8. The greater exposure of women to some
factors assessed in the physical and psychological domains, such as drug consumption14,
depression15, and other common psychiatric disorders16, has already been observed in the
urban area of Pelotas, and it may also be related to QOL in rural areas. Consistently, women in the rural area of Pelotas were more likely to report poorer satisfaction with their health. The presence of women in the rural economy is strongly marked by the sexual division of labor, so that their occupations in rural areas involve not well-paid functions. Activities with little or no remuneration, such as those for family self-consumption, childcare, and care of other family members, as well as gardening and small animal care, can contribute to women having worse QOL in most domains evaluated. The environment domain also presented this same relation for women, possibly because of some aspects related to home environment, recreation or leisure, social and health care, and financial resources17.
Rural women have their lives strongly marked by the characteristics of the place where they live, which makes the reflection on their health situation challenging. The health of these women is directly related to living and working conditions, which produce risks such as illness and health problems. These vulnerabilities are due to several factors; among them, we can mention inequality in gender, race, and social class relations related to the social determinants of health conditions, such as diseases related to work, sexual violence, and
mental illness17. The knowledge on these characteristics implies in the identification of
situations that negatively affect the physical, mental, environmental, and health conditions of women, which would allow the development of policies that can contribute to improve the health status and quality of life of women.
The increase in age was also an important factor of vulnerability in the rural area of Pelotas, being related to worse QOL averages for the physical, psychological, and social relation domains and overall perception of QOL. Limitations in work and leisure, aesthetic changes, development of diseases, dependence on other individuals for relationships, and age-related prejudicesare factors considered as a consequence of the aging process and could negatively impact QOL18,19.
Socioeconomic determinants play a relevant role in the context of health behaviors19
among persons of lower socioeconomic level and lower education level19,20. In this sense, we
observed a negative association between education level and QOL scores for the physical and psychological domains, as well as perception of overall QOL. The effect of low education level on the acquisition of negative health habits, such as a higher prevalence of sedentary lifestyle, lower consumption of fresh fruits and vegetables, higher consumption of alcoholic beverages, and a higher prevalence of smoking have been described in urban areas21. It is possible that
the high level of illiteracy in rural areas22, also evidenced in this study, may be related to
worse health behaviors and, consequently, worse QOL. This highlights the importance of improving the access and quality of education in rural areas, since education level is an important health indicator, which may negatively impact the QOL of this population. In addition, individuals with lower socioeconomic status had lower QOL scores for all domains and worse perception of overall QOL. Consistently, employed participants had better QOL averages for most domains and a greater chance of having a better satisfaction with their health. Socioeconomic factors reflected in, for example, the number of medical and dental
the living standards, behavior, and health of the population, so that higher income, higher education level, and greater health care are observed in employed individuals23. Socioeconomic
indicators are likely to behave similarly within rural and urban populations so that the results sampled reflect the inequalities related to the demographic, social, cultural, and health characteristics in the general population, which indicates that poorer individuals and those with a lower education level are always among the most vulnerable groups.
Among all the outcomes, the variable of race was only associated with perception of overall QOL. Individuals who self-reported as non-white had a greater chance of having a worse perception of QOL. In Brazil, higher mortality and morbidity rates and lower life expectancy are observed in non-white individuals. Furthermore, this group of individuals also have lower financial conditions and less access to health and knowledge-related resources, in this way they have a disadvantage throughout their lives, both in rural and urban areas, in relation to social and health inequalities in Brazil6,11.
Living with a partner was associated with better QOL in the psychological domain. The results of the literature do not show a clear direction regarding the mental health of married individuals. Both results of better and worse mental health have already been observed24,25.
However, lower mortality and morbidity rates have been associated with being married in
other studies26,27. In this study, the increase in the number of individuals living in the same
household was associated with a decreased average QOL in the domain of social relations. The decrease in the privacy of the residents, both in the aspects related to sexual activity and in the social relations or supports given by the greater number of persons living in the same household, could explain such finding28.
In relation to the specific characteristics of rural areas, we highlight the geographical distance from large urban centers and the difficulty in the access to food, employment opportunities, and health services25–30. In addition, although there are schools located in
the rural area, distance and difficult in movement could be factors that hinder the access of students to the classroom. As a consequence, the association between the greater percentage of time living in the rural area and the lower chance of reporting better QOL may be explained by the scarce infrastructure available in rural areas. Further studies, conducted in other rural areas, are important to confirm these findings, as well as explore possible causes. In relation to the presence of diseases such as HBP, diabetes, high cholesterol, and cardiovascular, respiratory, and rheumatic diseases, the decrease in the scores of the physical domain was associated with the presence of all diseases, which is in accordance to that observed in rural areas of Turkey30 and may reflect disabilities and limitations in
individuals for work and leisure activities6.
This study presents a limitation, which is intrinsic to its sampling process; that is, individuals living far from the area of selected households may present health profiles and lifestyles different from those evaluated, which could modify the observed results. Furthermore, the period of study included months of greater harvest of some crops, and we could not interview the individuals involved in exhaustive harvest work, who could report a worse QOL. On the other hand, we highlight the large sample size and the low percentage of losses and refusals. Regarding QOL, we highlighted the use of an instrument developed by the World Health Organization (WHO) and validated in Brazil. In addition, this study is distinguished by the fact that it is population-based, with a sample of adults living in rural areas. Most studies evaluating QOL are specific to the urban area, with older adults, and performed with persons with morbidities.
the QOL of this population. Furthermore, this work highlights the vulnerability of three important groups: women, poorer individuals with a lower education level, and older adults. The QOL as a health indicator generates information that can be used to screen and identify the health needs of a population. The information presented here can be used in specific public health programs for inhabitants of rural areas of Brazil, considering the peculiarities of the place regarding the infrastructure and the health
needs of this population.
REFERENCES
1. Fleck MPA, Louzada S, Xavier M, Chachamovich E, Vieira G, Santos L, et al. Aplicação da versão em português do instrumento abreviado de avaliação da qualidade de vida “WHOQOL-bref”.
Rev Saude Publica. 2000;34(2):178-83. https://doi.org/10.1590/S0034-89102000000200012
2. Minayo MCS, Hartz ZMA, Buss PM. Qualidade de vida e saúde: um debate necessário. Cienc
Saude Coletiva. 2000;5(1):7-18. https://doi.org/10.1590/S1413-81232000000100002
3. Instituto Brasileiro de Geografia e Estatística. Pesquisa Nacional por Amostra de Domicílio
(PNAD) 2014. Rio de Janeiro: IBGE; 2015 [cited 2018 Feb 12]. Available from: https://ww2.ibge.
gov.br/home/estatistica/populacao/trabalhoerendimento/pnad2014/default.shtm
4. Instituto Brasileiro de Geografia e Estatística. Pesquisa de Orçamentos Familiares (POF) 2008-2009: despesas, rendimentos e condições de vida. Rio de Janeiro: IBGE; 2010 [cited 2018 Feb 12]. Available from: https://biblioteca.ibge.gov.br/visualizacao/livros/liv45130.pdf
5. Sonati JG, Vilarta R, Maciel ES, Modeneze DM, Vilela Junior GB, Lazari VO, et al. Análise comparativa da qualidade de vida de adultos e idosos envolvidos com a
prática regular de atividade física. Rev Bras Geriatr Gerontol. 2014;17(4):731-9.
https://doi.org/10.1590/1809-9823.2014.13122
6. Instituto Brasileiro de Geografia e Estatística. Pesquisa Nacional de Saúde (PNS) 2013: percepção do estado de saúde, estilos de vida e doenças crônicas: Brasil, Grandes Regiões e Unidades da Federação. Rio de Janeiro: IBGE; MS; 2014 [cited 2018 Feb 12]. Available from: ftp://ftp.ibge.gov.br/PNS/2013/pns2013.pdf
7. Carneiro FF, Rigotto RM, Augusto LGS, Friedrich K, Búrigo AC, organizadores. Dossiê ABRASCO: um alerta sobre os impactos dos agrotóxicos na saúde. Rio de Janeiro: EPSJV; Expressão Popular; 2015 [cited 2018 Feb 12]. Available from: http://www.epsjv.fiocruz.br/sites/default/files/l241.pdf
8. Kostka J, Borowiak E, Kostka T. Nutritional status and quality of life in different
populations of older people in Poland. Eur J Clin Nutr. 2014:68(11):1210-5.
https://doi.org/10.1038/ejcn.2014.172
9. Moreira JPL, Oliveira BLCA, Muzi CD, Cunha CLF, Brito AS, Luiz RR. A saúde dos
trabalhadores da atividade rural no Brasil. Cad Saude Publica. 2015;31(8):1698-708.
https://doi.org/10.1590/0102-311X00105114
10. Shepherd D, Welch D, Dirks KN, McBride D. Do quiet areas afford greater health-related
quality of life than noisy areas? Int J Environ Res Public Health. 2013;10(4):1284-303.
https://doi.org/10.3390/ijerph10041284
11. Instituto Brasileiro de Geografia e Estatística. Censo Demográfico 2010. Rio de Janeiro: IBGE;
2010 [cited 2018 Feb 13]. Available from: http://www.censo2010.ibge.gov.br/
12. Gonçalves H, Tomasi E, Tovo-Rodrigues L, Bielemann RM, Machado AKF, Ruivo ACO, et al.
Estudo de base populacional na zona rural: metodologia e desafios. Rev Saude Publica. 2018;52
Supl 1:3s. https://doi.org/10.11606/S1518-8787.2018052000270
13. Fleck MPA, Leal OF, Louzada S, Xavier M, Chachamovich E, Vieira G, et al. Desenvolvimento da versão em português do instrumento de avaliação de
qualidade de vida da OMS (WHOQOL-100). Rev Bras Psiquiatr. 1999;21(1):19-28.
https://doi.org/10.1590/S1516-44461999000100006
14. Bertoldi AD, Barros AJD, Hallal PC, Lima RC. Utilização de medicamentos em adultos:
prevalência e determinantes individuais. Rev Saude Publica. 2004;38(2):228-38.
https://doi.org/10.1590/S0034-89102004000200012
15. Mola CL, Quevedo LA, Pinheiro RT, Gonçalves H, Gigante DP, Motta JVS, et al. The effect of fetal and childhood growth over depression in early adulthood in a Southern Bazilian birth
16. Anselmi L, Barros FC, Minten GC, Gigante DP, Horta BL, Victora CG, et al. Prevalência e determinantes precoces dos transtornos mentais comuns na coorte
de nascimentos de 1982, Pelotas, RS. Rev Saude Publica. 2008;42 Supl 2:26-33.
https://doi.org/10.1590/S0034-89102008000900005
17. Ministério da Saúde (BR), Secretaria de Gestão Estratégica e Participativa, Departamento de Apoio à Gestão Participativa. Tecendo a saúde das mulheres do campo, da floresta e das águas: direitos e participação social. Brasília (DF); 2015. (Movimentos Sociais, 2). Available from: http:// bvsms.saude.gov.br/bvs/publicacoes/tecendo_saude_mulheres_campo_floresta.pdf
18. Ran L, Jiang X, Li B, Kong H, Du M, Wang X, et al. Association among activities of daily living, instrumental activities of daily living and health-related quality of life in elderly Yi ethnic
minority. BMC Geriatr. 2017;17(1):74. https://doi.org/10.1186/s12877-017-0455-y.
19. Fialho CB, Lima-Costa MF, Giacomin KC, Loyola Filho AI. Capacidade funcional e uso de serviços de saúde por idosos da Região Metropolitana de Belo Horizonte, Minas
Gerais, Brasil: um estudo de base populacional. Cad Saude Publica. 2014;30(3):599-610.
https://doi.org/10.1590/0102-311X00090913
20. Lima-Costa MF. A escolaridade afeta, igualmente, comportamentos prejudiciais à saúde de idosos e adultos mais jovens? Inquérito de Saúde da Região Metropolitana
de Belo Horizonte, Minas Gerais, Brasil. Epidemiol Serv Saude. 2004;13(4):201-8.
https://doi.org/10.5123/S1679-49742004000400002
21. Instituto Brasileiro de Geografia e Estatística. Pesquisa Nacional por Amostra de Domicílios (PNAD) 2008. Rio de Janeiro: IBGE; 2009.
22. Schmidt MI, Duncan BB, Silva GA, Menezes AM, Monteiro CA, Barreto SM. et al. Chronic
non-communicable diseases in Brazil: burden and current challenges. Lancet.
2011;377(9781):1949-61. https://doi.org/10.1016/S0140-6736(11)60135-9
23. Bierman A, Fazio EM, Milkie MA. A multifaceted approach to the mental health advantage of
the married. Assessing how explanations vary by outcome measure and unmarried group. J Fam
Issues. 2006;27(4):554-82. https://doi.org/10.1177/0192513X05284111
24. Vidal CEL, Gontijo EcDM, Lima LA. Tentativas de suicídio: fatores prognósticos
e estimativa do excesso de mortalidade. Cad Saude Publica. 2013;29(1):175-87.
https://doi.org/10.1590/S0102-311X2013000100020
25. Han KT, Park EC, Kim JH, Kim SJ, Park S. Is marital status associated with quality of life? Health
Qual Life Outcomes. 2014;12:109. https://doi.org/10.1186/s12955-014-0109-0
26. Chen Y, Sun G, Guo X, Chen S, Chang Y, Li Y, et al. Factors affecting the quality of life among
Chinese rural general residents: a cross-sectional study. Public Health. 2017;146:140-7.
https://doi.org/10.1016/j.puhe.2017.01.023
27. Fundação Nacional de Saúde (BR). Saúde da população negra no Brasil: contribuições para a promoção da equidade. Brasília (DF): FUNASA; 2005 [cited 2018 Feb 12]. Available from: http://bvsms.saude.gov.br/bvs/pop_negra/pdf/saudepopneg.pdf
28. Conselho Nacional de Secretários de Saúde. Atenção primária e promoção da saúde. Brasília (DF): CONASS; 2011.
29. Reichert FF, Loch MR, Capilheira MF. Autopercepção de saúde em
adolescentes, adultos e idosos.Cienc Saude Coletiva. 2012;17(12):3353-62.
https://doi.org/10.1590/S1413-81232012001200020
30. Arslantas D, Ursal A, Metintas S, Koc F, Arslantas A. Life quality and daily life activities of
elderly people in rural areas, Eskisehir (Turkey). Arch Gerontol Geriatr. 2009;48(2):127-31.
https://doi.org/10.1016/j.archger.2007.11.005
Funding: Programa de Excelência Acadêmica da Coordenação de Aperfeiçoamento de Pessoal de Nível Superior (PROEX/CAPES – Process 23038.002445/2015-97, benefit number 1012/2015).
Authors’ Contribution: All authors have participated in all stages of the article, and have approved the final version of the study and assume public responsibility for the content of the article.