104 Finance – Challenges of the Future
1. General considerations Analysing the current economical context, we may notice that this difficult period is a challenge to financial stability in Romania. World economy could be affected by a reduction in the growth rate, especially at the level of developed economies. Translating the negative effects by contagion, effects caused by the crisis of sovereign debts in some EU countries and in the USA and maintaining the vulnerabilities in certain European banking sectors may have repercussions on the economic growth in Romania, on the capacity of the banking sector to access funds and on the quality of bank assets.
2.Research methodology
We wonder what actions were taken by the National Bank of Romania to minimise as much as possible the possible negative effects caused by contagion on the mentioned channels. The answer is simple, because NBR closely and permanently monitors the prudential situation of banks – Romanian legal entities with foreign capital from the countries affected by the crisis of
sovereign debts. The capacity of these banks to cope with a potential shock of external financing was consolidated in 2011, the solvability level being for most of the banks in this group at values higher than the average by system, and the liquidity one at similar values, above the regulated level. Moreover, the financial contribution of the parent-banks and after the outbreak of the crisis, they ensured over 95 percent of the external financing attracted in 2010 by their Romanian subsidiaries.
In the analysis performed, we started from the model suggested by Mankiw and others. (1992) (equation 1) and that had already been applied for the financial system of India by Chakraborty Indrani, (2008, 2010), as follows:
1)
(
t tt t
t
K
H
A
L
Y
(1)where is the production, is the capital, is the human capital stock, is the labour and is the technology level. We shall apply the same model for our country too. By applying the logarithm on both sides and replacing
A
t
A
0e
kt, we get:t t
t
t
K
H
A
kt
L
Y
log
log
(
1
)
log
(
1
)
log
log
0
(2)Here, we make a simplifying assumption (Chakraborty, I., 2010) that
k
, the progress of knowledge, remains constant over time.It is further assumed that
t
A
0
log
. Thus, from the equation(2), we have:
EMPIRICAL STUDY REGARDING THE RELATION
BETWEEN THE ROMANIAN BANKING SYSTEM AND
ECONOMIC GROWTH
Lect. Alina Georgiana MANTA, PhD
Assoc. Prof. Roxana Maria BĂDÎRCEA, PhD
t t
t t
t
K
H
kt
L
Y
log
log
(
1
)
log
log
(3)By differentiating the equation(3), depending on
t
, we get the equation (4):t
u
k
dt
dL
L
dt
dH
H
dt
dK
K
g
(
1
/
)
/
(
1
/
)
/
(
1
)(
1
/
)
/
(4)where
g
is the production growth rate. It is assumed that the gross investments have the following form (Chakraborty, I., 2010) (equation [5]):t t
t
K
K
I
1
(
1
)
(5)where
I
t= gross investments and
= the rate which the capital depreciates at during a period. In a free economy, where the budget is balanced, the lag between economies and investments is equal to the commercial deficit (equation [6]).Thus, (Chakraborty, I., 2010):
ft t
t t
t
I
X
M
K
S
(6)where
S
t = the internal gross economies during the periodt
, Xt = exports during theperiod t,
M
t= imports during the periodt
and
K
ft= net capital inflows. Assumingthat during the financial intermediation process, some leakages occur
)
1
(
outside the flow of internal economies, we can write:t ft
t
K
I
S
(7)By replacing the equations (5) and (7) in (4), we can get (Chakraborty, I., 2010):
t t
t
u
k
dt
dL
L
dt
dH
H
Y
K
s
g
/
)
/
1
)(
1
(
/
)
/
1
(
)
))
/
/(
)
(((
(8)
where
s
S
t/
Y
t şi
K
ft/
Y
t.The equation (8) suggests that in the steady state (Chakraborty, I., 2010), the growth rate depends on the ratio between the capital and production, the proportion of total economies that are transformed into a ratio between investments and economies, the ratio net capital inflows and aggregated production or incomes, the depreciation rate, human capital growth rate and labour force growth rate.
We could also consider the behavioural nature (Chakraborty, I., 2010) of each element in the equation (8). For the variable
, it is reasonable to assume that its behaviour depends on any of the two indicators of developing the stock exchange and namely the market capitalisation (MCAP) and turnover (TURN). The coefficient of market stock capitalisation is generally considered as a measurement of the stock exchange size, and the turnover measures the liquidity of the stock exchange.Therefore, we assume further that
depends on the real effective exchange rate (REER). In a study performed by Greene and Villanueva (1991) on a sample of 23 developing countries, it has been observed that the high rate of inflation had a negative effect on private investments. Thus, the inflation (INFL) also becomes an influencing variable to explain the behaviour of
. The behaviour of
can therefore be expressed as follows [9]):)
,
,
(
STOCK
REER
INFL
f
(9)106 Finance – Challenges of the Future Following the reasoning of Murinde
(1996), the behaviour of the coefficient of economies (
s
) is considered to be influenced by the profitability rate on the monetary market or the market interest rate (INT). It is also likely that the coefficient of Romanian economies also depends on the profitability rate on the unofficial market of credits. However, it is difficult to measure the profitability rate on the unofficial market of credits. On the other hand, according to Chakraborty (2010), Indian private economies are additionally influenced by inflation (INFL), actual wealth (WEALTH), estimated bythe ratio between the money supply (M3) and the gross national income (Athukorala and Sen 2004). Therefore, the behaviour of
s
in India can be expressed as follows:)
,
,
(
INF
INFL
WALTH
f
s
(10)For simplicity, we assume that
g
, the production growth rate is linearly related to each variable in the previous specifications. By replacing the functions from the equations (9) and (10) into (8), we get the reduced form below:
RLAB
RHUM
WEALTH
INFL
REER
INT
STOCK
Y
K
g
9 8
7 6
5
4 3
2 1
0
(
/
)
(11)
where
= the white noise error term,dt
dH
H
RHUM
(
1
/
)
/
dt
dL
L
RLAB
(
1
/
)
/
andSTOCK
can beMCAP
orTURN
.The equation (11) (Chakraborty, I., 2010). shows how the development of the banking system and stock exchange growth could affect the growth after investigating the effects of a large number of macroeconomic variables, along with the human capital growth rate and the labour force growth rate.
3. Results of the analysis The empirical analysis is done by means of the quarterly data for Romania, for the period 2000 - 2010. The data series have been acquired or compiled from the Statistical Yearbooks, Annual
Reports of the National Bank of Romania, International Financial Statistics (International Monetary Fund), Bucharest Stock Exchange, EUROSTAT, UNCTAD.
The growth rate of GDP (G) is measured as the growth rate of the gross domestic product. The data series concerning the GDP are the quarterly ratio for the period in 2000 until 2010 by the National Institute of Statistics.
According to the data in the Statistical Yearbook of Romania, after a period of decline (1997-2001) of the Gross Domestic Product, the economic growth was revived since 2012 and was significantly determined by the increase of the workload in the field of services, constructions and industry.
Graph no.1. The quarterly GDP growth rate (G)
0.00 5000.00 10000.00 15000.00 20000.00 25000.00 30000.00 35000.00
2000 Q1
2000 Q3
2001 Q1
2001 Q3
2002 Q1
2002 Q3
2003 Q1
2003 Q3
2004 Q1
2004 Q3
2005 Q1
2005 Q3
2006 Q1
2006 Q3
2007 Q1
2007 Q3
2008 Q1
2008 Q3
2009 Q1
2009 Q3
2010 Q1
The economic growth registered after 2001 was affected by the substantial increase of the current account deficit, due to the higher increase of the volume of imports of goods and services, compared to that of exports.
The economic growth registered in 2004, considered as the best one of Romania after 1989, has mainly been achieved based on a good agricultural year and on constructions.
2007 marks a break in the economic cycle: inflation returned, its trend being descendant (graph no. 5),
and the Leu/Euro exchange rate followed an ascending tendency, based on the external deficit growth. The economic growth was mainly obtained based on the increase of imports far above the value of exports.
After 2009, along with the significant contraction of the economic activity and unemployment increase, the Leu has come under pressure, the overdue loans rose suddenly, and the advance of lending slowed down considerably, due to the risk aversion and banks‟ limited financial resources.
Graph no.2. The evolution of the capital/quarterly production ratio
0 0.05 0.1 0.15 0.2 0.25 0.3
2000 Q1
2000 Q3
2001 Q1
2001 Q3
2002 Q1
2002 Q3
2003 Q1
2003 Q3
2004 Q1
2004 Q3
2005 Q1
2005 Q3
2006 Q1
2006 Q3
2007 Q1
2007 Q3
2008 Q1
2008 Q3
2009 Q1
2009 Q3
2010 Q1
2010 Q3
To assess the ratio between the capital and production, we used the data regarding the gross formation of capital and production of goods and services, by using the numbers from the data series of the database of INSSE TEMPO Online.
The development of the stock exchange (STOCK) can be measured either by market capitalisation (MCAP), or by the turnover (TURN). We have used the data regarding the market capitalisation which we expressed as percentage of GDP.
Graph no.3. The evolution of market capitalisation as percentage of GDP (STOCK)
0.00 0.50 1.00 1.50 2.00 2.50 3.00 3.50 4.00
2000 Q1
2000 Q3
2001 Q1
2001 Q3
2002 Q1
2002 Q3
2003 Q1
2003 Q3
2004 Q1
2004 Q3
2005 Q1
2005 Q3
2006 Q1
2006 Q3
2007 Q1
2007 Q3
2008 Q1
2008 Q3
2009 Q1
2009 Q3
2010 Q1
108 Finance – Challenges of the Future
The data regarding the interest rate (INT) are those in the database of the National Bank of Romania
concerning the monetary policy interest rate.
Graph no.4. The evolution of the monetary policy interest rate (INT)
0.00 5.00 10.00 15.00 20.00 25.00 30.00 35.00 40.00
200 0 Q
1
200 0 Q
3
200 1 Q
1
200 1 Q
3
200 2 Q
1
200 2 Q
3
200 3 Q
1
200 3 Q
3
200 4 Q
1
200 4 Q
3
200 5 Q
1
200 5 Q
3
200 6 Q
1
200 6 Q
3
200 7 Q
1
200 7 Q
3
200 8 Q
1
200 8 Q
3
200 9 Q
1
200 9 Q
3
201 0 Q
1
201 0 Q
3
The inflation is measured as annual average (graph no.5.);
is assessed as net capital inflows to theGDP, meaning the share of foreign investments directly into the GDP based on the data of UNCTAD.
Graph no.5. The evolution of the quarterly inflation rate
0.00 20.00 40.00 60.00 80.00 100.00 120.00 140.00
200 0 Q
1
200 0 Q
3
200 1 Q
1
200 1 Q
3
200 2 Q
1
200 2 Q
3
200 3 Q
1
200 3 Q
3
200 4 Q
1
200 4 Q
3
200 5 Q
1
200 5 Q
3
200 6 Q
1
200 6 Q
3
200 7 Q
1
200 7 Q
3
200 8 Q
1
200 8 Q
3
200 9 Q
1
200 9 Q
3
201 0 Q
1
201 0 Q
3
We assessed the real effective exchange rate (REER) based on the real effective exchange rate, according to the data provided by EUROSTAT (graph no. 6.).
To assess the human capital, we considered the level which includes in education the population aged over 19,
an indicator calculated as share in the same age group, based on the data provided by the National Institute of Statistics.
Graph no. 6. The evolution of the effective – quarterly real exchange rate
0.00 50.00 100.00 150.00 200.00 250.00
200 0 Q
1
200 0 Q
3
200 1 Q
1
200 1 Q
3
200 2 Q
1
200 2 Q
3
200 3 Q
1
200 3 Q
3
200 4 Q
1
200 4 Q
3
200 5 Q
1
200 5 Q
3
200 6 Q
1
200 6 Q
3
200 7 Q
1
200 7 Q
3
200 8 Q
1
200 8 Q
3
200 9 Q
1
200 9 Q
3
201 0 Q
1
201 0 Q
3
To understand this more easily, we shall present a recapitulative table on the definitions of variables, symbols used
and measurements performed (see Table no.1).
Table no. 1. Summary table of the variables used in the model
Definition of variable
Symbol used
Measurement of variable
GDP growth rate G Growth rate of the gross domestic product Interest rate INT Monetary policy interest rate
Inflation INFL Annual inflation rate
Net capital inflows
into GDP
Share of foreign direct investments in GDP
Real effective exchange rate
REER The real effective exchange rate determined based on exports
Human capital growth rate
RHUM Level including in education the population aged over 19
Labour force growth rate
RLAB Employment rate Wealth
measurement
WEALTH Ratio between M3 and the gross national income Stock exchange
development indicator
STOCK Ratio between market capitalisation and GDP
Gross formation of capital related to the production achieved
K/Y Ratio between capital and production
We shall further investigate empirically the extent to which these factors explain the economic growth in the current Romanian economic context. In order to reduce the differences between
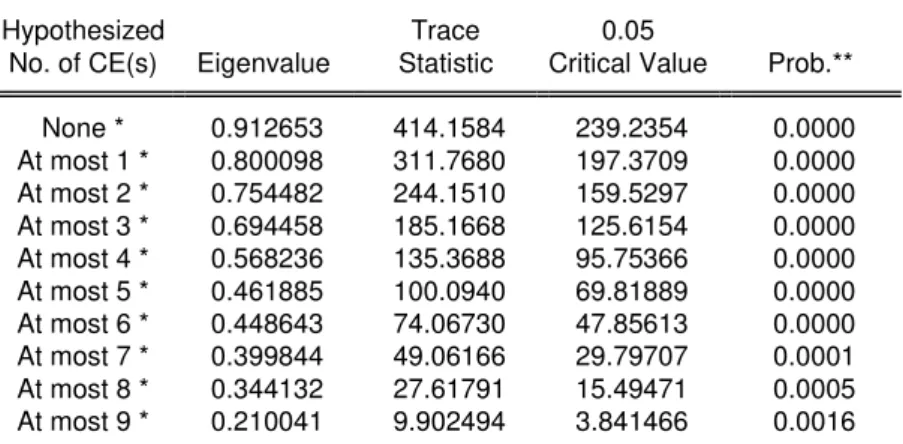
110 Finance – Challenges of the Future To start with, the Johansen
cointegration test is applied to a version of first-order vector auto-regression of equation (11), in order to investigate the presence of cointegration among the GDP growth rate, the ratio between the capital and production, stock exchange development indicator, interest rate on the monetary market, real effective
exchange rate, deferred value of the debt burden, inflation, wealth, net capital inflows as coefficient of GDP, the labour force growth rate and human capital growth rate. The lag duration of the VAR model is selected based on the information criteria Akaike and Schwarz (table 2).
Table no. 2. The Johansen cointegration test
Date: 10/29/12 Time: 00:36 Sample (adjusted): 2000Q3 2010Q4 Included observations: 42 after adjustments Trend assumption: Linear deterministic trend
Series: G KY LFI LINFL LINT LREER1 LRHUM LRLAB STOCK WEALTH Lags interval (in first differences): 1 to 1
Unrestricted Cointegration Rank Test (Trace)
Hypothesized Trace 0.05
No. of CE(s) Eigenvalue Statistic Critical Value Prob.**
None * 0.912653 414.1584 239.2354 0.0000
At most 1 * 0.800098 311.7680 197.3709 0.0000
At most 2 * 0.754482 244.1510 159.5297 0.0000
At most 3 * 0.694458 185.1668 125.6154 0.0000
At most 4 * 0.568236 135.3688 95.75366 0.0000
At most 5 * 0.461885 100.0940 69.81889 0.0000
At most 6 * 0.448643 74.06730 47.85613 0.0000
At most 7 * 0.399844 49.06166 29.79707 0.0001
At most 8 * 0.344132 27.61791 15.49471 0.0005
At most 9 * 0.210041 9.902494 3.841466 0.0016
Trace test indicates 10 cointegrating eqn(s) at the 0.05 level * denotes rejection of the hypothesis at the 0.05 level **MacKinnon-Haug-Michelis (1999) p-values
Unrestricted Cointegration Rank Test (Maximum Eigenvalue)
Hypothesized Max-Eigen 0.05
No. of CE(s) Eigenvalue Statistic Critical Value Prob.**
None * 0.912653 102.3904 64.50472 0.0000
At most 1 * 0.800098 67.61706 58.43354 0.0050
At most 2 * 0.754482 58.98415 52.36261 0.0092
At most 3 * 0.694458 49.79799 46.23142 0.0200
At most 4 0.568236 35.27480 40.07757 0.1576
At most 5 0.461885 26.02672 33.87687 0.3191
At most 6 0.448643 25.00563 27.58434 0.1032
At most 7 * 0.399844 21.44375 21.13162 0.0452
At most 8 * 0.344132 17.71542 14.26460 0.0137
At most 9 * 0.210041 9.902494 3.841466 0.0016
Max-eigenvalue test indicates 4 cointegrating eqn(s) at the 0.05 level
* denotes rejection of the hypothesis at the 0.05 level **MacKinnon-Haug-Michelis (1999) p-values
The maximum own value and statistical test “trace” in Table no.2. suggest that there are at least 4 cointegration vectors between the 10 variables taken into account in equation (11). As outlined by Maysami and Koh (2000), when there is more than one cointegration vector, the first own vector, which is based on the greatest own value, is deemed to be the most useful. Therefore, we shall discuss the results of the first cointegration vector in detail and shall ignore the discussions concerning
other cointegration vectors. The observations of the first cointegration vector suggest that there is a stable relationship of long term balance between the real increasing rate, the financial development indicators, other macroeconomic bases, the labour force growth rate and the human capital growth rate in Romania.
The first and most useful one of the five possible cointegration vectors may be interpreted as the long term growth equation (12):
WEALTH
00
.
190
INFL
02
.
16
REER
84
.
36
INT
40
.
4
STOCK
66
.
12
91
.
4
RHUM
52
.
14
RLAB
83
.
105
Y
/
K
78
.
226
G
(12)
Normalized cointegrating coefficients (standard error in parentheses) G KY LFI LINFL LINT LREER1 LRHUM LRLAB STOCK WEALTH
1.000000 -226.7861 4.910396 -16.02469 -4.403523 36.84918 -14.52753 -105.8306 -12.66006 190.0091
From the long term growth equation, it appears that the ratio between the capital and production and the labour force growth rate have a negative effect on the economic growth, and the human capital growth rate also has a negative effect on the economic growth. In this case, the negative effect of the human capital on the economic growth seems not to meet our hypothesis to explain the economic growth by means of the model of Mankiw and others. (1992). A growth of the net capital inflows as percentage of GDP boosts the economic growth during the analysed period. This result seems to be due to the nature of the capital in Romania in recent years. Thus, our observation suggests that this special type of capital flow contributes in developing the real sector of economy. The market capitalisation has a negative effect on the economic growth. Therefore, we may generally say that the growth of the stock exchange did not influence the economic growth in Romania during the analysed period.
On the other hand, the market interest rate has a negative effect on the
economic growth. This implies that a decrease of the interest rate, which shows the effect of the actions taken by the NBR within the banking system, has improved the real GDP growth rate during the analysed period. The WEALTH variable has a positive effect on the economic growth. In Romania, it seems that a growth of the real wealth has a positive effect on the saving rate by which the actual rate of economic growth is also affected positively. Finally, inflation has a negative effect on the economic growth. Thus, the increase of the inflation rate does not encourage the economic growth, leading to a relative decline in the economic growth rate.
4. Conclusions
112 Finance – Challenges of the Future development and economic growth. The
model has been assessed afterwards by using the quarterly data for the period 2000 – 2010 in Romania, using the cointegration techniques and the method of the error correction vector.
The result of cointegration shows that the ratio between capital and production and the human capital growth rate have a negative impact on the real rate of GDP growth. An increase of the market capitalisation seems to have a negative effect on the economic growth in Romania.
On the other hand, the effects of the interest rate on the monetary market has a negative effect on the economic growth, which shows that the effect of the actions taken by NBR within the banking system has improved the growth rate of real GDP during the analysed period. An interesting observation is that direct foreign investments as share of the GDP have a positive effect on the economic growth.
Therefore, the observations do not provide any support to the theoretic prediction that the development of the stock exchange would play an important role in intensifying the economic growth in Romania. In contrast with the stock exchange development, the actions taken by NBR on maintaining a monetary policy interest rate at a lower level seems to have significantly promoted the economic growth, as well as the ratio between the money supply M3 and the Net National Income. The results support the view that the stock exchange development may not accelerate the process of economic growth in developing countries (Singh 1997). These results suggest that in Romania, the stock exchanges are not substitutes for the banking system and that one of the factors that can further put their mark on the acceleration of economic growth in our country is the banking system.
Acknowledgment: This work was supported by the strategic grant POSDRU/89/1.5/S/61968, Project ID61968 (2009), co-financed by the European Social Fund within the Sectoral Operational Programme Human Resources Development 2007 – 2013.
Athukorala, P. and K. Sen
„The Determinants of Private Saving in India‟, World Development,
32(3): 491–503, 2004;
Bal A. The evolution of the current account deficit in the context of Romania's
accession to the EU, Transylvanian Review of Administrative
Sciences, no. 1(21)/2008; Baltagi, B. H.,
Demetriades, P. O. Law, S. H.
Financial Development and Openness: Evidence from Panel Data,
Journal of Development Economics, 2008;
Barbu T.
Vintilă G. Strengthen banking supervision in the context of a pan-European banking system, Theoretical and Applied Economics Review, year XIV, nr.3 (508), March 2007;
Barth, Capiro and Levine,
Banking systems around the globe: do regulation and ownership affect
the performance and stability?", 2000, Policy Research Working Paper
Series 2325, The World Bank; Beck, T.
Levine R.
Stock Markets, Banks and Growth: Panel Evidence, Journal of
Banking and Finance, 28(3), 2004;
Beck T. The Econometrics of Finance and Growth, Policy Research Working
Paper Series 4608, The World Bank, 2008; Boyd J.,
Prescott E.
Financial Intermediary-Coalitions, Research Department Staff Report
87/1985;
Buffie, E. „Devaluation, Investment and Growth in LDCs’, Journal of
Development, Economics, 20(2): 361–79, 1986;
Casu B., Girardone C.
Testing the relationship between competition and efficiency in
banking: A panel data analysis, Economics Letters 105 (1), 2009;
Chakraborty, I. „Does Financial Development Cause Economic Growth? The Case of
India’, South Asia Economic Journal, 9(1): 109–39, 2008;
Chakraborty, I. Financial Development and Economic Growth in India: An Analysis of
the Post-reform Period, South Asia Economic Journal 11(2) 287–308,
2010; Demirguc-Kunt, A.
Levine R.
Financial Structure and Economic Growth: A Cross-Country
Comparison of Banks, Markets and Development, Cambridge, MA :
MIT Press, 2001; Greene, J. and D.
Villanueva
‘Private Investment in Developing Countries: An Empirical Analysis’,
IMF Staff Papers, 38(1): 33–58, 1991;
Guglielmo M., Caporale C., Sova R. R., Sova A.
Financial Development and Economic Growth: Evidence from Ten
New EU Members, Berlin, 2009;
Hagmayr B., Haiss P.R., Sumegi K.
Financial Sector Development and Economic Growth - Evidence for
South Eastern Europe, European Institute Working Paper, 2007;
Levine R. Financial Development and Economic Growth: Views and Agenda,
Journal of Economic Literature, Vol. 35, No. 2. (Jun., 1997) ; Mankiw, N. G., D.
Romer, and David N. Weil
"A Contribution to the Empirics of Economic Growth". Quarterly Journal of Economics, 107(2): 407-437. Massachusetts Institute of
Technology Press,1992;
Maysami, R.C. and T.S. Koh
„A Vector Error Correction Model of the Singapore Stock Market’,
International Review of Economics and Finance, 9(1): 79–96, 2000;
Murinde, V. ‘Financial Markets and Endogenous Growth: An Econometric
Analysis for Pacific Basin Countries’, in N. Hermes and R. Lensink
(eds), Financial Development and Economic Growth: Theory and
Experience from Developing Countries, pp. 94–114. London:
Routledge, 1996;
Rudra Prakash P. The Nexus between Financial Development and Economic Growth in
India: Evidence from Multivariate VAR Model, International Journal of
Research and Reviews in Applied Sciences, 2009 Vol. 1(2) ;
Singh, A. „Financial Liberalisation, Stockmarkets and Economic Development’,
The Economic Journal, 107(May): 771–82, 1997;
Solow R. A Contribution to the Theory of Economic Growth, Quarterly Journal of
Economics. London, 1956, vol. 70;
***** National Institute of Statistics Romania:
http://www.insse.ro/cms/rw/pages/anuarstatistic2010.ro.do
***** EUROSTAT
http://epp.eurostat.ec.europa.eu/portal/page/portal/statistics/themes
***** UNCTAD: http://unctad.org/en/Pages/Statistics.aspx/
***** National Bank of Romania: http://www.bnro.ro/Publicatii-4.aspx
***** International Monetary Fund. Data and Statistics: