© Author(s) 2016. CC Attribution 3.0 License.
Accessing diverse data comprehensively –
CODM, the COSYNA data portal
Gisbert Breitbach1, Hajo Krasemann1, Daniel Behr1, Steffen Beringer1, Uwe Lange2, Nhan Vo3, and
Friedhelm Schroeder1
1Helmholtz-Zentrum Geesthacht, Institute for Coastal Research, Max-Planck-Str. 1, 21502 Geesthacht, Germany 2Brockmann Consult, Geesthacht, Germany
3Smile Consult GmbH, Hannover, Germany
Correspondence to:Gisbert Breitbach ([email protected])
Received: 5 February 2016 – Published in Ocean Sci. Discuss.: 9 March 2016 Revised: 6 July 2016 – Accepted: 11 July 2016 – Published: 26 July 2016
Abstract. The coastal observation system COSYNA aims
to describe the physical and biogeochemical state of a re-gional coastal system. The COSYNA data management is the link between observations, model results and data usage. The challenge for the COSYNA data management CODM1is the integration of diverse data sources in terms of parameters, di-mensionality and observation methods to gain a comprehen-sive view of the observations. This is achieved by describing the data using metadata in a generic way and by making all gathered data available for different analyses and visualisa-tions in an interrelated way, independent of data dimension-ality. Different parameter names for the same observed prop-erty are mapped to the corresponding CF2 standard name (Eaton et al., 2010) leading to standardised and compara-ble metadata. These metadata together with standardised web services are the base for the data portal. The URLs of these web services are also stored within the metadata as direct data access URLs, e.g. a map such as a GetMap request.
1 Introduction
In the last years, various portals for ocean integrated observ-ing systems have been created, such as the Australian Ocean Data Network Portal with IMOS3 (Trull et al., 2010), the
1COSYNA Data and Metadata, http://codm.hzg.de/codm or
doi:10.17616/R3K02T
2climate and forecast
3Integrated Marine Observing System: https://imos.aodn.org.au
US Integrated Ocean Observing System4(IOOS, 2010), the Regional Ocean Observing Systems (ROOS) by Copernicus Marine Environment Monitoring Service5and EMODnet6or systems like PANGAEA7 (Diepenbroek et al., 2002). The latter is a more general collection of finalised environmen-tal data including ocean data and is not focused on observing systems. Since 2009, the Helmholtz Centre Geesthacht has built up COSYNA together with various partners8.
The role of data management in observing systems is of in-creasing importance (Porter et al., 2015) due to the fact that more and more very different observing methods are com-bined in such systems.
Most of the observing system portals follow the idea that data should be freely available to everybody. Data access and visualisation for observations is based on measurement plat-forms. A well-organised portal of this kind is the Western Channel Observatory9. First, the user has to select a platform
4http://www.ioos.noaa.gov/catalog/welcome.html
5http://marine.copernicus.eu
6http://www.emodnet.eu
7http://www.pangaea.de
8Alfred Wegener Institute, Bremerhaven; Bundesamt fuer
Seeschiffahrt und Hydrographie, Hamburg; marum, Bremen; In-stitut fuer Chemie und Biologie des Meeres, Oldenburg; Nieder-saechsischer Landesbetrieb fuer Wasserwirtschaft, Kuesten- und Naturschutz, Norderney; Hamburg Port Authority, Hamburg; Lan-desbetrieb fuer Kuestenschutz, Nationalpark und Meeresschutz Schleswig-Holstein, Husum; Zentrum fuer Marine und Atmo-sphaerische Wissenschaften, Hamburg; Bundesanstalt fuer Wasser-bau, Hamburg
and may then access the data related to that platform. They are optimal for a limited region and distinct parameter set.
Most portals of the big national observation systems such as IOOS are linked to other portals of regional systems or portals of integrated systems for a single type of observation (e.g. high frequency radar10). CODM offers an integrated portal for all COSYNA observations and additionally for op-erational model results. Thus, the portal allows an integrated access to highly diverse data with a focus on the observed property.
In addition to using CODM, the COSYNA data can be ac-cessed using specialised data portals for stationary time se-ries11, data from surveys12, data from FerryBoxes on ships going on fixed routes13 and remote sensing data14. These specialised portals have advantages when accessing data from single-platform types.
The following section of this paper describes the goal and the objectives of CODM, i.e. what should be done, whereas the subsequent Sects. 3–7 describe how this is done. Sec-tion 3 present the general outline of data management in COSYNA to meet the objectives with a focus on the essential elements, including various web services. The implementa-tion of these web services together with metadata are a new feature of CODM, allowing a flexible user-adapted visuali-sation and retrieval of all searched data. In Sect. 3.7, the in-tegration of web services and the concept of CODM is de-scribed. Short sections on data quality from the viewpoint of data management in Sect. 4 and data policy in Sect. 5 follow. In Sect. 6, some illustrative examples of the different ways data visualisations are implemented in the CODM portal are presented. Finally, in Sect. 7, very useful visualisation tools are described.
2 Goal of CODM
The objective of CODM is to gather data which are often heterogeneous in origin, from COSYNA, in an integrative way. To achieve this objective, all related data must be ho-mogenised with regard to data structure and have to be com-bined in plots and maps for visualisation. One solution would be the application of an ontology such as the one proposed by the Semantic Sensor Network Group (Lefort et al., 2011). For CODM, the mapping to standardised observed property names, the CF standard names (Eaton et al., 2010), is a fast and less complicated solution. Within the metadata, these standard names are mapped to the internal parameter names used by the scientists who set up the sensors and the data acquisition.
10http://www.ioos.noaa.gov/hfradar/welcome.html
11http://tsdata.hzg.de
12http://surveydata.hzg.de
13http://ferrydata.hzg.de
14http://kofserver1.hzg.de/public/
Based on metadata alone, the user of the COSYNA data portal should be able to select an observed property and the spatiotemporal extent of interest. Access to data should oc-cur only if it is really necessary, e.g. when a visualisation or download is requested. Data and metadata access is per-formed solely via standardised web services.
The COSYNA data policy is free and open, according to the idea that all data should be open to everybody without any restrictions or collection of personal data. The understanding of user requirements and the optimisation of the system ac-cordingly needs the monitoring of user access to COSYNA, which is a conflicting objective to the open data approach.
3 CODM system description
3.1 Observations
Observations in COSYNA result from different types of mea-surement devices leading to different types of data. Fixed po-sitions include
– buoys with CTDs (device measuring conductivity, tem-perature, pressure and more) and ADCPs (acoustic Doppler current profilers) at different fixed depths,
– Waverider buoys,
– stationary FerryBoxes and15
– underwater nodes with CTDs and ADCPs. Moving platforms include
– FerryBoxes on ships,
– gliders and
– ScanFish.
Remote sensing platforms include
– satellites (MODIS on Aqua, MERIS on ENVISAT) and
– land-based, high-frequency (HF) radar.
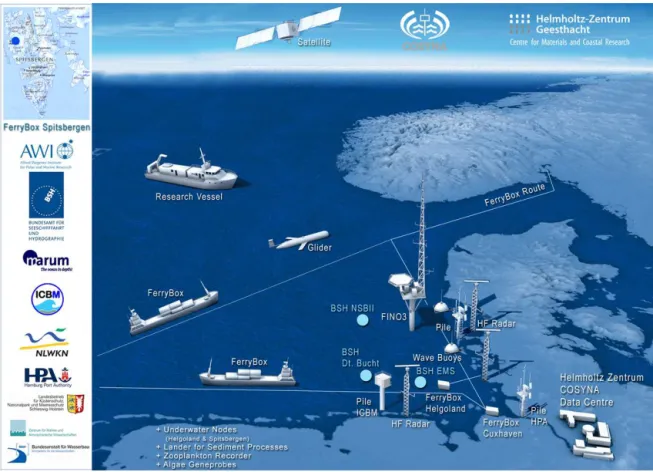
All observations will be described in other articles con-tained in theOcean ScienceandBiogeosciencesspecial issue entitled “COSYNA – Coastal Observing System for North-ern and Arctic Seas” (Baschek et al., 2016). A schematic overview of these observations is shown in Fig. 1.
15Normally, a FerryBox is used on a ship. If the box is placed
Figure 1.Main locations for COSYNA observations in the North Sea and at Spitsbergen (top left). The logos of COSYNA partner institutions are shown.
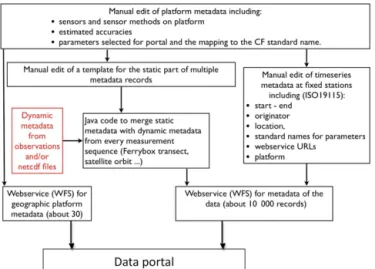
Figure 3.Scheme of the automatic metadata creation process.
3.2 Databases
As indicated in Fig. 2, all in situ observations are stored in relational databases (Oracle). For every type of in situ servation, a database with a data model suited to the ob-servation type is used. Data from FerryBoxes operating on steady routes are stored in the database which can be ac-cessed directly via http://ferrydata.hzg.de. Data from stations of fixed locations are accessible under http://tsdata.hzg.de. Survey data from ships not using steady routes can be ac-cessed under http://surveydata.hzg.de.
3.3 Models
One goal of COSYNA is to integrate observations and nu-merical models to get a synoptic view of the state of the coastal areas. This integration is done by assimilating real-time observations into a model reanalysis. Another objective of CODM is to enable an online validation of these models using observation data which are not used for assimilation.
3.3.1 Circulation model
Based on the GETM16 model (Stips et al., 2004) data from HF radar observations are assimilated into a reanalysis of the currents in the North Sea (Stanev et al., 2011). In addition, temperature data from OSTIA (Donlon et al., 2012) and Fer-ryBoxes are assimilated into GETM.
3.3.2 Wave model
Driven by data from DWD17, a prognostic wave model is run, which provides wave parameters for every hour up to a 36 h forecast (Behrens, 2009). In principle, the model output could be used for assimilation of observations, too. In
prac-16General Estuarine Transport Model
17Deutscher Wetterdienst – German Weather Service
tice, it is difficult to determine high-quality wave parame-ters from HF radar observations. On the other hand, the wave model data are consistent with observation to a degree that renders it unnecessary to improve the model via data assimi-lation (compare Fig. 9).
3.4 Collecting Observations
All COSYNA observations are collected in near-real time. The principle of the data flow is shown in Fig. 2. Data are stored as either netCDF files (Rew and Davis, 1990) in the COSYNA filesystem (remote sensing platforms) or as time series in relational databases (all other sources). Metadata are also stored in a relational database. The netCDF output of model calculations is treated just like the netCDF files from remote sensing observations.
3.5 Metadata
The underlying concept for CODM was to build a data por-tal with a spatiotemporal search processed solely within the metadata. Real data are not accessed before visualisation or download occur. Hence, creation of metadata is crucial for the underlying concept. The automation of data handling, which ranges from data search to data display and data re-trieval, relies on the stored metadata. It is necessary to use a harmonised vocabulary for the names of the observed prop-erties, and this is realised by using CF standard names (Eaton et al., 2010) which are mapped to the originally used no-tations. This is done internally within the metadata struc-ture and ensures a common usage of parameters supplied by the primary data-providing devices. The structure and con-tent of the metadata are critical as they allow joined searches and retrievals of diverse data types. The COSYNA data por-tal, which functions as a system of services, is described in Sect. 3.7. The COSYNA data portal application retrieves data and communicates internally by using metadata, not only for the measured data but also for the sensors used for collecting data. This necessitates that two types of metadata are used within CODM:
1. metadata for describing devices, such as observation platforms with sensors generating environmental data, including numerical models called platform metadata and
2. metadata for describing observations in the coastal sys-tem but also including model runs, called data metadata.
Platform metadata
Webservices
:
plots, maps anddownloads.
CODM
Metadata
ISO and INSPIRE compliant parameter and service oriented
CODM or other portal
(e. g. JavaScript, Ajax, OpenLayers, ...)
Response incl. URLs
Service
Near realtime and archive
RDBMS netCDF
Data
Query
User
interface
WFS
for data discovery.Oracle views
Using metadata URLs about web services
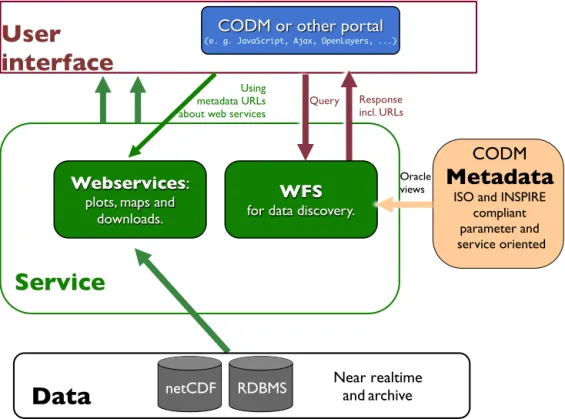
Figure 4.Concept for the interaction between users of the portal, data and metadata. All interaction is done using various web services. The data are stored as netCDF files or as rows in the Relational Database Management System (RDBMS) of Oracle.
properties measured by the sensors; location or, in case of moving platforms, bounding box for the platform; start time and end time of the platform; existing international platform codes and links to external extended metadata.
For numerical models, two groups of parameters are de-fined and described within platform metadata: input param-eters used to force the model as well as output paramparam-eters produced by the model.
The names of the internal parameters used in COSYNA are not harmonised but remain as they were chosen and used originally. A mapping of the original names to a standard-ised vocabulary is needed to ensure a common presentation and analysis of data from different platforms. The concept of parameter mapping is realised by introducing an additional, virtual sensor called selectedparameters as part of the plat-form metadata.
The additional virtual sensor is not existing as a real sen-sor but carries CF standard parameter names which represent the measuring parameters. The observed property names of parameters measured belonging to this sensor are always CF standard names. The internal sensor name and the name of the internal parameter are specified in the parameter descrip-tion.
In the present context, this additional sensor just uses the metadata structure for a sensor to describe the mapping. With the help of this sensor, a user can track the real sensor behind the corresponding CF standard name. This structure thereby
allows for an interrelated search for comparable parameters in the portal, as shown in Fig. 5. A search thus combines various sources of measurements and model output to create an integrated view of data originating from different sources. Data metadata include the start and end time of a measure-ment, the start and end location, graphic previews for the ob-served properties, if available, the person responsible for the data or the metadata and the URLs of web services for visu-alising and downloading the corresponding data. In the case of platforms at fixed positions, the data are described as time series. This means that only one metadata record is needed for the whole time range covered by the platform. If the plat-form supplies data at multiple positions, a metadata record is created for every data set. Data sets may originate from transect measurements, as in the case of data from ships and gliders or a data set may be represented by a single netCDF file. These multiple metadata records are created automati-cally following the procedure outlined in Fig. 3.
The COSYNA metadata are stored in the NOKIS (Lehfeld and Reimers, 2009) metadata system which is INSPIRE18 (INSPIRE, 2007) and ISO19115 (ISO19115, 2003) compli-ant. The structure for platform metadata has been developed within NOKIS. A migration to SensorML metadata (Botts, 2014) is being considered. Such a migration would be
rea-18Infrastructure for Spatial Information in the European
Figure 5.View of the CODM portal with the selected parameter chlorophyllaand a selected time range from April 2009 to May 2009. After
clicking “Select all datasets” the count of data sets for all platforms is shown and automatically selected. OpenStreetMap (OSM) (Coast, 2004) is used as the background map. To keep the portal simple for the users, well-known parameter names are used instead of CF standard names.
sonable if a SensorML profile is developed which is compat-ible with the NOKIS platform profile. The initiative to de-velop such a profile is drawn out of several EU projects, e.g. BRIDGES19, FixO320, Jerico/Jerico-Next21, NeXOS22 and ODIP/ODIP II23.
3.6 Web services
Web services are used to both visualise and to download data. The details of their usage are kept within the metadata for each measurement, allowing the CODM portal not only to link to a web service but to execute the user request and de-liver the data or plot as described in more detail below. Data stored as netCDF files can be downloaded via OPeNDAP24 (Cornillon et al., 2009). If netCDF files correlate with area
19http://www.bridges-h2020.eu/
20http://www.fixo3.eu/
21http://www.jerico-fp7.eu/
22http://www.nexosproject.eu/
23http://www.odip.eu/
24Open source Project for a Network Data Access Protocol
data they can be visualised as OGC WMS25 maps (WMS, 2004) with the help of ncWMS (Blower et al., 2013). In ad-dition, the versatile tool ncWMS is able to create time series plots at selected positions within the represented area of the netCDF file.
The presentation of data from moving platforms, such as FerryBoxes, gliders or ships, needs additional effort. A WMS servlet was coded in Java and added as a web service which produces and presents colour-coded transect maps of the measurements made by moving devices. Parameter plots of time series at fixed platforms can be visualised by web services using an application with direct connection to the COSYNA time series database TSdata. A similar applica-tion is used to build parameter plots for transects. Down-loads for all data stored in the Oracle database are provided through the software PySOS26, an implementation of a sen-sor observation service (OGC SOS) (Na and Pries, 2007) which has been adapted for Oracle. The standard OGC SOS is part of the sensor web enablement framework (OGC SWE)
25OpenGIS® Web Map Service Interface Standard provides a
simple HTTP interface for requesting georegistered map images http://www.opengeospatial.org/standards/wms
Figure 6.Comparison of a chlorophyll map derived from MERIS with FerryBox measurements for the end of April 2009. The MERIS data were deduced following Doerffer and Schiller (2007). The concentrations are computed on a logarithmic scale. FerryBox data are taken from W. Petersen, personal communication, 2012.
(Botts and Reed, 2006) which improves the interoperability between sensors. CODM currently does not use OGC SOS at the sensor tier but rather one abstraction level higher at the database tier.
The web processing service (OGC WPS) (Schut, 2007) PyWPS27 is used to create additional services. For exam-ple, a service which transforms SOS XML output to a hu-man readable ASCII table is provided, as well as a service to plot wave energy against time and frequency for Waverider
27http://pywps.wald.intevation.org/documentation/
3.7 Integration of web services
The COSYNA metadata system is based on NOKIS (Lehfeld and Reimers, 2009). The metadata can be accessed using the catalog service for the web (OGC CSW) (Nebert, 2007). In addition, a catalog service based on a web feature service (OGC WFS) was created, which is optimised to be used as a data discovery service by a data portal. As this metadata ser-vice supplies the URLs to access the corresponding data as downloads, maps or other visualisations, the COSYNA data portal CODM is capable of offering all types of available web services to the users. The diagram in Fig. 4 gives an overview of the portal, its substructure, data access and possible user interactions.
A unique feature of the integration of web services in CODM is the storage of web service URLs in the metadata allowing the direct use of them. Some other approaches such as NOOS28 are storing web service URLs as well but only as general GetCapabilities URLs. These general URLs pro-vide information about the web service but cannot be used to access the data directly. CODM stores URLs which leads to immediate data access as map, plot or numerical down-load. These web service URLs have a static part and a dy-namic part. The dydy-namic URL parameters are defined using an XML description. An example of a web map service is shown in Listing 1.
In general, any data portal may use these mechanisms of building web service URLs. This is depicted in Fig. 4. The user interface could be CODM or another portal. Any portal can access COSYNA data because all the web services are freely accessible. EMODnet physics (Novellino et al., 2014) uses the web services of HF radar stored in CODM to create the web service for visualisation of the currents in the Ger-man Bight29.
CODM provides various search options to its users. The entry point for each refined search is the selection of the de-sired observed property, a time and depth region and a ge-ographic area of interest (Fig. 5). After clicking “Select all datasets”, one of the buttons – “Create map”, “Create plots” or “Downloads” – can be used. This means the requested data are provided with just three clicks. As an example, Fig. 6 shows the output of a click on the “Create map” button for chlorophyll measurements derived from MERIS and Ferry-Box data for the end of April 2009.
CODM can be accessed directly with the URL http:// codm.hzg.de/codm.
The comparison is done with a click on one of the buoys marked on the map. One result for the Waverider buoy near Heligoland is shown in Fig. 9.
28http://www.noos.cc
29http://www.emodnet-physics.eu/map/FeedPlatformInfo.aspx?
id=12179
<mapService> <name>ncWMS</name> <baseurl>
http://codm.hzg.de/ncWMS/wms?REQUEST=GetMap&VERSION=1.3 .0&STYLES=&CRS=CRS:84&WIDTH=256&HEIGHT=256&FORMAT=image /png;mode=32bit&TRANSPARENT=true&LAYERS=11/eastward_vel ocity&BBOX=&elevation=&time=&COLORSCALERANGE=
</baseurl>
<dynamicParameters> <time>
<name>time</name>
<default>2011-12-11T00:04:27.000Z</default> <syntax>yyyy-MM-ddThh:mm:ss.milZ</syntax> </time>
<valueRange>
<name>COLORSCALERANGE</name> <default>-1,1</default> <min /> <max />
<syntax>min,max</syntax> </valueRange>
<bbox>
<name>BBOX</name> <default>
5.91667,53.418142548596116,8.970867584195927,55.2 </default>
<latmin>-180</latmin> <latmax>180</latmax> <lonmin>-90</lonmin> <lonmax>90</lonmax> <syntax>latmin,lonmin,latmax,lonmax</syntax> </bbox>
<depth>
<name>elevation</name> <default>0</default> <syntax>value</syntax> </depth>
<log>
<name>logscale</name> <default>false</default> <possibleValues>
<logarithmic>true</logarithmic> <linear>false</linear>
</possibleValues> </log>
</dynamicParameters> </mapService>
Listing 1.Example XML listing for a WMS request showing the mechanism of web service integration. The element “baseurl” con-tains a GetMap request with some fixed request parameters and some variable request parameters, which are empty in “baseurl”. These variable parameters can be filled in automatically using the name and the syntax in the element “dynamicParameters”.
4 Data level and quality control
qual-Figure 7.COSYNA data downloads since 2015 per category. The category names are self explanatory, with the exception of “Private” which stands for private businesses like fishermen, etc. On the left side, 2015 (blue) stands for the whole year 2015. The other bars are monthly values.
918 G. Br eitbach et. al.: Accessing di v erse data compr ehensi
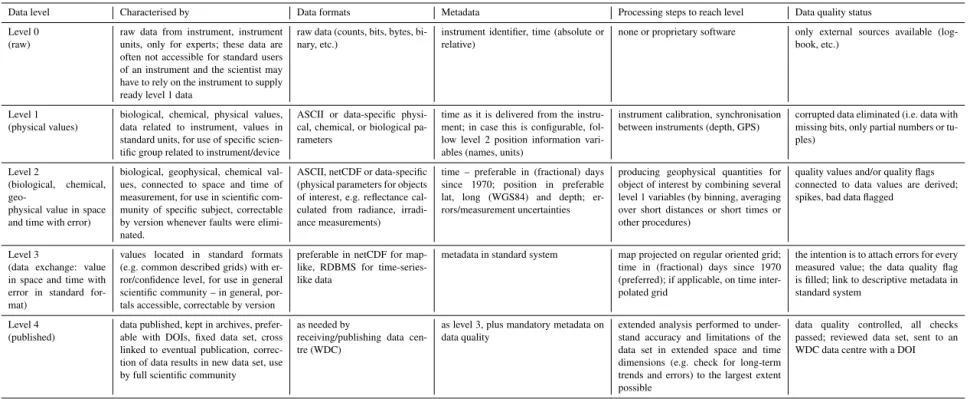
Table 1.Data level definition used in COSYNA based on Parkinson and King (2006) with COSYNA specific expansions. Some aspects, like accuracies, are not presently realised.
Data level Characterised by Data formats Metadata Processing steps to reach level Data quality status
Level 0 (raw)
raw data from instrument, instrument units, only for experts; these data are often not accessible for standard users of an instrument and the scientist may have to rely on the instrument to supply ready level 1 data
raw data (counts, bits, bytes, bi-nary, etc.)
instrument identifier, time (absolute or relative)
none or proprietary software only external sources available
(log-book, etc.)
Level 1 (physical values)
biological, chemical, physical values, data related to instrument, values in standard units, for use of specific scien-tific group related to instrument/device
ASCII or data-specific physi-cal, chemiphysi-cal, or biological pa-rameters
time as it is delivered from the instru-ment; in case this is configurable, fol-low level 2 position information vari-ables (names, units)
instrument calibration, synchronisation between instruments (depth, GPS)
corrupted data eliminated (i.e. data with missing bits, only partial numbers or tu-ples)
Level 2
(biological, chemical,
geo-physical value in space and time with error)
biological, geophysical, chemical val-ues, connected to space and time of measurement, for use in scientific com-munity of specific subject, correctable by version whenever faults were elimi-nated.
ASCII, netCDF or data-specific (physical parameters for objects of interest, e.g. reflectance cal-culated from radiance, irradi-ance measurements)
time – preferable in (fractional) days since 1970; position in preferable lat, long (WGS84) and depth; er-rors/measurement uncertainties
producing geophysical quantities for object of interest by combining several level 1 variables (by binning, averaging over short distances or short times or other procedures)
quality values and/or quality flags connected to data values are derived; spikes, bad data flagged
Level 3
(data exchange: value in space and time with error in standard for-mat)
values located in standard formats (e.g. common described grids) with er-ror/confidence level, for use in general scientific community – in general, por-tals accessible, correctable by version
preferable in netCDF for map-like, RDBMS for time-series-like data
metadata in standard system map projected on regular oriented grid;
time in (fractional) days since 1970 (preferred); if applicable, on time inter-polated grid
the intention is to attach errors for every measured value; the data quality flag is filled; link to descriptive metadata in standard system
Level 4 (published)
data published, kept in archives, prefer-able with DOIs, fixed data set, cross linked to eventual publication, correc-tion of data results in new data set, use by full scientific community
as needed by
receiving/publishing data cen-tre (WDC)
as level 3, plus mandatory metadata on data quality
extended analysis performed to under-stand accuracy and limitations of the data set in extended space and time dimensions (e.g. check for long-term trends and errors) to the largest extent possible
data quality controlled, all checks passed; reviewed data set, sent to an WDC data centre with a DOI
Figure 9.Comparison of the forecast model results (top, A. Behrens, personal communication, 2014) and the measurement of the significant wave height at the Heligoland Waverider buoy during December 2013 (bottom, K. Herklotz, personal communication, 2014).
ity flags is used as a flagging scheme, as shown in Table 2. Externally published data have a final delayed mode qual-ity control and, for example, are published in PANGAEA (Diepenbroek et al., 2002).
5 Data policy and access to CODM
COSYNA supports an open data policy. It is possible to download COSYNA data via CODM. Some guidelines for a fair data use are written in the COSYNA data disclaimer30 which pops up before a download is started.
In addition, COSYNA starts to publish data via the peer-reviewed data journal Earth System Science Data(Carlson and Pfeiffenberger, 2009). This external data publication ap-plies to COSYNA data level 4 with final quality control.
COSYNA data policy stipulates that data access should be unhindered. On the other hand, there has been increas-ing interest from COSYNA fundincreas-ing sources to gather infor-mation on who is accessing and using COSYNA data. This conflict is solved by an open user registration process which defines user accounts completely based on user input without requesting personal information. Only self-defined username and password, country, city and user category are manda-tory inputs. The user category is selected from a predefined
30http://www.coastlab.org/Disclaimer.html
list31. The self-defined username and password combination is needed to access CODM.
The user registration process creates a connection between the user information and the IP number of this user. With ev-ery new login, this connection is renewed. Based on this con-nection, all log files of web service requests and responses can be analysed to gather the information about the usage of CODM. This analysis started in November 2014. The data downloaded per category for the accumulated year 2015 and the first 4 months of 2016 are shown in Fig. 7.
The Science category has most data access requests fol-lowed by the Administration category. Only minor access re-quests stem from the general public. This result is not surpris-ing because the available data and visualisations are target-ing mostly science and administration. To address the general public, a portal is needed with less data variety presented but more explanations and user guidance.
6 Examples
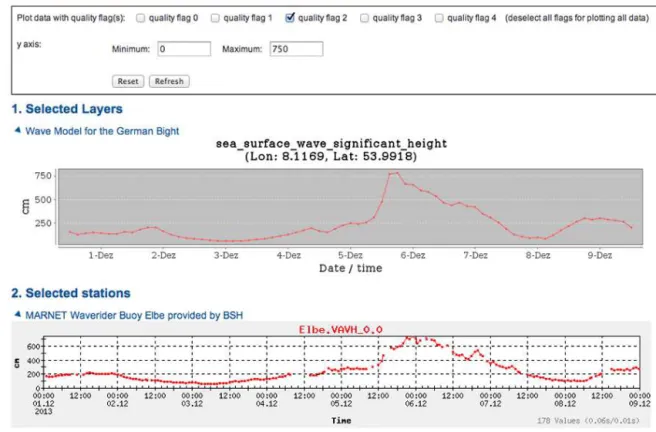
To compare output from the forecast wave model WAM (Behrens, 2009) with observations, data for wave height
dur-31Science, Private Businesses, Industry, Public Administration
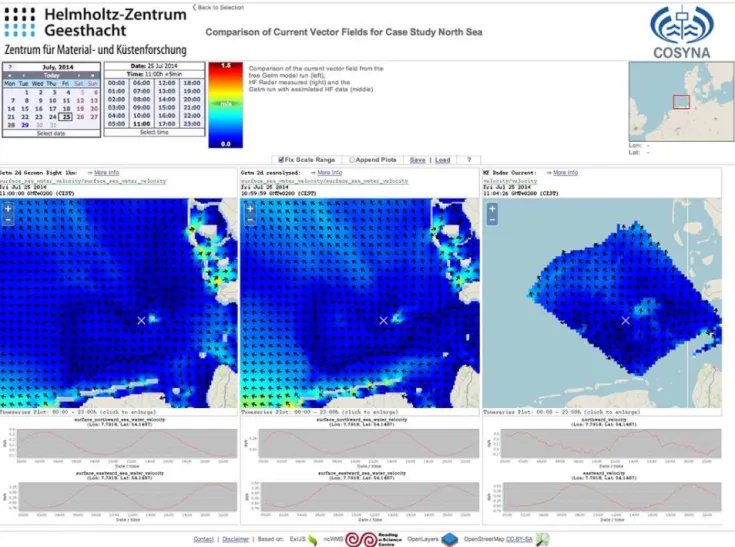
Figure 10. Application comparing results for current vectors from the GETM model run without assimilation (left, J. Staneva, personal communication, 2015), HF radar data (right, J. Hostmann, personal communication, 2015) and HF radar data assimilated into GETM model results (middle, J. Schulz-Stellenfleth, personal communication, 2015). Time series plots of the selected day are shown added below each map. The cross marks the position of the time series.
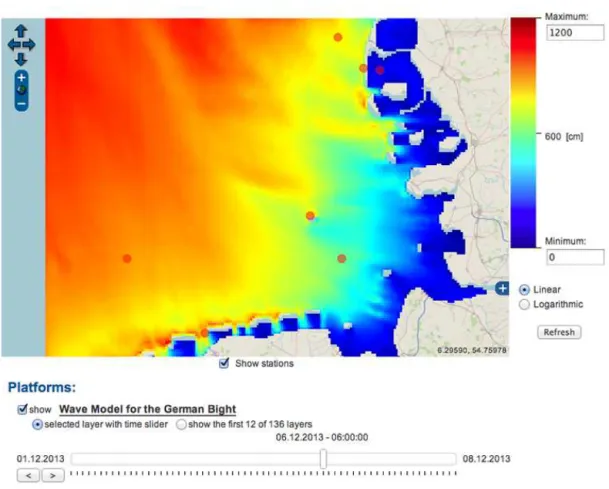
ing a winter storm are shown. The selected time range starts on 1 December 2013 and ends on 8 December 2013. A map of the wave heights from model results during the storm is presented in Fig. 8. In this map, the positions of Waverider buoys are marked as red dots. The comparison is done with a click on one of the buoys marked on the map. One result for the Waverider buoy between Heligoland and the mouth of the Elbe is shown in Fig. 9.
Similarly good matches could be reached at the other mea-surement stations. Because the tools for creating the graphs of the forecast model (ncWMS) and the time series differ, the plot layouts differ slightly.
7 Additional visualisation tools
Although all the objectives mentioned in Sect. 2 could be met by CODM, additional visualisation tools are required to get a more comprehensive view for some data. For example,
comparing measured HF radar data (Seemann et al., 2011) for surface water currents with those of model output for the same parameter using the portal is not a trivial exercise be-cause two or more data sets covering the same area cannot be displayed simultaneously on a single map. To allow such a comparison, a separate web application for data of equal ex-tent was developed. This application uses synchronised maps to visualise data sets for a selected time step. Figure 10 shows the measured HF radar current vector (right map), the GETM model run (left map) and the reanalysed model with assim-ilated data (centre map). Another feature of this tool is the creation of time series plots at a clicked map location. Shown in the lower part of Fig. 10 are the current direction compo-nents for the corresponding data set on the selected date.
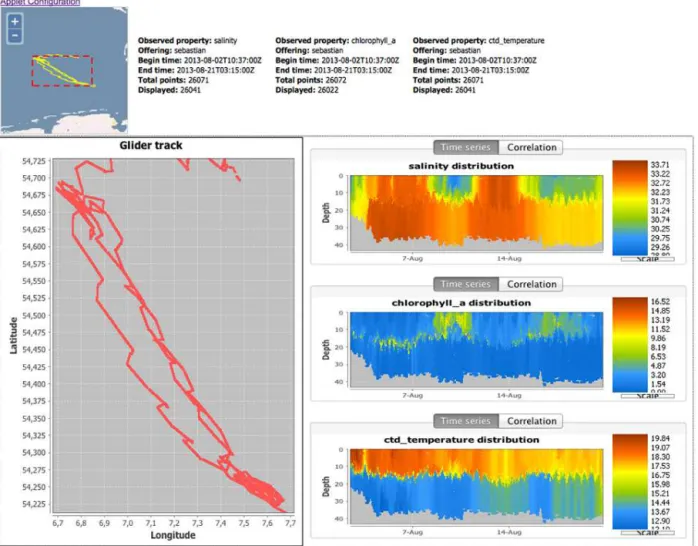
Figure 11.Java applet to visualise glider data in 3-D. Three parameters are selected. It is possible to zoom in on location or time. With “Applet Configuration” other parameters can be selected.
data, it is useful to have a tool to visualise the data in 3-D. A Java applet was built to display the location and the depth dependency of up to three parameters from a glider cam-paign (Fig. 11). The URL for the selected observed property is stored within the metadata similar to that of Listing 1. With this mechanism the tool is accessible as an additional icon from CODM. The further applet processing is independent of CODM. Up to three observed properties can be visualised with the applet. In addition to glider data, the applet can be applied to ScanFish data as well.
8 Conclusions and Outlook
Modern marine observing systems are composed of many different observation devices or platforms. This paper de-scribes an approach for the challenging task of integrating these various observations into one common portal while providing the ability to visualise the data in a concerted way. The CODM data portal demonstrates that it is possible to
integrate heterogeneous observations and model output com-prehensively. Furthermore, an online comparison of a data-independent model, observed data and a data-assimilated model is provided. In addition, a solution for the challeng-ing task of visualischalleng-ing data tracks in 3-D has been developed. This approach has been already realised in the COSYNA data portal CODM32.
CODM is based on web services and metadata. Unique features of this approach are the storing of web service URLs as metadata as well as mapping observed or modelled pa-rameters to standardised names. This enables the portal to present an integrated view and to compare different data sets and methods without any additional effort.
In the future, new platforms with sensors accessed by a system using Sensor Web Enablement (Botts and Reed, 2006) to access the observations will be available. Metadata for these new sensors will be described based on SensorML.
Table 2.Quality flag values used in COSYNA. These are based on SeaDataNet (2010).
Quality flag value
Definition Description
0 no quality
control applied
so far no quality check tests have been performed on this data point
1 good quality all available quality tests indicate that this point is of
good quality
2 probably good
quality
part of the available quality tests indicate that this point has good quality but some minor tests have been not or could not be applied so far; best possible quality flag for real-time data points for which only automatic checks could be applied
3 probably bad
quality
some quality checks failed put this data point has the potential for its quality to be increased
4 bad quality quality checks failed; this data point is not
recon-structible
9 missing data the data value is missing, quality checks could not
be applied
To gain information about usage and user interactions, a registration procedure has been implemented in the portal. Only registered users are able to browse, view and download data. To comply with COSYNA’s open data policy, registra-tion is unrestricted, free of charge and without verificaregistra-tion of the information provided by users.
The COSYNA data portal as well as many COSYNA web services are registered in GEOSS33(Lulla et al., 2014). GEOSS promotes common technical standards enabling data from thousands of different instruments to be combined into coherent data sets. The approach described here makes it eas-ier for any system, such as GEOSS, to integrate many data sources, thus ultimately creating a real earth observation sys-tem.
It would be useful to get a review of different approaches for data management in the observing system. The main fo-cus in such a review should be the interoperability of the data access and the integration into global portals.
A deficit common to all existing approaches is the depen-dency on observation platforms and different data types. It should be possible to integrate all observational data into a common data cube with a time dimension coordinate, three spatial dimension coordinates and one more dimension coor-dinate for the observed property. Such a data cube, with the ability to homogeneously store various observational data, should provide arbitrary cuts in all dimensions in a perfor-mant manner. As a start to realise the vision, it is planned to integrate all COSYNA observations into a data cube in the near future. When results are promising for COSYNA data,
33Global Earth Observation System of Systems
there should be no barrier to consecutively integrate more di-verse data.
Acknowledgements. The authors would like to thank Holger Brix and Frank Sellerhoff for the fruitful discussions about this work. We also acknowledge Desmond Murphy for providing valuable comments and assisting with language editing. This work has been supported through the Coastal Observing System for Northern and Arctic Seas (COSYNA). Various COSYNA partners inside and outside HZG delivered data which are used as examples in this paper.
The article processing charges for this open-access publication were covered by a Research
Centre of the Helmholtz Association.
Edited by: O. Zielinski
Reviewed by: two anonymous referees
References
Baschek, B., Brix, H., Badewien, T., Breitbach, G., Colijn, F., Do-erffer, R., Emeis, K.-C., Eschenbach, C., Friedrich, J., Fischer, P., Garthe, S., Horstmann, J., Ohle, N., Petersen, W., Rieth-mueller, R., Roettgers, R., Schlueter, M., Schroeder, F., Schulz-Stellenfleth, J., Seemann, J., Stanev, E., Winter, C., Wirtz, K., Zielinski, O., and Ziemer, F.: COSYNA – Coastal Observing System for Northern and Arctic Seas, Special Issue, Ocean Sci-ence and BioGeoSciSci-ence, doi:10.5194/os-2016-31, 2016. Behrens, A. and Guenther, H.: Operational wave prediction of
tokhee, A., and Yang, X.: A Web Map Service implementation for the visualization of multidimensional gridded environmental data, Environ. Modell. Software, 47, 218–224, 2013.
Botts, R.: OpenGIS®SensorML: Model and XML Encoding
Stan-dard, https://portal.opengeospatial.org/files/?artifact_id=55939, 2014.
Botts, R. and Reed, D. (Eds.): OGC® Sensor Web
Enable-ment: Overview And High Level Architecture, http://portal. opengeospatial.org/files/?artifact_id=15540, 2006.
Brittain, J. and Darwin, I. F.: Tomcat: the definitive guide at www. books.google.com, 2008.
Carlson, D. and Pfeiffenberger, H.: Earth System Science Data, the data publishing journal, D-Lib Magazine, January/February 2011, Vol. 17, doi:10.1045/january2011-pfeiffenberger, 2009.
Steve Coast: OpenStreetMap, https://www.openstreetmap.org,
2004.
Cornillon, P., Adams, J., Blumenthal, M. B., Chassignet, E., Davis, E., Hankin, S., Kinter, J., Mendelssohn, R., Potemra, J. T., Srini-vasan, A., and Sirott, J.: NVODS and the development of OPeN-DAP, Oceanography, 22, 116–127, 2009.
Diepenbroek, M., Grobe, H., Reinke, M., Schindler, U., Schlitzer, R., Sieger, R., and Wefer, G.: PANGAEA – an information sys-tem for environmental sciences, Comput. Geosci., 28, 1201– 1210, 2002.
Doerffer, R. and Schiller, H.: The MERIS Case 2
wa-ter algorithm, Int. J. Remote Sens., 28, 517–535,
doi:10.1080/01431160600821127, 2007.
Donlon, C. J., Martin, M., Stark, J., Roberts-Jones, J., Fiedler, E., and Wimmer, W.: The Operational Sea Surface Temperature and Sea Ice Analysis (OSTIA) system, Remote Sens. Environ., 116, 140–158, 2012.
Eaton, G., Drach, T., and Hankin, S.: netCDF Climate
and Forecast (CF) Metadata Conventions, Version 1.5,
http://cfconventions.org/Data/cf-conventions/cf-conventions-1. 5/build/cf-conventions.html, 2010.
Geoserver Project: Geoserver, http://docs.geoserver.org/2.4.x/en/ user/index.html, 2001.
INSPIRE: Directive 2007/2/EC of the European Parliament and of the Council of 14 March 2007 establishing an Infrastruc-ture for Spatial Information in the European Community, http://eur-lex.europa.eu/LexUriServ/LexUriServ.do?uri=OJ:L: 2007:108:0001:0014:EN:PDF, 2007.
IOOS Office: US Integrated Ocean Observing System: A Blueprint for Full Capability Version 1.0 http://www.ioos.noaa.gov/library/ us_ioos_blueprint_ver1.pdf, 2010.
ISO 19115: Geographic information – Metadata, http://www.iso. org, 2003.
Lefort, L., Henson, C., and Taylor, K. (Eds.): Semantic Sensor Net-work XG Final Report, http://www.w3.org/2005/Incubator/ssn/ XGR-ssn-20110628/, 2011.
Lehfeldt, R. and Reimers, H.-C.: Informations-Infrastrukturen fuer Nord- und Ostseekueste als Beitrag zu einem Integri-erten Kuestenzonenmanagement. Informations-Infrastrukturen fuer ein Integriertes Kuesteningenieurwesen (03 KIS 049, KFKI) und fuer einen Integrierten Kuestengewaesserschutz (03F0412B, LLUR), Abschlussbericht 1 September 2004– 31 Oktober 2008, http://www.nokis.org/fileadmin/publications/ reports/20090730-03KIS049-Abschlussbericht-1-2.pdf, 2009.
servation System of Systems (GEOSS): a vital source for infor-mation, Geocarto International, 29, 591–591, 2014.
Na, A. and Priest, M.: Sensor observation service, Implementation Standard OGC, http://portal.opengeospatial.org/files/?artifact_ id=26667, 2007.
Nebert, W. and Vretanos, P.: OpenGIS® Catalogue Services
Specification, http://portal.opengeospatial.org/files/?artifact_id= 20555, 2007.
Novellino, A., Gorringe, P., Schaap, D., Pouliquen, S., Rickards, L., and Manzella, G.: European Marine Observation Data Network – EMODnet Physics, IEEE Xplore, 1–3, ISBN: 978-1-4799-5707-1, INSPEC Accession Number: 14562592, 2014.
Parkinson, C. L., Ward, A., and King, M. D. (Eds.): Earth Science Reference Handbook – A Guide to NASA’s Earth Science Program and Earth Observing Satellite Missions, National Aeronautics and Space Administration Washing-ton, DC, available at: http://eospso.gsfc.nasa.gov/ftp_docs/ 2006ReferenceHandbook.pdf, 2006.
Porter, D. E., Dorton, J., Leonard, L., Kelsey, H., Ramage, D., Cothran, J., Jones, A., Galvarino, C., Subramanian, V., andHer-nandez, D.: Integration Environmental Monitoring and Observ-ing Systems in Support of Science To Inform Decision-MakObserv-ing, in: Case Studies for the Southeast, edited by: Liu, Y., Kerkering, H., and Weisberg, R. H., Coastal Observing Systems, Elsevier, ISBN: 978-0-12-802022-7, 416–428 2015.
Rew, R. and Davis, G.: NetCDF: an interface for scientific data access in Computer Graphics and Applications, IEEE, 10, 4, doi:10.1109/38.56302, 1990.
Schut, P. (Ed.): OpenGIS®Web Processing Service, Open
Geospa-tial Consortium, Wayland, MA, USA, 2007.
SeaDataNet: Standards for Data Quality Control, http://www. seadatanet.org/standards_software/data_quality_control, 2010. Seemann, J., Ziemer, F., Gurgel, K. W., Schlick, T., and Voulgaris,
G.: Hf Radar Based Current Observation System In The German Bight, Ieee – Oceans Spain Book Series, OCEANS-IEEE Pub-lished, 2011.
Stanev, E. V., Schulz-Stellenfleth, J., Staneva, J., Grayek, S., See-mann, J., and Petersen, W.: Coastal observing and forecasting system for the German Bight – estimates of hydrophysical states, Ocean Sci., 7, 569–583, doi:10.5194/os-7-569-2011, 2011. Stips, A., Bolding, K., Pohlmann, T., and Burchard, H.: Simulating
the temporal and spatial dynamics of the North Sea using the new model GETM (general estuarine transport model), Ocean Dynam., 54, 266–283, 2004.
Trull, T. W., Schulz, E., Bray, S. G., Pender, L., McLaugh-lan, D., Tilbrook, B., Rosenberg, M., and Lynch, T.: The Australian Integrated Marine Observing System Southern Ocean Time Series facility, OCEANS, IEEE, Sydney, 24– 27 May 2010, http://ieeexplore.ieee.org/stamp/stamp.jsp?tp= &arnumber=5603514, 2010.
Vretanos, P. A.: OpenGIS®Web Feature Service Implementation
Specification, http://portal.opengeospatial.org/files/?artifact_id= 7176, 2002.