*Corresponding author, : [email protected]; +385 1 6168 222; *KNI – FSB, I. Lučića 5, HR – 10 000 Zagreb, Croatia
*
ERROR DETECTION ANALYSIS OF AIRCRAFT
INFORMATION-COMMUNICATION SYSTEM
USING INFORMATION ENTROPY
Erna Fučić*
c/o University of Zagreb – Faculty of Mechanical Engineering and Naval Architecture Zagreb, Croatia
DOI: 10.7906/indecs.14.1.8 Regular article
Received: 9 November 2015. Accepted: 19 January 2016.
ABSTRACT
Contemporary transport aircraft information-communication system is extremely sophisticated. The aim of the current study is to give contribution to the current knowledge of information entropy, and to show how its alteration could indicate possible errors, which may lead to preventing future aircraft calamities. In this study a principle model of such system is described, consisting of two peripheral, sensory units and their central, processing units, upon which a numerical simulation is carried out. Two states of the system are defined – states of regular and irregular dynamics. Data transfer between system elements is defined through information entropy, whose average change and accompanying standard deviation shows the difference between the regular and non-regular state. When introducing an error of the same kind upon each of the sensors, the type of results corresponds to a sufficiently intensive deviation, which may make error detection by information entropy analysis possible.
KEY WORDS
information entropy, aircraft information-communication system, error analysis
CLASSIFICATION
INTRODUCTION
Contemporary transport aircraft information-communication system is exceedingly sophisticated, consisting of arrays of intertwined elements, combined in several hierarchy levels. Complexity of the system’s structure, high reliability demands and the necessity to control data acquired about the aircraft’s state and environment does requires thorough validation [1, 2]. Although the flow of data between elements is steady and regulated, there is a probability of error occurrence in every 109 flight hours, which may lead to catastrophic consequences [3, 4].
The important part of the model featured in this article, is the capability of error detection and tracing to the ultimate cause. However, this is possible for errors which are larger than corresponding thresholds. It is opportune to check whether a class of errors exists which can be detected below thresholds, owing to a particular way of how they modify data flow in the aircraft information-communication system.
The article [5] describes a numerical simulation of a model which consists of a peripheral, sensory unit and a central, processing unit. Two states of the system are defined – states of regular and irregular dynamics, which are numerically simulated.
The hypothesis is stated as follows: a certain portion of deviation from regular state is characterized by a specific dynamics. Deviations are realised as variations, acceptable to a certain degree. Shortly, they grow above limits set by protocols, which sets off detection of irregular state and corrective measures are applied. This dynamic has a specific feature – there is a portion of time during which deviations grow, which creates possibility to record phases of growth.
Thus, it is stated in [5] that recorded deviations significantly change the statistic flow of data within a system, which seems to be recognisable in changes of accompanied information entropy [6]. The implicit assumption is that a single error is the cause of all systems deviations. A generic level of aircraft information-communication system is defined, in which the difference between the state of regular and the state of irregular dynamics is expressed in terms of average information entropy change, with accompanying standard deviation. The model consists of only one sensory system, one electronic data transmitter, one central (processing) unit and a protocol for data transmission, such as ARINC 429 [7] which details the frequency of data sampling. The sensor is one Pitot tube, and the type of measured data is the aircraft’s indicated airspeed (IAS) [5].
This article further develops the hypothesis from [5] by taking into account two measured data, taking the aircraft angle of attack (AoA) into account, and the aircraft’s indicated airspeed. This gives an improved insight about the changes of information entropy when deviations occur, but are relatively small within set of data from one sensor.
The model of data analysis is taken from [5], and in further sections initial data values will be defined, along with the differentiation of the regular/irregular states through average information entropy change and related standard deviation. The results are discussed, and a conclusion is given.
MODEL
82
identified as discrete. Since the accumulation of data is also discrete, therefore, time sampling is not differentiated from the count number of a specific data. The aircraft is deemed to fly horizontally at a constant total speed, in a static atmosphere. The assumption of numerous, unconnected, and minuscule causes that affect speed variation, leads to formulating the distribution of indicated airspeed in time steps, as random variable which follows normal (Gauss) distribution whose mean is a pre-set IAS, with the estimated standard deviation. Similar reasoning applies to the sampling of angle of attack as well. The pre-set cruising IAS is 450 kt, and AoA is 5⁰, therefore quantifying data as in Table 1.
Table 1. Referent data.
Indicated airspeed x
(450 ± 4,5) kt
Angle of attack y
(5 ± 0,45)
For both regular, irregular state, and combined sensors, the model of data analysis is defined according to [6]. Shannon defined information entropy H of a discrete random variable x in a final set of numbers χ, whose probability distribution function is p(x):
xx
p
x
p
x
H
(
)
(
)
log
2(
)
. (1)For each sensor there is an estimated number of data values categories. The number of each value’s occurence is counted, which results with frequency values. Then, the ratio of those frequencies over sum of all frequencies are calculated, resulting with entropy values (bit) for each of N iterations.
Mean entropy value H and corresponding standard deviation σH are respectively:
N i iH
N
H
11
, (2)
N i iH
H
H
N
12
1
. (3)Irregular state occurs on both sensors, and is defined as follows:
.
,
,
,
reg reg reg irregx
x
x
x
x
x
x
G G G. (4)
.
,
,
,
reg reg reg irreg G G Gy
y
y
y
y
y
y
. (5)When combining the two sensors, who have a different sensitivity threshold, a proportional factor k = 100 is assigned
0
)
(
)
(
x
G
x
k
y
G
y
. (6)Table 2. Notations for limits of intervals.
1. category indicated airspeed 1. category AoA
Based on the generated data, one constructs the probabilty function upon previus steps, according to equations (1)-(3).
INDEPENDANT SENSORS Regular state
The computation is done with Microsoft Excel’s statistical packet, in N = 10 iterations, each containing 300 randomly generated numbers. These are arranged into 60 categories: for indicated airspeed as shown in Figures 1 and 2.
Figure 1. Histogram of 300 values of IAS, for one iteration, in regular state.
Figure 2. Histogram of 300 values of AoA, for one iteration, in regular state.
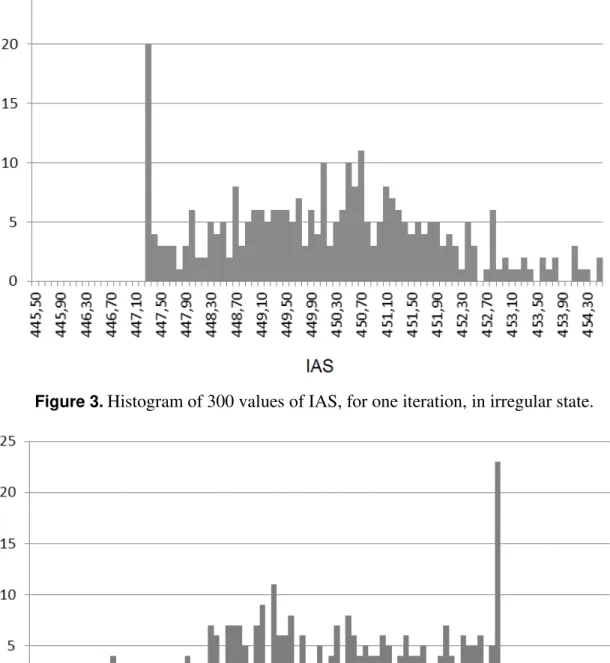
Irregular state
84
Figure 3.Histogram of 300 values of IAS, for one iteration, in irregular state.
Figure 4.Histogram of 300 values of AoA, for one iteration, in irregular state.
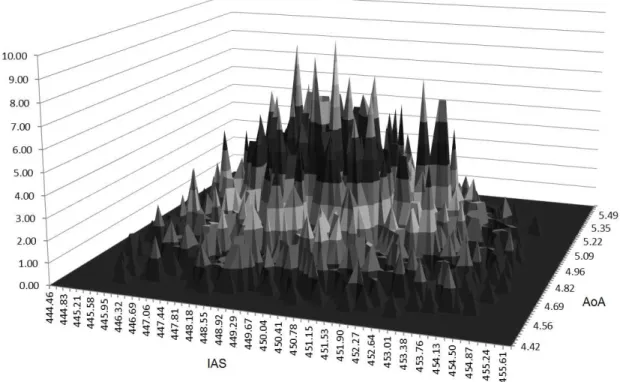
COMBINED SENSORS
Histogram of a typical distibution of combined values is shown in Figure 5.
RESULTS
Figure 5. The frequency distribution upon combined values of IAS and AoA.
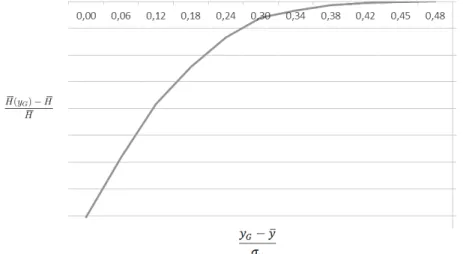
The change of information entropy’s mean value is shown in Figures 6 and 7, where the ordinate contains the ratio of mean information entropy change. The abscissa on those figures presents the relative deviation of indicated airspeed (Fig. 6), or AoA (Fig. 7), scaled with standard deviation for regular state.
This type of results corresponds to a sufficiently intensive deviation as in [5], which may make error detection by information entropy analysis possible. According to the results, in case of error occurring in either of sensors, information entropy analysis may be able to detect it, despite the difference between the kind of data and method of data sampling (IAS and AoA).
Table 3.Average entropy values for system’s regular state.
indicated airspeed Hx = (6,01 ± 0,09) bit angle of attack Hy = (6,02 ± 0.01) bit
Table 4.Average entropy values for system’s irregular state.
indicated airspeed Hx, irreg= (5,73 ± 0.14) bit angle of attack Hy, irreg =(5,83 ± 0.09) bit
86
Furthermore, after combining the two sensors, it is possible to show the change in mean information entropy by evaluating one of the combined sensors. It does not matter which sensor is chosen for this computation and display, because the trend of mean information entropy will remain the same in both cases, due to the correlation of the two sensors stated in (6). Specifically, AoA values are chosen, and the mean information entropy change is shown in Figure 8.
Generated information entropy value, for non-regular state expressed through AoA is HCG = (13,660 ± 0,004) bit.
The histogram in Figure 8 shows a corresponding trend in relative entropy change, for combined sensors, to the one shown in Figures 6 and 7. This supports the conclusion that error detection by information entropy analysis may be possible, in this case even for two combined sensors.
Figure 7. Relative entropy as a function of scaled error, for angle of attack.
Figure 8. Relative entropy depending on scaled error, for combined sensors, expressed
through AoA.
SUMMARY AND CONCLUSION
working state, and combined working state. When introducing an error of the same kind upon each of the sensors, the type of results correspond to a sufficiently intensive deviation, which may make error detection by information entropy analysis possible. According to the results,in case of error occuring in either of sensors, as well as an error occuring in combined sensors, information entropy analysis may be able to detect it, despite the difference between the kind of data and method of data sampling (IAS and AoA).
All of the results for regular state of sensor functioning are based upon presumed Gauss distribution, whereas one can argue that non-regular state of sensor functioning would not produce data in such normal distribution. Therefore, comparing the results od information entropy values produced by regular and non-regular state of sensor functioning must be considered as a strictly rough estimation.
While this article takes two varibles into account, it must be emphasized that by analysing several variables originating from different sensors, their deviation growth would take a longer period of time, along with the possibilty of their detection. This should not be an obstacle, because by widening the number of influencing parameters, one may expect a better perception of how an extremely complex information-communication aircraft system would behave when an error occurs. This could advance the current knowledge of associated information entropy, and how its alteration could indicate possible errors, which may bring about preventing future aircraft calamities.
ACKNOWLEDGMENTS
Author thanks to Josip Stepanić for support and valuable comments during the manuscript preparation, and Damjan Dorocić for discussions.
REFERENCES
[1] Spitzer, C.R.: Avionics: Development and Implementation.
CRS Press, New York, 2006,
[2] Ćosić, J. andStepanić, J.: Case Study in Innovation Diffusion: Aircraft Electrical System.
In: Bohanec, M. et al., eds: Proceedings of the 14th International Multiconference “Information Society”. Ljubljana, 2011,
[3] Spitzer, C.R.: Setting Requirements.
In: Spitzer, C.R., ed.: The Avionics Handbook. CRC Press, Ch.19.1, 2001,
[4] McCormick, F.: Certification of Civil Avionics.
In: Spitzer, C.R., ed.: The Avionics Handbook. CRC Press, Ch.23.6, 2001,
[5] Posavec, M.; Cerin, I. and Stepanić, J.: Modelling the Flaw Detection in an Information System using Information Entropy.
Technical Journal 7(2), 142-147, 2013,
[6] Sinković, V.: Information, Semiotics and Semantics. In Croatian. Školska knjiga, Zagreb, 1997,
[7] ARINC Inc.: ARINC Specification 429 Part 1-17.