Elevation of SIPL1 (SHARPIN) Increases
Breast Cancer Risk
Jason De Melo1,2,3, Damu Tang1,2,3*
1Division of Nephrology, Department of Medicine, McMaster University, Ontario, Canada,2Father Sean O’Sullivan Research Institute, Ontario, Canada,3The Hamilton Center for Kidney Research, St. Joseph’s Hospital, Hamilton, Ontario, Canada
Abstract
SIPL1 (Sharpin) or Sharpin plays a role in tumorigenesis. However, its involvement in breast cancer tumorigenesis remains largely unknown. To investigate this issue, we have systemi-cally analyzedSIPL1gene amplification and expression data available from Oncomine datasets, which were derived from 17 studies and contained approximately 20,000 genes, 3438 breast cancer cases, and 228 normal individuals. We found aSIPL1gene amplifica-tion in invasive ductal breast cancers compared to normal breast tissues and a significant elevation of SIPL1 mRNA in breast cancers in comparison to non-tumor breast tissues. These results collectively reveal that increases in SIPL1 expression occur during breast cancer tumorigenesis. To further investigate this association, we observed increases in the
SIPL1gene and mRNA in the breast cancer subtypes of estrogen receptor (ER)+, proges-terone receptor (PR)+, HER2+, or triple negative. Additionally, a gain of theSIPL1gene cor-related with breast cancer grade and the levels of SIPL1 mRNA associated with both breast cancer stages and grades. Elevation ofSIPL1gene copy and mRNA is linked to a decrease in patient survival, especially for those with PR+, ER+, or HER2- breast cancers. These re-sults are supported by our analysis of SIPL1 protein expression using a tissue microarray containing 224 breast cancer cases, in which higher levels of SIPL1 relate to ER+ and PR+ tumors and AKT activation. Furthermore, we were able to show that progesterone signifi-cantly reduced SIPL1 mRNA and protein expression in MCF7 cells. As progesterone en-hances breast cancer tumorigenesis in a context dependent manner, inhibition of SIPL1 expression may contribute to progesterone's non-tumorigenic function which might be countered by SIPL1 upregulation. Taken together, we demonstrate a positive correlation of SIPL1 with BC tumorigenesis.
Introduction
SIPL1 (Shank-Interacting Protein-Like 1), also known as Sharpin (Shank-associated RH do-main interacting protein), was identified in 2001 as a Shank-binding protein in the postsynap-tic density and later in 2003 was reported shown to be expressed in the gastric fundus [1,2].
OPEN ACCESS
Citation:De Melo J, Tang D (2015) Elevation of SIPL1 (SHARPIN) Increases Breast Cancer Risk. PLoS ONE 10(5): e0127546. doi:10.1371/journal. pone.0127546
Academic Editor:Yves St-Pierre, INRS, CANADA
Received:May 16, 2014
Accepted:April 16, 2015
Published:May 19, 2015
Copyright:© 2015 De Melo, Tang. This is an open access article distributed under the terms of the
Creative Commons Attribution License, which permits unrestricted use, distribution, and reproduction in any medium, provided the original author and source are credited.
Data Availability Statement:All relevant data are within the paper and its Supporting Information files.
Funding:This work was supported by a Canadian Institute of Health Research (CIHR) grant (COP–
107971) to D. Tang.
SIPL1/Sharpin is a major component of an E3 ubiquitin-protein ligase complex, the linear ubi-quitin chain assembly complex (LUBAC); the complex consists of HOIL-1, HOIP, and SIPL1/ Sharpin, and adds a linear polyubiquitin chain to protein substrates [3–7]. The most thorough-ly investigated function of SIPL1/Sharpin is the modification of NEMO, an adaptor protein fa-cilitating NF-κB activation, via linear polyubiquitination, resulting in NF-κB activation [8]. In accordance with the essential roles of NF-κB signalling in the immune system, loss of SIPL1/ Sharpin compromises a variety of immunoreactions [9–11], and causes chronic proliferative dermatitis in mice, which is largely attributable to abnormalities in the inflammatory response [3,5,7,12].
The essential contribution of SIPL1 to the activation of NF-κB support the possibility that SIPL1 promotes tumorigenesis, as NF-κB signalling possesses well-demonstrated tumorigenic properties [13]. This prospect is further supported by SIPL1/Sharpin-mediated suppression of apoptosis in keratinocytes and hepatocytes [14,15], and repression of cisplatin, a widely-used drug in cancer therapy, induced apoptosis [16]. Additionally, SIPL1 promotes the migration of CHO cellsin vitroand lymphocytes in vivo, and enhances the lung metastasis of osteosarcoma
in vivo(in immunocompromised mice) [10,17,18]. Upregulation of SIPL1 was observed in ovarian cancer, renal cell carcinoma, and cervical cancer [17,19,20]. Furthermore, SIPL1 was reported to inhibit PTEN via a physical interaction [20]. Collectively, evidence demonstrates a role of SIPL1 in promoting tumorigenesis.
Whether SIPL1 plays a role in breast cancer (BC) tumorigenesis remains unknown. BC is the most common malignancy diagnosed and the second leading cause of cancer-related deaths in women [21]. BC is a highly heterogeneous group of diseases, which can express ER (ER+), PR (PR+), HER2+, or none of them (ER-, PR-, and HER2-/triple negative) [22]. The HER2+ and triple negative (TN) BCs have poor outcomes [21,23] and comprise 20–25% and 10–25% of the reported cases, respectively [24–27].
To study a possible association of SIPL1 and BC tumorigenesis, we have taken advantage of the rich resources of cancer genome data and gene expression profiles deposited in the Onco-mine database, and thoroughly analyzed the association of SIPL1 gene amplification and ex-pression during BC tumorigenesis. This analysis together with our studies of the SIPL1 protein in primary BCs reveals a positive correlation of SIPL1 with BC tumorigenesis.
Materials and Methods
Tissue microarray immunohistochemistry
A breast cancer tissue microarray (TMA) was obtained from the Cancer Diagnosis Program (formerly the Cooperative Breast Cancer Tissue Resource; CBCTR) which is funded by the Na-tional Cancer Institute [28]. The TMA was organized to examine markers associated with BC progression, and contained 239 breast carcinomas, including 80 cases each for node negative and positive tumor tissues and 79 cases of distant metastatic BC cancers. There was no follow-up information available for these patients.
The slides were first deparaffinized and rehydrated using successive washes in Xylene and EtOH baths. The slides were then heat treated in a sodium citrate buffer (10 mM) for 20 min-utes in a food steamer. The slides were blocked using a buffer containing goat serum, and incu-bated with anti-SIPL1 antibody (1:100) [20] or anti-AKT pS473 (1:100, Rockland
counterstained with Haematoxylin (Sigma Aldrich, Oakville, ON). The staining was repeated in duplicate.
The slides were scanned at the Advanced Optical Microscopy Facility (AOMF) at the Uni-versity of Toronto using a ScanScope. All slide images were analyzed using ImageScope soft-ware (Leica Microsystems Inc., Concord, ON). All cores were visually examined. Damaged cores were excluded, leaving 206 total cancer samples in the analysis. The intensity values ob-tained from the Imagescope software after analyses were converted to an HScore using the for-mula [HScore = (% Positive) x (intensity) + 1] [20]. The HScore was normalized using a background subtraction and averaged between the two replicates. The TMA contained MCF10A cells. Based on our western blot analysis of SIPL1 and pAKT expression in various breast cancer cells lines (data not shown), MCF10A cells were found to express low levels of both events. With this understanding, we determined the respective average HScore for SIPL1 and pAKT in the MCF10A cores of our TMA. These scores were subsequently used as a respec-tive threshold to define the status (posirespec-tive versus negarespec-tive) of SIPL1 and pAKT in TMA tis-sues. All tissue cores classified as positive and negative were confirmed by visual inspection.
Cell culture
MCF7 cells were obtained from American Type Culture Collection (ATCC; Manassas, VA), and cultured in DMEM media supplemented with 10% Foetal Bovine Serum (FBS; Sigma Al-drich; Oakville, ON) and 1% Penicillin-Streptomycin (Life Technologies; Burlington, ON). Prior to hormone treatment the cells were washed with PBS three times and grown in phenol-red free DMEM (GE Healthcare; Logan, Utah) supplemented with 5% dextran-charcoal treated FBS (Life Technologies; Burlington, ON); and 1% Penicillin-Streptomycin for 72 hours. The cells were treated with 10 nM 17β-estradiol (E2; Sigma Aldrich; Oakville, ON), a combination of 10 nM E2 and 10 nM progesterone (P4; Sigma Aldrich; Oakville, ON) or a vehicle control (EtOH) for 24 hours.
Real-time PCR analysis
After treatment with the respective hormones, the cells were lysed and total RNA was collected using TRIzol (Life Technologies, Burlington, ON) following the manufacturers protocol. Re-verse transcription and qRT-PCR was carried out as previously described [29]. Briefly, 2μg of
RNA was converted to cDNA, followed by qRT-PCR, where 1μL of cDNA was used in each
re-action. Real time PCR primers used for actin (Forward: 5’- ACC GAG CGC GGC TAC AG -3’; Reverse: 5’- CTT AAT GTC ACG CAC GAT TTC C -3’), SIPL1 (Forward: 5’- GCT ATT GCA GGT GGA GAC GA -3’; Reverse: 5’- GCC TCC TGA AGC TGA ACA CT -3’), BCL2 (For-ward: 5’- GGT GGG GTC ATG TGT GTG G -3’; Reverse: 5’- CGG TTC AGG TAC TCA GTC ATC C -3’) and MYC (Forward: 5’- GGC TCC TGG CAA AAG GTC A -3’; Reverse: 5’- CTG CGT AGT TGT GCT GAT GT -3’).
Western blot analysis
Western blot analysis was carried out using our established protocol [29]. Briefly, 50μg of
Oncomine
Oncomine (Compendia Bioscience, Ann Arbor, MI;www.onocomine.org) is an online data-base consisting of previously published and publicly available microarray data. Using the search term“SIPL1”and isolating for datasets representing Ductal Breast Carcinoma and Inva-sive Ductal Breast Carcinoma, we identified 21 datasets which contained DNA or RNA expres-sion data. Four datasets did not contain information relevant to this study and were thus excluded. The detailed dataset information was exported and analyzed in terms of clinical-pathological information and SIPL1 expression. The follow-up period for these patients was up to 25 years with an average of 8–10 years.
Seven datasets contained normal breast tissue controls and these were used to compare the expression of SIPL1 in normal and cancer tissues. In order to score cancers as SIPL1 posi-tive (high expression) or SIPL1 negaposi-tive (low expression), the Log2 Median-Centered ratio, as reported in the Oncomine database, for all the normal samples in a particular dataset were averaged. RNA expression values above and below this average were considered SIPL1 posi-tive and negaposi-tive, respecposi-tively. Likewise, for the DNA copy number data, the Log2 copy num-ber units reported in Oncomine were converted to a copy numnum-ber value using the formula [2 x 2(Log2 Copy Number Value)]. Values above 2 were considered to be SIPL1 positive (SIPL1 amplified) and those below were considered to be SIPL1 negative (no SIPL1 amplification).
Statistical analysis
All statistical analysis was carried out using GraphPad Prism 5 software. Ap<0.05 was
consid-ered statistically significant.
Results
Amplification of the
SIPL1
gene in breast cancer
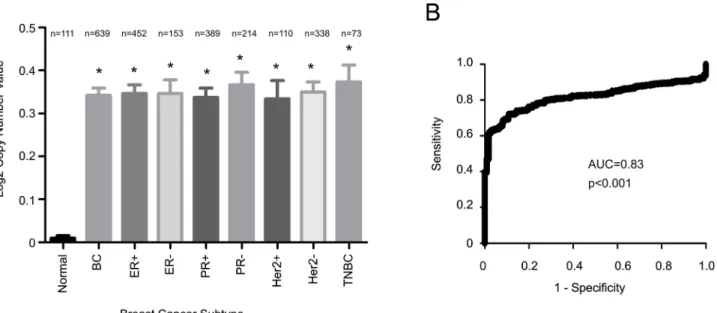
The SIPL1 gene is located at 8q24.3, a region that is gained (or amplified) in 40% of breast can-cers [30–35], indicating a possible gain of theSIPL1gene during the course of the disease. The recent characterization of many cancer genomes has accumulated a rich source of data regard-ing aneuploidy, copy number variations, and somatic mutations. This information has been de-posited into the Oncomine database. In taking advantage of the characterized genome for 639 breast cancers and 111 normal controls, we observed increases of theSIPL1gene copy number in breast cancer in comparison to normal breast tissues, and this gain was detected in all sub-types of breast carcinomas, including those of ER+, ER-, PR+, PR-, HER2+, and triple negative (Fig 1A). Additionally, receiver-operating characteristic (ROC) analysis shows that SIPL1 gene amplification is able to differentiate BC from benign breast tissues (Fig 1B).
Upregulation of SIPL1 mRNA in breast cancer
Elevation of SIPL1 expression correlates with breast cancer progression
Cancer progression is commonly measured by staging (Tumour stage I, II, III, IV) and grading (Grade 1, 2, 3) [36]. The above observations of increasedSIPL1gene copy and upregulation of SIPL1 mRNA suggest that these alterations may associate with breast cancer progression. To determine this possibility, we analyzed the variations of theSIPL1gene copy number in three Oncomine datasets (Table 1).SIPL1gene copy number (GCN) increases associated with grad-ing in the Curtis dataset but not in the Nikolsky dataset (Table 1). As the size of patient popula-tion in the Curtis dataset was more than 13 fold larger than it in the Nikolsky dataset, we preferred a positive correlation between an increase inSIPL1GCN and advancing BC grade. Although increases inSIPL1GCN were not significantly associated with BC staging in the Cur-tis dataset, a significant association could be established in the TCGA dataset (Table 1). A likely cause for this discrepancy is attributable to the limited number of stage III (n = 69) and stage IV (n = 9) tumors among the 1556 total cases in the Curtis dataset. Despite the TCGA dataset containing fewer than half of total BC cases in the Curtis dataset (Table 1), it had 138 stage III and 14 stage IV cases among its population of 639 tumours (Table 1). To attempt to compen-sate for the low number of advanced cases in the Curtis dataset, we performed a statistical anal-ysis on stage I+II vs. stage III+IV cancers; this resulted in a decrease of thep-value from 0.437 (Table 1) to 0.1827. The same analysis also decreased thep-value from 0.016 (Table 1) to 0.0039 for the TCGA dataset. This analysis thus supports the likelihood that the Curtis dataset does not have a sufficient number of higher stage tumors to determine an association between increasedSIPL1GCN and advancing BC stage. Collectively, the available evidence as a whole supports a correlation betweenSIPL1gene amplification and breast cancer progression.
In accordance with this possibility, the examination of SIPL1 mRNA levels in 16 datasets of Oncomine containing 3127 cases (Table 2) indicates that upregulation of SIPL1 mRNA signifi-cantly associates with breast cancer staging and grading based on the data presented in the Curtis study, which is the largest dataset (Table 2). While a reduction of SIPL1 mRNA in stage
Fig 1. Amplification of SIPL1 in breast cancer.Data from the TCGA 2 dataset was extracted from Oncomine (Compendia Bioscience, Ann Arbor, MI) and analyzed with respect to SIPL1 gene copy number variation (GCN) in cancer vs. normal tissues. Statistical analysis was conducted using an unpaired, two-tailed, welch-corrected t-test. Asterisks indicate p<0.0001 in comparison the normal breast tissues. A Log2 copy number unit of 0 equates to a gene copy
number of 2 (A). (B) A receiver-operating characteristic (ROC) curve of normal versus primary breast cancer was calculated based the data extracted from the TCGA dataset. AUC: area under the curve.
IV breast cancers was observed in the largest dataset (Curtis), only 8 cases of stage IV tumors were included versus the large number of tumors of other stages (n = 257 for stage I, n = 446 for stage II, and n = 69 for stage III tumors) and called for precautious in interpretation of this decrease. Nonetheless, the results generally support a positive association between SIPL1 mRNA levels and breast cancer progression. This association is also consistent with the exami-nation of the relationship betweenSIPL1gene copy number and breast cancer progression, in which amplification of theSIPL1gene associates with breast cancer grading within this same study (Table 1). Similar observations were also obtained using the TCGA datasets, as SIPL1 mRNA levels correlate with breast cancer staging (Table 2) as do the gains of theSIPL1gene (Table 1). However, this correlation was not observed in most of smaller studies (Table 2).
Fig 2. Increases in SIPL1 mRNA in breast cancer.Data from the Curtis (A) and TCGA datasets (B) were extracted from Oncomine and analyzed with respect to SIPL1 mRNA expression in cancer vs. normal tissues. Statistical Analysis was conducted using an unpaired, two-tailed, welch-corrected t-test. Asterisks indicate p<0.0001 in comparison the normal breast tissues. (C), (D) A receiver-operating characteristic (ROC) curve of normal versus primary
breast cancer was calculated based the data extracted from the Curtis dataset (C) and the TCGA dataset (D).
Taken together, available data reveals a linkage between SIPL1 expression and breast cancer progression.
SIPL1 expression predicts reduction in the survival of patients with ER
+ or PR+ breast cancers
To consolidate the association of SIPL1 upregulation (gene copy number increases and mRNA elevation) with BC progression, we have analyzed the relationship between BC patients’ surviv-al with eitherSIPL1gene copy number or SIPL1 mRNA levels using the Curtis dataset which contains 816 surviving patients with breast cancer and 429 patients who died from the disease (Table 3). In comparison to the survivors, those who died of breast cancer displayed a signifi-cantly higher gain of theSILP1gene and increase in theSIPL1mRNA (Table 3). Further
Table 1. SIPL1 DNA copy number variation (CNV) in ductal breast carcinoma.
Stage Grade
Dataset BCa Cases I II III IV pc 1 2 3 p Ref.
Curtis 2 Ductal 1556 0.144b 0.159 0.196 0.214 0.4370 0.075 0.11 0.18
<0.0001 [58]
Nikolsky Ductal 115 0.228 -0.029 0.057 0.2181 [66]
TCGA 2 Ductal 639 0.296 0.316 0.439 0.39 0.016
a
Invasive ductal carcinoma
bThe Log2 copy number units reported within Oncomine, a Log2 copy number unit of 0 is converted to a gene copy number value of 2 according to the formula 2 X 2(Log2 Copy Number Units)
c
Statistical analysis was conducted using a One-Way ANOVA.
doi:10.1371/journal.pone.0127546.t001
Table 2. SIPL1 mRNA Expression in Ductal Breast Carcinoma.
Stage Grade
Dataset BCa Cases I II III IV pc 1 2 3 p Ref.
Bittner Ductal 161 0.918b 1.424 1.417 1.591 0.0357 0.729 1.304 1.445 0.0016
Bonnefoi Ductal 112 2.805 2.48 2.49 0.506 [67]
Curtis Ductal 1556 1.396 1.493 1.528 1.396 0.0198 1.385 1.454 1.52 0.0018 [58]
Desmedt Ductal 158 0.325 0.65 0.707 0.1221 [68]
Esserman Ductal 93 -0.036 -0.33 -0.092 0.1261 [69]
Lu Ductal 95 0.117 0.559 0.354 0.4078 [70]
Ma 3 Ductal 47 0.273 0.68 0.993 0.109 [71]
Pollack 2 Ductal 33 0.577 1.149 0.947 0.3438 [31]
Radvanyi Ductal 30 1.594 2.084 1.795 0.5484 [72]
Sorlie Ductal 65 0.349 0.954 0.99 0.1819 [24]
Sorlie 2 Ductal 90 -0.3 0.059 0.135 0.3348 [25]
Sotiriou 2 Ductal 97 0.37 0.316 0.291 0.5685 [73]
Tabchy Ductal 163 0.738 0.714 0.668 0.6383 [74]
TCGA Ductal 389 -0.043 0.171 0.276 0.151 0.0578
Zhao Ductal 38 -0.052 0.148 0.741 0.0293 [75]
aInvasive ductal carcinoma
bThe Log2 Median-Centered Ratio reported within Oncomine cStatistical analysis was conducted using a One-Way ANOVA.
analysis revealed that both increases inSIPL1GCN and mRNA level predicted worsening sur-vival for patients with PR+ or ER+ but not those with HER2+ or triple negative BCs (Table 3).
This conclusion was further supported by our analysis of the time-to-decease endpoints (Kaplan-Meier analysis). Amplification of theSIPL1gene associates with decreased patient sur-vival (Fig 3A), and this association is attributable to ER+ or PR+ breast cancers but not to those of HER2+ and triple negative (Fig 3B–3H). These results are in line with the linkage of SIPL1 mRNA levels with the decreased survival of breast cancer patients (Fig 4A) and in the patients with PR+ breast cancer (Fig 4D). The difference in survival of ER+ BC patients with el-evated SIPL1 mRNA versus those without SIPL1 elevation approached statistical significance, but did not reach the 95% significance level (Fig 4B). This trend together with the observed as-sociation ofSIPL1copy number increase with reducing survival of patients with ER+ BC (Fig 3B) support the notion that elevation of SIPL1 expression compromised the survival of patients with PR+ and ER+ breast cancer. Taken together, the above analyses demonstrate an inverse correlation of gain of theSIPL1gene or high levels of SIPL1 mRNA levels with decreasing sur-vival in patients with PR+ or ER+ breast cancer.
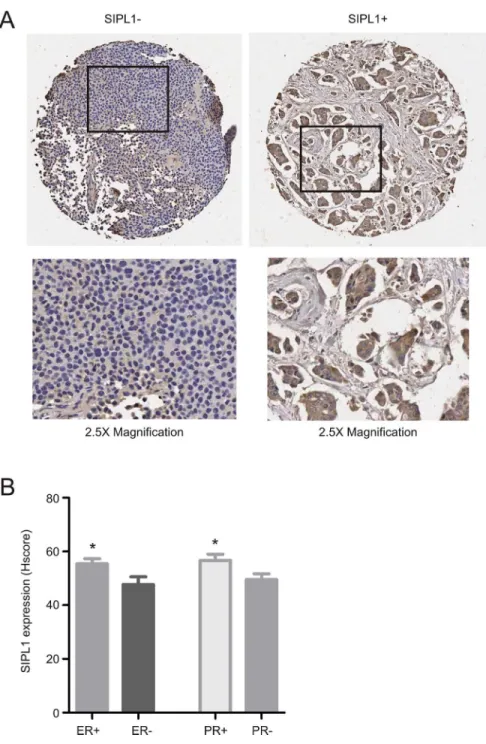
SIPL1 protein expression associates with ER+ and PR+ breast cancer
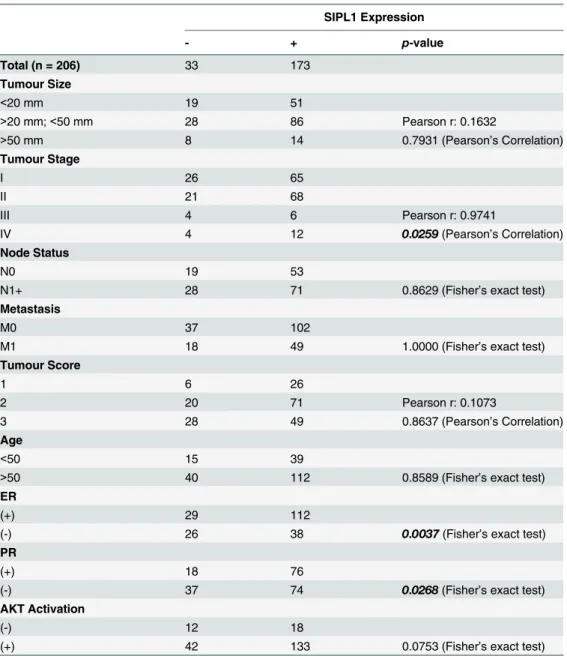
To consolidate the above analyses using the Oncomine datasets, we examined SIPL1 protein expression by immunohistochemistry (IHC) using a tissue microarray containing 206 cases of primary breast cancers (S2 Table). IHC staining clearly detected the SIPL1 protein in some pri-mary breast carcinomas (Fig 5). Quantification of SIPL1 staining by HScore detected higher levels of SIPL1 in ER+ and PR+ tumors versus those of ER- and PR- (Fig 5B). To examine whether SIPL1 expression correlates with ER+ or PR+ breast cancer, we divided the cancers into a group of strong SIPL1 expression (SIPL1+) and a group of weak SIPL1 expression (SIPL1-) based on an HScore of 40 (seeMaterials and Methodsfor justification). Fisher’s exact test revealed a correlation of SIPL1+ with ER+ and PR+ status (Table 4). These observations to-gether with the association of increasedSIPL1GCN and upregulation of the SIPL1 mRNA with reduction in the survival of patients with ER+ and PR+ breast cancer in the Oncomine datasets demonstrate a positive association between SIPL1 expression and ER+ and PR+ can-cers. While SIPL1+ does not correlate with tumor size, tumor scores, node status, and metasta-sis, SIPL1+ correlates with tumor stage (Table 4), an observation that is consistent with the association ofSIPL1gene copy number with BC stage detected in our analysis of the TCGA dataset (Table 1).
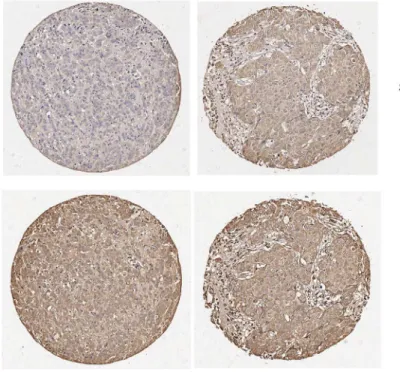
Supporting SIPL1's role in facilitating AKT activation in cervical cancer [20], we observed the co-existence of the SIPL1 protein with AKT activation in breast cancer (Fig 6A), although
Table 3. Differential Expression of SIPL1 correlates with survival in Ductal Breast Carcinoma within the Curtis dataset.
SIPL1 mRNA level SIPL1 gene copy number
Survivor Deceased Fold p Fold p
Overall 816 429 1.088 <0.0001 1.255 0.0162
ER+ 622 280 1.094 <0.0001 1.305 0.0209
ER- 183 147 1.082 0.0116 1.149 0.4066
PR+ 449 180 1.108 <0.0001 1.343 0.0512
PR- 367 249 1.067 0.0086 1.139 0.2793
Her2+ 184 134 1.045 0.1858 1.000 0.9976
Her2- 629 293 1.092 <0.0001 1.327 0.0172
TNBC 101 81 1.068 0.11054 1.070 0.7267
AKT activation was also detected in SIPL1- BC (Fig 6A). Quantification analysis revealed higher levels of AKT activation in SIPL1-positive breast cancer in comparison to those which were SIPL1-negative (Fig 6B). To examine a correlation of AKT activation with SIPL1 expres-sion, in addition to the separation of BC into SIPL1+ and SIPL1- groups, BC were also cata-logued into those of AKT+ or AKT- (seeMaterials and Methodsfor defining the threshold level). The co-existence of SIPL1+ and AKT+ (with AKT activation) in breast cancer could be evidently demonstrated (Fig 6C). Fisher’s exact test revealed a trend of correlation between SIPL1+ and AKT+ (Table 4).
Fig 3. Increases inSIPL1gene copy number correlate with decreased survival for patients with breast cancer.Data was extracted from the Curtis dataset within Oncomine and analyzed with respect to gene copy number variation. Specifically,SIPL1copy number above 2 was labelled as SIPL1+ and those below 2 were indicated as SIPL1-. Kaplan–Meier analysis of survival for a subset of patients withSIPL1amplified breast cancer vs. those with breast cancer withoutSIPL1amplification (A,n = 1118 forSIPL1+ BCs, n = 127 forSIPL1- BCs), ER+ (B,n = 810 forSIPL1+ BCs, n = 92 forSIPL1- BCs), ER- (C,
n = 295 forSIPL1+ BCs, n = 35 forSIPL1- BCs), PR+ (D,n = 565 forSIPL1+ BCs, n = 64 forSIPL1- BCs), PR- (E,n = 553 forSIPL1+ BCs, n = 63 forSIPL1 -BCs), HER+ (F,n = 291 forSIPL1+ BCs, n = 27 forSIPL1- BCs), HER- (G,n = 822 forSIPL1+ BCs, n = 100 forSIPL1- BCs), and TNBC (F,n = 163 forSIPL1+ BCs, n = 21 forSIPL1- BCs). Only patients with follow up survival data were included. Any patients whose death was not related to the disease or with a non-specified cause were excluded. Statistical Analysis was conducted using a Log-Rank test. Ap-value of<0.05 was considered statistically significant.
Progesterone negatively regulate SIPL1 expression
In view of the correlation of SIPL1 with ER and PR status observed above, we have analyzed the effects of estrogen and progesterone on SIPL1 expression. MCF7 cells are both ER and PR positive [37]. These cells were cultured in hormone free conditions for 72 hours, followed by stimulated with estrogen or estrogen plus progesterone. Because of estrogen-dependent PR ex-pression, examination of PR-regulated genes was performed in the presence of estrogen. In comparison with estrogen alone, progesterone plus estrogen would identify genes whose
Fig 4. Increases in SIPL1 mRNA correlate with decreased survival for patients with breast cancer.Data was extracted from the Curtis dataset within Oncomine and analyzed with respect to gene copy number variation. Specifically, SIPL1 mRNA in normal breast tissues was averaged, which was used to determine if the cancer samples were with SIPL1 (positive) or without (negative) mRNA upregulation. Kaplan–Meier analysis of survival for a subset of patients with SIPL1+ amplified breast cancer vs those with SIPL1- breast cancer (A,n = 1039 forSIPL1+ BCs, n = 547 forSIPL1- BCs), ER+ (B,n = 751 for SIPL1+ BCs, n = 423 forSIPL1- BCs), ER- (C,n = 269 forSIPL1+ BCs, n = 111 forSIPL1- BCs), PR+ (D,n = 510 forSIPL1+ BCs, n = 306 forSIPL1- BCs), PR- (E,n = 529 forSIPL1+ BCs, n = 241 forSIPL1- BCs), HER+ (F,n = 258 forSIPL1+ BCs, n = 96 forSIPL1- BCs), HER- (G,n = 776 forSIPL1+ BCs, n = 451 forSIPL1- BCs), and TNBC (F,n = 168 forSIPL1+ BCs, n = 52 forSIPL1- BCs). Only patients with follow up survival data were included. Any patients whose death was not related to the disease or with a non-specified cause were excluded. Statistical Analysis was conducted using a Log-Rank test. Ap -value of<0.05 was considered statistically significant.
expression is regulated by progesterone [38–41]. Both BCL2 and MYC genes are regulated by estrogen and progesterone, respectively [39,42–44]. As expected, estrogen showed a trend of BCL2 induction and progesterone significantly induced MYC expression (Fig 7A). Interesting-ly, addition of both estrogen and progesterone significantly downregulated SIPL1 mRNA, while estrogen alone had no effect (Fig 7A); this reduction was also confirmed at the protein
Fig 5. SIPL1 protein expression is associated with ER+ and PR+ tumours.(A) A TMA was examined for SIPL1 protein expression using IHC. Typical images of SIPL1+ and SIPL1- tumors are shown. The marked regions were enlarged 2.5 fold and placed underneath of the individual images. (B) SIPL1 staining was quantified (seeMaterials and Methodsfor details); means±SEM (standard error mean) are graphed. *p<0.05 (unpaired, two-tailed, welch-corrected t-test).
level (Fig 7B). Collectively, these results are in line with the theme that SIPL1 plays a role in the tumorigenesis of PR+ breast cancer (seeDiscussionfor details).
We subsequently examined SIPL1 upregulation in the course of breast cancer tumorigene-sis. Ductal carcinoma in situ (DCIS) is widely regarded as the precancerous lesion [45]. By tak-ing advantage of the presence of 425 DCIS cases in the Curtis dataset (Oncomine), our analysis revealed a significant increase of SIPL1 mRNA in DCIS in comparison to normal breast tissue and that the SIPL1 mRNA levels remained high in invasive carcinoma (Fig 8), suggesting a crit-ical role of SIPL1 in early stages of cancer formation.
Table 4. The correlation of SIPL1 expression with the clinical-pathological parameters provided in the TMA.
SIPL1 Expression
- + p-value
Total (n = 206) 33 173
Tumour Size
<20 mm 19 51
>20 mm;<50 mm 28 86 Pearson r: 0.1632
>50 mm 8 14 0.7931 (Pearson’s Correlation)
Tumour Stage
I 26 65
II 21 68
III 4 6 Pearson r: 0.9741
IV 4 12 0.0259(Pearson’s Correlation)
Node Status
N0 19 53
N1+ 28 71 0.8629 (Fisher’s exact test)
Metastasis
M0 37 102
M1 18 49 1.0000 (Fisher’s exact test)
Tumour Score
1 6 26
2 20 71 Pearson r: 0.1073
3 28 49 0.8637 (Pearson’s Correlation)
Age
<50 15 39
>50 40 112 0.8589 (Fisher’s exact test)
ER
(+) 29 112
(-) 26 38 0.0037(Fisher’s exact test)
PR
(+) 18 76
(-) 37 74 0.0268(Fisher’s exact test)
AKT Activation
(-) 12 18
(+) 42 133 0.0753 (Fisher’s exact test)
Discussion
Breast cancer is a heterogeneous disease, consisting of tumors expressing either ER or PR, which are the majority of breast cancers, and carcinomas classified as HER2+ or triple negative. It is well documented that the ER signalling plays an important role in the tumorigenesis of ER+ breast cancer, which is the scientific basis of the anti-estrogen therapy (tamoxifen and aromatase inhibitors). Recent evidence has also revealed that progesterone signalling plays an important
Fig 6. SIPL1 protein expression correlates with increased AKT activation in primary BC.(A) A TMA was examined for SIPL1 protein and Phospho-AKT Ser473 (pAKT). Typical images of tumors with pAKT in the presence of SIPL1+ and SIPL1- are shown. (B) AKT activation (pAKT) in SIPL1+ (n = 151) and SIPL1- (n = 54) was quantified; means±SEM (standard error mean) are graphed.*p<0.05 (unpaired, two-tailed, welch-corrected t-test).
role in promoting breast cancer tumorigenesis under specific conditions [46]. During the men-strual cycle, breast epithelial cells proliferate at the luteal phase, in which progesterone is at high levels [46,47]. In postmenopausal women undergoing hormone replacement therapy (HRT), the combination of estrogen with medroxyprogesterone acetate (MPA, a synthetic progestin) sulted in elevation of breast epithelial cell proliferation and breast density compared to those re-ceiving estrogen alone [48]. High breast density, as detected by mammography, strongly associates with breast cancer risk [49–51]. In line with these discussions, the combination of es-trogen and synthetic progestins increases breast cancer risk in postmenopausal women receiving HRT [52–54]. However, high levels of serum progesterone does not increase breast cancer risk in premenopausal women [55–57]. Collectively, evidence indicates that progesterone-associated risk of breast cancer depends on a woman’s age among other factors [46]. Nevertheless, the un-derlying mechanisms contributing to PR-facilitated breast cancer tumorigenesis remain essen-tially unclear.
Our analysis of the publicly available microarray datasets in Oncomine collectively demon-strates a common gain of theSIPL1gene and associated increases in SIPL1 mRNA expression
Fig 7. Progesterone reduces SIPL1 expression in MCF7 cells.(A) MCF7 cells cultured in estrogen and progesterone free conditions for 72 hours, treated with 10 nM E2 or a combination of 10 nM E2 and 10 nM P4 for 24 hours, and examined for changes in SIPL1 gene expression. TheBCL2andMYCare E2 and P4 responsive respectively, and were used as positive controls for the treatments.*p<0.05 in comparison to the ethanol (Etoh) control (2-tailed student t-test). (B) Likewise, changes in SIPL1 protein expression were examined upon treatment with E2 or a combination of E2 and P4 (inset) and quantified using ImageJ.*p<0.05 in comparison to the ethanol (Etoh) control (2-tailed student t-test).
doi:10.1371/journal.pone.0127546.g007
Fig 8. Comparison of SIPL1 mRNA expression in normal, DCIS and Invasive cancers.Utilizing the samples present in the Curtis dataset (Oncomine), theSIPL1gene expression level was compared between normal, DCIS (Stage 0) and Invasive tumors. Means±SEM (standard error mean) are graphed.*p<0.05
(unpaired, two-tailed, welch-corrected t-test) compared to normal tissues.
in BC patients irrespective of receptor expression (Fig 1andFig 2). Comprehensive analysis of the largest dataset (1556 cases) of patients [58] revealed a reverse association between elevated SIPL1 expression with reduced patient survival in PR+ BC (Fig 3andFig 4). This possibility is supported by the linkage of the SIPL1 protein expression with PR+ BC observed in our own analysis of a BC TMA (Fig 5).
SIPL1 expression is also correlated with ER status. Gain of theSIPL1gene is associated with reduced survival for patients with ER+ breast cancer in our Oncomine analysis (Fig 3B). Like-wise, a trend was observed in which high levels of SIPL1 mRNA was linked with poorer surviv-al for ER+ BC patients (Fig 4B). Furthermore, our examination of SIPL1 protein expression demonstrated that SIPL1 associates with ER+ status (Fig 6B). Taken together, evidence sup-ports a relationship between SIPL1 and ER+ BC.
The involvement of SIPL1 in the tumorigenesis of PR+ BCs was further supported by the progesterone-mediated downregulation of SIPL1 (Fig 7). These observations are intriguing considering the knowledge that PR signalling does not promote BC tumorigenesis in premeno-pausal women [55–57] and that PR functions differently in normal versus neoplastic tissues [59]. It is thus tempting to propose that suppression of SIPL1 may be a mechanism responsible for non-tumorigenic PR signalling and that SIPL1 upregulation may thus contribute to the re-moval of PR’s negative impact on BC tumorigenesis.
The correlation of SIPL1 expression with poor survival for patients with PR+ or ER+ breast cancer does not exclude the possible contributions of SIPL1 to the tumorigenesis of HER2+ and triple negative breast cancer, as gain of theSIPL1gene and increases in the SIPL1 mRNA were demonstrated in these BC types in comparison with normal breast tissues. Collectively, this investigation provides the first evidence of SIPL1 contributions to BC tumorigenesis.
While detailed mechanisms governing SIPL1-mediated BC tumorigenesis has yet to be elu-cidated, it is possible that multiple pathways may be involved. One of them is the induction of AKT activation (Fig 6), which is consistent with the reported role of SIPL1 in inhibiting PTEN activity [20]. Additionally, as a component of LUBAC, SIPL1/Sharpin activates NF-κB, which is known to promote tumorigenesis at multiple levels [60–62]. Despite this appealing mecha-nism, a PubMed search failed to uncover publications on the involvement of the LUBAC nor HOIL-1 or HOIP (two major components of the LUBAC) on breast cancer. Based on our anal-ysis and work documented here, it will be intriguing to investigate whether LUBAC contributes to breast tumorigenesis. The recent characterization of LUBAC-mediated linear chain ubiquiti-nation and the recently acquired knowledge of SIPL1/Sharpin structure will facilitate this in-vestigation [63–65].
Supporting Information
S1 Fig. Alteration of SIPL1 mRNA in breast cancer.Data from the Perou (A), Randvanyi (B), Sorlie (C), Sorlie 2 (D) and Zhao (E) datasets were extracted from Oncomine and analyzed with respect to SIPL1 mRNA expression in cancer vs. normal tissues. Statistical Analysis was conducted using an unpaired, two-tailed, welch-corrected t-test. Asterisks indicate p<0.05 in
comparison to normal breast tissues. (TIF)
S1 Table. Datasets used in the analysis of SIPL1 mRNA in breast cancers versus normal cases.
(DOC)
Author Contributions
Conceived and designed the experiments: JDM DT. Performed the experiments: JDM. Ana-lyzed the data: JDM DT. Contributed reagents/materials/analysis tools: JDM. Wrote the paper: JDM DT.
References
1. Lim S, Sala C, Yoon J, Park S, Kuroda S, Sheng M, et al. (2001) Sharpin, a Novel Postsynaptic Density Protein That Directly Interacts with the Shank Family of Proteins. Mol Cell Neurosci 17: 385–397. doi: 10.1006/mcne.2000.0940PMID:11178875
2. Daigo Y, Takayama I, Ward SM, Sanders KM, Fujino MA (2003) Novel human and mouse genes en-coding a shank-interacting protein and its upregulation in gastric fundus of W/WV mouse. J Gastroen-terol Hepatol 18: 712–718. doi:3046 [pii]. PMID:12753155
3. Gerlach B, Cordier SM, Schmukle AC, Emmerich CH, Rieser E, Haas TL, et al. (2011) Linear ubiquiti-nation prevents inflammation and regulates immune signalling. Nature 471: 591–596. doi:10.1038/ nature09816PMID:21455173
4. Emmerich CH, Schmukle AC, Walczak H (2011) The emerging role of linear ubiquitination in cell signal-ing. Sci Signal 4: re5. doi:10.1126/scisignal.2002187PMID:22375051
5. Ikeda F, Deribe YL, Skånland SS, Stieglitz B, Grabbe C, Franz-Wachtel M, et al. (2011) SHARPIN forms a linear ubiquitin ligase complex regulating NF-κB activity and apoptosis. Nature 471: 637–641.
doi:10.1038/nature09814PMID:21455181
6. Iwai K (2011) Linear polyubiquitin chains: A new modifier involved in NFκB activation and chronic
in-flammation, including dermatitis. Cell Cycle 10: 3095–3104. doi:10.4161/cc.10.18.17437PMID: 21900745
7. Tokunaga F, Nakagawa T, Nakahara M, Saeki Y, Taniguchi M, Sakata S, et al. (2011) SHARPIN is a component of the NF-κB-activating linear ubiquitin chain assembly complex. Nature 471: 633–636.
doi:10.1038/nature09815PMID:21455180
8. Fujita H, Rahighi S, Akita M, Kato R, Sasaki Y, Wakatsuki S, et al. (2014) Mechanism underlying IKK activation mediated by the linear ubiquitin chain assembly complex (LUBAC). Mol Cell Biol. doi:10. 1128/MCB.01538-13
9. Belgnaoui SM, Paz S, Samuel S, Goulet M- L, Sun Q, Kikkert M, et al. (2012) Linear ubiquitination of NEMO negatively regulates the interferon antiviral response through disruption of the MAVS-TRAF3 complex. Cell Host Microbe 12: 211–222. doi:10.1016/j.chom.2012.06.009PMID:22901541
10. Tomonaga M, Hashimoto N, Tokunaga F, Onishi M, Myoui A, Yoshikawa H, et al. (2012) Activation of nuclear factor-kappa B by linear ubiquitin chain assembly complex contributes to lung metastasis of os-teosarcoma cells. Int J Oncol 40: 409–417. doi:10.3892/ijo.2011.1209PMID:21947385
11. Wang Z, Sokolovska A, Seymour R, Sundberg JP, HogenEsch H (2012) SHARPIN Is Essential for Cy-tokine Production, NF-κB Signaling, and Induction of Th1 Differentiation by Dendritic Cells. PLoS One
7: e31809. doi:10.1371/journal.pone.0031809PMID:22348129
12. Seymour RE, Hasham MG, Cox GA, Shultz LD, Hogenesch H, Roopenian DC, et al. (2007) Spontane-ous mutations in the mSpontane-ouse Sharpin gene result in multiorgan inflammation, immune system dysregula-tion and dermatitis. Genes Immun 8: 416–421. doi:10.1038/sj.gene.6364403PMID:17538631
13. Hoesel B, Schmid JA (2013) The complexity of NF-κB signaling in inflammation and cancer. Mol
Can-cer 12: 86. doi:10.1186/1476-4598-12-86PMID:23915189
14. Liang Y, Sundberg JP (2011) SHARPIN regulates mitochondria-dependent apoptosis in keratinocytes. J Dermatol Sci 63: 148–153. doi:10.1016/j.jdermsci.2011.04.012PMID:21620685
15. Sieber S, Lange N, Kollmorgen G, Erhardt A, Quaas A, Gontarewicz A, et al. (2012) Sharpin Contrib-utes to TNFαDependent NFκB Activation and Anti-Apoptotic Signalling in Hepatocytes. PLoS One 7:
e29993. doi:10.1371/journal.pone.0029993PMID:22253853
16. MacKay C, Carroll E, Ibrahim AFM, Garg A, Inman GJ, Hay RT, et al. (2014) E3 Ubiquitin Ligase HOIP Attenuates Apoptotic Cell Death Induced by Cisplatin. Cancer Res. doi: 10.1158/0008-5472.CAN-13-2131
17. Jung J, Kim JM, Park B, Cheon Y, Lee B, Choo SH, et al. (2010) Newly identified tumor-associated role of human Sharpin. Mol Cell Biochem 340: 161–167. doi:10.1007/s11010-010-0413-xPMID:
20179993
19. Li C-Y, Yao A-M, Chang X-N, Guo Y-H, Xu R (2013) [Effects of SIPL1 screened by suppression sub-tractive hybridization (SSH) on biological function and drug resistance of renal cell carcinoma cells]. Zhonghua Zhong Liu Za Zhi 35: 897–903. PMID:24506958
20. He L, Ingram A, Rybak AP, Tang D (2010) Shank-interacting protein–like 1 promotes tumorigenesis via PTEN inhibition in human tumor cells. J Clin Invest 120: 2094–2108. doi:10.1172/JCI40778.2094 PMID:20458142
21. Benson JR, Jatoi I, Keisch M, Esteva FJ, Makris A, Jordan VC (2009) Early breast cancer. Lancet 373: 1463–1479. doi:10.1016/S0140-6736(09)60316-0PMID:19394537
22. Zhou W, Slingerland JM (2014) Links between oestrogen receptor activation and proteolysis: relevance to hormone-regulated cancer therapy. Nat Rev Cancer 14: 26–38. PMID:24505618
23. Vargo-Gogola T, Rosen JM (2007) Modelling breast cancer: one size does not fit all. Nat Rev Cancer 7: 659–672. doi:10.1038/nrc2193PMID:17721431
24. Sørlie T, Perou CM, Tibshirani R, Aas T, Geisler S, Johnsen H, et al. (2001) Gene expression patterns
of breast carcinomas distinguish tumor subclasses with clinical implications. PNAS 98: 10869–10874. doi:10.1073/pnas.191367098PMID:11553815
25. Sorlie T, Tibshirani R, Parker J, Hastie T, Marron JS, Nobel A, et al. (2003) Repeated observation of breast tumor subtypes in independent gene expression data sets. Proc Natl Acad Sci U S A 100: 8418–8423. doi:10.1073/pnas.0932692100PMID:12829800
26. Slamon DJ, Clark GM, Wong SG, Levin WJ, Ullrich A, McGuire WL (1987) Human breast cancer: corre-lation of relapse and survival with amplification of the HER-2/neu oncogene. Science 235: 177–182. PMID:3798106
27. Turner NC, Reis-Filho JS (2006) Basal-like breast cancer and the BRCA1 phenotype. Oncogene 25: 5846–5853. doi:10.1038/sj.onc.1209876PMID:16998499
28. Glass AG, Donis-Keller H, Mies C, Russo J, Zehnbauer B, Taube S, et al. (2001) The Cooperative Breast Cancer Tissue Resource: Archival Tissue for the Investigation of Tumor Markers. Clin Cancer Res 7: 1843–1849. PMID:11448894
29. De Melo J, Wu V, He L, Yan J, Tang D (2014) SIPL1 enhances the proliferation, attachment, and migra-tion of CHO cells by inhibiting PTEN funcmigra-tion. Int J Mol Med 34: 835–841. doi:10.3892/ijmm.2014. 1840PMID:25018115
30. Kallioniemi A, Kallioniemi OP, Piper J, Tanner M, Stokke T, Chen L, et al. (1994) Detection and map-ping of amplified DNA sequences in breast cancer by comparative genomic hybridization. Proc Natl Acad Sci U S A 91: 2156–2160. PMID:8134364
31. Pollack JR, Sørlie T, Perou CM, Rees CA, Jeffrey SS, Lonning PE, et al. (2002) Microarray analysis
re-veals a major direct role of DNA copy number alteration in the transcriptional program of human breast tumors. Proc Natl Acad Sci U S A 99: 12963–12968. doi:10.1073/pnas.162471999PMID:12297621
32. Pollack JR, Perou CM, Alizadeh AA, Eisen MB, Pergamenschikov A, Williams CF, et al. (1999) Ge-nome-wide analysis of DNA copy-number changes using cDNA microarrays. Nat Genet 23: 41–46. doi:10.1038/12640PMID:10471496
33. Rennstam K, Ahlstedt-Soini M, Baldetorp B, Bendahl P-O, Borg A, Karhu R, et al. (2003) Patterns of chromosomal imbalances defines subgroups of breast cancer with distinct clinical features and progno-sis. A study of 305 tumors by comparative genomic hybridization. Cancer Res 63: 8861–8868. PMID: 14695203
34. Seute A, Sinn HP, Schlenk RF, Emig R, Wallwiener D, Grischke EM, et al. (2001) Clinical relevance of genomic aberrations in homogeneously treated high-risk stage II/III breast cancer patients. Int J Cancer 93: 80–84. PMID:11391625
35. Tirkkonen M, Tanner M, Karhu R, Kallioniemi A, Isola J, Kallioniemi OP (1998) Molecular cytogenetics of primary breast cancer by CGH. Genes Chromosomes Cancer 21: 177–184. PMID:9523192
36. Elston CW, Ellis IO (1991) Pathological prognostic factors in breast cancer. I. The value of histological grade in breast cancer: experience from a large study with long-term follow-up. Histopathology 19: 403–410. PMID:1757079
37. Neve RM, Chin K, Fridlyand J, Yeh J, Baehner FL, Fevr T, et al. (2006) A collection of breast cancer cell lines for the study of functionally distinct cancer subtypes. Cancer Cell 10: 515–527. doi:10.1016/j.ccr. 2006.10.008PMID:17157791
38. Zheng A, Kallio A, Härkönen P (2007) Tamoxifen-induced rapid death of MCF-7 breast cancer cells is mediated via extracellularly signal-regulated kinase signaling and can be abrogated by estrogen. Endo-crinology 148: 2764–2777. doi:10.1210/en.2006-1269PMID:17363451
40. Rocha A, Azevedo I, Soares R (2008) Progesterone sensitizes breast cancer MCF7 cells to imatinib in-hibitory effects. J Cell Biochem 103: 607–614. doi:10.1002/jcb.21432PMID:17614352
41. Mannella P, Brinton RD (2006) Estrogen receptor protein interaction with phosphatidylinositol 3-kinase leads to activation of phosphorylated Akt and extracellular signal-regulated kinase 1/2 in the same pop-ulation of cortical neurons: a unified mechanism of estrogen action. J Neurosci 26: 9439–9447. doi:10. 1523/JNEUROSCI.1443-06.2006PMID:16971528
42. Moore MR, Zhou JL, Blankenship KA, Strobl JS, Edwards DP, Gentry RN (1997) A sequence in the 5’ flanking region confers progestin responsiveness on the human c-myc gene. J Steroid Biochem Mol Biol 62: 243–252. PMID:9408078
43. Dong L, Wang W, Wang F, Stoner M, Reed JC, Harigai M, et al. (1999) Mechanisms of transcriptional activation of bcl-2 gene expression by 17beta-estradiol in breast cancer cells. J Biol Chem 274: 32099–32107. PMID:10542244
44. O’Lone R, Frith MC, Karlsson EK, Hansen U (2004) Genomic targets of nuclear estrogen receptors. Mol Endocrinol 18: 1859–1875. doi:10.1210/me.2003-0044PMID:15031323
45. Rivenbark AG, O’Connor SM, Coleman WB (2013) Molecular and cellular heterogeneity in breast can-cer: challenges for personalized medicine. Am J Pathol 183: 1113–1124. doi:10.1016/j.ajpath.2013. 08.002PMID:23993780
46. Brisken C (2013) Progesterone signalling in breast cancer: a neglected hormone coming into the lime-light. Nat Rev Cancer 13: 385–396. doi:10.1038/nrc3518PMID:23702927
47. Masters JR, Drife JO, Scarisbrick JJ (1977) Cyclic Variation of DNA synthesis in human breast epitheli-um. J Natl Cancer Inst 58: 1263–1265. PMID:853524
48. Hofseth LJ, Raafat AM, Osuch JR, Pathak DR, Slomski CA, Haslam SZ (1999) Hormone replacement therapy with estrogen or estrogen plus medroxyprogesterone acetate is associated with increased epi-thelial proliferation in the normal postmenopausal breast. J Clin Endocrinol Metab 84: 4559–4565. doi: 10.1210/jcem.84.12.6194PMID:10599719
49. Wang AT, Vachon CM, Brandt KR, Ghosh K (2014) Breast Density and Breast Cancer Risk: A Practical Review. Mayo Clin Proc 89: 548–557. doi:10.1016/j.mayocp.2013.12.014PMID:24684876
50. McCormack VA, dos Santos Silva I (2006) Breast density and parenchymal patterns as markers of breast cancer risk: a meta-analysis. Cancer Epidemiol Biomarkers Prev 15: 1159–1169. doi:10.1158/ 1055-9965.EPI-06-0034PMID:16775176
51. Boyd NF, Guo H, Martin LJ, Sun L, Stone J, Fishell E, et al. (2007) Mammographic density and the risk and detection of breast cancer. N Engl J Med 356: 227–236. doi:10.1056/NEJMoa062790PMID: 17229950
52. Chlebowski RT, Anderson GL, Gass M, Lane DS, Aragaki AK, Kuller LH, et al. (2010) Estrogen plus progestin and breast cancer incidence and mortality in postmenopausal women. JAMA 304: 1684– 1692. doi:10.1001/jama.2010.1500PMID:20959578
53. Beral V (2003) Breast cancer and hormone-replacement therapy in the Million Women Study. Lancet 362: 419–427. PMID:12927427
54. Rossouw JE, Anderson GL, Prentice RL, LaCroix AZ, Kooperberg C, Stefanick ML, et al. (2002) Risks and benefits of estrogen plus progestin in healthy postmenopausal women: principal results From the Women’s Health Initiative randomized controlled trial. JAMA 288: 321–333. PMID:12117397
55. Schernhammer ES, Sperati F, Razavi P, Agnoli C, Sieri S, Berrino F, et al. (2013) Endogenous sex ste-roids in premenopausal women and risk of breast cancer: the ORDET cohort. Breast Cancer Res 15: R46. doi:10.1186/bcr3438PMID:23777922
56. Micheli A, Muti P, Secreto G, Krogh V, Meneghini E, Venturelli E, et al. (2004) Endogenous sex hor-mones and subsequent breast cancer in premenopausal women. Int J Cancer 112: 312–318. doi:10. 1002/ijc.20403PMID:15352045
57. Kaaks R, Berrino F, Key T, Rinaldi S, Dossus L, Biessy C, et al. (2005) Serum sex steroids in premeno-pausal women and breast cancer risk within the European Prospective Investigation into Cancer and Nutrition (EPIC). J Natl Cancer Inst 97: 755–765. doi:10.1093/jnci/dji132PMID:15900045
58. Curtis C, Shah SP, Chin S-F, Turashvili G, Rueda OM, Dunning MJ, et al. (2012) The genomic and tran-scriptomic architecture of 2,000 breast tumours reveals novel subgroups. Nature 486: 1–7. doi:10. 1038/nature10983
59. Hagan CR, Lange CA (2014) Molecular determinants of context-dependent progesterone receptor ac-tion in breast cancer. BMC Med 12: 32. doi:10.1186/1741-7015-12-32PMID:24552158
60. Dolcet X, Llobet D, Pallares J, Matias-Guiu X (2005) NF-kB in development and progression of human cancer. Virchows Arch 446: 475–482. doi:10.1007/s00428-005-1264-9PMID:15856292
61. Ben-Neriah Y, Karin M (2011) Inflammation meets cancer, with NF-κB as the matchmaker. Nat
62. Karin M, Cao Y, Greten FR, Li Z-W (2002) NF-kappaB in cancer: from innocent bystander to major cul-prit. Nat Rev Cancer 2: 301–310. doi:10.1038/nrc780PMID:12001991
63. Stieglitz B, Haire LF, Dikic I, Rittinger K (2012) Structural analysis of SHARPIN, a subunit of a large multi-protein E3 ubiquitin ligase, reveals a novel dimerization function for the pleckstrin homology superfold. J Biol Chem 287: 20823–20829. doi:10.1074/jbc.M112.359547PMID:22549881
64. Stieglitz B, Morris-davies AC, Koliopoulos MG, Christodoulou E, Rittinger K (2012) LUBAC synthesizes linear ubiquitin chains via a thioester intermediate. EMBO Rep 13: 1–7. doi:10.1038/embor.2012.105
65. Smit JJ, Monteferrario D, Noordermeer SM, van Dijk WJ, van der Reijden BA, Sixma TK (2012) The E3 ligase HOIP specifies linear ubiquitin chain assembly through its RING-IBR-RING domain and the unique LDD extension. EMBO J 1: 1–12. doi:10.1038/emboj.2012.217
66. Nikolsky Y, Sviridov E, Yao J, Dosymbekov D, Ustyansky V, Kaznacheev V, et al. (2008) Genome-wide functional synergy between amplified and mutated genes in human breast cancer. Cancer Res 68: 9532–9540. doi:10.1158/0008-5472.CAN-08-3082PMID:19010930
67. Bonnefoi H, Potti A, Delorenzi M, Mauriac L, Campone M, Tubiana-Hulin M, et al. (2007) Retracted— Validation of gene signatures that predict the response of breast cancer to neoadjuvant chemotherapy: a substudy of the EORTC 10994/BIG 00–01 clinical trial. Lancet Oncol 8: 1071–1078. doi:10.1016/ S1470-2045(07)70345-5PMID:18024211
68. Desmedt C, Piette F, Loi S, Wang Y, Lallemand F, Haibe-Kains B, et al. (2007) Strong time dependence of the 76-gene prognostic signature for node-negative breast cancer patients in the TRANSBIG multi-center independent validation series. Clin Cancer Res 13: 3207–3214. doi: 10.1158/1078-0432.CCR-06-2765PMID:17545524
69. Esserman LJ, Berry DA, Cheang MCU, Yau C, Perou CM, Carey L, et al. (2012) Chemotherapy sponse and recurrence-free survival in neoadjuvant breast cancer depends on biomarker profiles: re-sults from the I-SPY 1 TRIAL (CALGB 150007/150012; ACRIN 6657). Breast Cancer Res Treat 132: 1049–1062. doi:10.1007/s10549-011-1895-2PMID:22198468
70. Lu X, Lu X, Wang ZC, Iglehart JD, Zhang X, Richardson AL (2008) Predicting features of breast cancer with gene expression patterns. Breast Cancer Res Treat 108: 191–201. doi: 10.1007/s10549-007-9596-6PMID:18297396
71. Ma X-J, Wang Z, Ryan PD, Isakoff SJ, Barmettler A, Fuller A, et al. (2004) A two-gene expression ratio predicts clinical outcome in breast cancer patients treated with tamoxifen. Cancer Cell 5: 607–616. doi: 10.1016/j.ccr.2004.05.015PMID:15193263
72. Radvanyi L, Singh-Sandhu D, Gallichan S, Lovitt C, Pedyczak A, Mallo G, et al. (2005) The gene asso-ciated with trichorhinophalangeal syndrome in humans is overexpressed in breast cancer. Proc Natl Acad Sci U S A 102: 11005–11010. doi:10.1073/pnas.0500904102PMID:16043716
73. Sotiriou C, Neo S-Y, McShane LM, Korn EL, Long PM, Jazaeri A, et al. (2003) Breast cancer classifica-tion and prognosis based on gene expression profiles from a populaclassifica-tion-based study. Proc Natl Acad Sci U S A 100: 10393–10398. doi:10.1073/pnas.1732912100PMID:12917485
74. Tabchy A, Valero V, Vidaurre T, Lluch A, Gomez H, Martin M, et al. (2010) Evaluation of a 30-gene pac-litaxel, fluorouracil, doxorubicin, and cyclophosphamide chemotherapy response predictor in a multi-center randomized trial in breast cancer. Clin Cancer Res 16: 5351–5361. doi:10.1158/1078-0432. CCR-10-1265PMID:20829329