HESSD
11, 6065–6097, 2014Mapping irrigation potential from groundwater in Africa
Y. Altchenko and K. G. Villholth
Title Page
Abstract Introduction
Conclusions References
Tables Figures
◭ ◮
◭ ◮
Back Close
Full Screen / Esc
Printer-friendly Version Interactive Discussion
Discussion
P
a
per
|
Discus
sion
P
a
per
|
Discussion
P
a
per
|
Discussion
P
a
per
|
Hydrol. Earth Syst. Sci. Discuss., 11, 6065–6097, 2014 www.hydrol-earth-syst-sci-discuss.net/11/6065/2014/ doi:10.5194/hessd-11-6065-2014
© Author(s) 2014. CC Attribution 3.0 License.
This discussion paper is/has been under review for the journal Hydrology and Earth System Sciences (HESS). Please refer to the corresponding final paper in HESS if available.
Mapping irrigation potential from
renewable groundwater in Africa
– a quantitative hydrological approach
Y. Altchenko1,2and K. G. Villholth3
1
International Water Management Institute, Pretoria, South Africa
2
Ministère de l’Agriculture, de l’Agroalimentaire et de la Forêt, Paris, France
3
International Water Management Institute, Pretoria, South Africa
Received: 15 April 2014 – Accepted: 30 April 2014 – Published: 10 June 2014
Correspondence to: Y. Altchenko ([email protected])
HESSD
11, 6065–6097, 2014Mapping irrigation potential from groundwater in Africa
Y. Altchenko and K. G. Villholth
Title Page
Abstract Introduction
Conclusions References
Tables Figures
◭ ◮
◭ ◮
Back Close
Full Screen / Esc
Printer-friendly Version Interactive Discussion
Discussion
P
a
per
|
Discus
sion
P
a
per
|
Discussion
P
a
per
|
Discussion
P
a
per
|
Abstract
Groundwater provides an important buffer to climate variability in Africa. Yet
ground-water irrigation contributes only a relatively little share of cultivated land, approximately 1 % (about 2 million hectares) as compared to 14 % in Asia. While groundwater is over-exploited for irrigation in many parts in Asia, previous assessments indicate an 5
under-utilized potential in parts of Africa. As opposed to previous country-based esti-mates, this paper derives a continent-wide, distributed (0.5◦spatial resolution) map of
groundwater irrigation potential, indicated in terms of fractions of cropland potentially irrigable with renewable groundwater. The method builds on an annual groundwater balance approach using 41 years of data, allocating only that fraction of groundwa-10
ter recharge that is in excess after satisfying other human needs and environmental requirements, while disregarding any socio-economic and physical constraints in ac-cess to the resource. Due to high uncertainty of groundwater environmental needs, three scenarios, leaving 30, 50 and 70 % of recharge for the environment, were im-plemented. Current dominating crops and cropping rotations and associated irrigation 15
requirements in a zonal approach were applied in order to convert recharge excess to potential irrigated cropland. Results show an inhomogeneously distributed ground-water irrigation potential across the continent, even within individual countries, reflect-ing recharge patterns and presence or absence of cultivated cropland. Results fur-ther show that average annual groundwater available for irrigation ranges from 692 to 20
1644 km3depending on scenario. The total area of cropland irrigable with groundwater
ranges from 27.2 to 64.3 million ha, corresponding to 12.5 to 29.6 % of the cropland over the continent. The map is a first assessment that needs to be complimented with assessment of other factors, e.g. hydrogeological conditions, groundwater accessibility, soils, and socio-economic factors as well as more local assessments.
HESSD
11, 6065–6097, 2014Mapping irrigation potential from groundwater in Africa
Y. Altchenko and K. G. Villholth
Title Page
Abstract Introduction
Conclusions References
Tables Figures
◭ ◮
◭ ◮
Back Close
Full Screen / Esc
Printer-friendly Version Interactive Discussion
Discussion
P
a
per
|
Discus
sion
P
a
per
|
Discussion
P
a
per
|
Discussion
P
a
per
|
1 Introduction
Irrigation expansion is seen as a significant leverage to food security, livelihoods, rural development, and agricultural and broader economic development in Africa, especially in sub-Saharan Africa (SSA). National and regional (CAADP, 2009; NEPAD, 2003) poli-cies and plans stress irrigation development, and more broadly sustainable land and 5
water management, as a key component to poverty alleviation and gains in food
pro-ductivity. FAO (2005) assessed the potential for irrigation development1 in Africa to
be 42.5×10⁶ha, corresponding to 20.1 % of the cultivated area or 5.7 % of the
cul-tivable land. While still playing a secondary and minor role in national and regional plans, groundwater is increasingly included as a viable and suitable supplementary or 10
sole resource to develop for irrigation along with traditional surface water resources
(MoAC, 2004; MoFA and GIDA2, 2011; MoFED, 2010; MoIWD, 2005; MoWEA, 2013).
This is explained by evidence that farmers progressively embrace groundwater irriga-tion (GWI) spontaneously and with own investments where condiirriga-tions permit (Villholth, 2013) and the notion that the groundwater resources in Africa generally are plentiful as 15
well as underutilized (MacDonald et al., 2012).
Groundwater irrigation presently covers around 2×10⁶ha in Africa, equivalent to
1 % of the cultivated land (Siebert et al., 2010). In Asia, similar figures amount to 38×106ha or 14 % of cultivated land (Siebert et al., 2010). Hence, it is fair to assume
that there is appreciable scope for further developing GWI in the continent. Barriers to 20
an expansion of groundwater-based irrigation in Africa, and in particular SSA, include
1
Definition of irrigation potential in FAO (2005): area of land (ha) which is potentially irrigable. Country/regional studies assess this value according to different methods, for example some consider only land resources suitable for irrigation, others consider land resources plus wa-ter availability, others include in their assessment economic aspects (such as distance and/or difference in elevation between the suitable land and the available water) or environmental aspects, etc.
2
HESSD
11, 6065–6097, 2014Mapping irrigation potential from groundwater in Africa
Y. Altchenko and K. G. Villholth
Title Page
Abstract Introduction
Conclusions References
Tables Figures
◭ ◮
◭ ◮
Back Close
Full Screen / Esc
Printer-friendly Version Interactive Discussion
Discussion
P
a
per
|
Discus
sion
P
a
per
|
Discussion
P
a
per
|
Discussion
P
a
per
|
lack of knowledge of the resource and best options for sustainable development. So while present levels of development are comparatively low and most development oc-curs in the informal sector (Villholth, 2013), progress towards greater and long-term benefits need to be informed by estimations of upper limits for sustainable develop-ment and most appropriate geographic areas for developdevelop-ment. The need for quali-5
fied estimates of groundwater irrigation potential (GWIP) is recognized at the national (MoFA and GIDA, 2011; Awulachew et al., 2010) as well as regional scale (MacDonald et al., 2012). Qualitative, relative groundwater potential was mapped for Ethiopia by MacDonald et al. (2001), however, with no specific focus on the potential for irrigation. You et al. (2010) estimated the potential contribution from small-scale irrigation (incl. 10
ponds, small reservoirs, rainwater harvesting, and groundwater) in Africa to be 0.3 to 16×106ha based on a distributed multi-criteria analysis. Pavelic et al. (2012, 2013)
afforded a relatively simple water balance approach to provide country or catchment
scale estimates of gross GWIP in terms of irrigable cropland, taking into consideration the crop irrigation water needs and disregarding existing irrigation development. Water 15
available for irrigation was constrained by renewable groundwater resources, priority demands from domestic, livestock, industrial uses as well as environmental require-ments. They determined the GWIP of 13 semi-arid countries in SSA to be in the range of 13.5±6.0×10⁶ha, or between 0.1–3.9×10⁶ha per country. While the previous
es-timations of GWIP in Africa were continental (You et al., 2010), national (Pavelic et al., 20
2013), or sub-national (Pavelic et al., 2012) in scope, the present paper builds on the latter approach providing a fully distributed and consistent assessment of the gross GWIP for the entire continent at a grid scale of 0.5◦. By doing so, regional di
fferences across the continent become conspicuous and variability within the countries also be-comes apparent. The extent and distribution of GWIP is subsequently compared with 25
HESSD
11, 6065–6097, 2014Mapping irrigation potential from groundwater in Africa
Y. Altchenko and K. G. Villholth
Title Page
Abstract Introduction
Conclusions References
Tables Figures
◭ ◮
◭ ◮
Back Close
Full Screen / Esc
Printer-friendly Version Interactive Discussion
Discussion
P
a
per
|
Discus
sion
P
a
per
|
Discussion
P
a
per
|
Discussion
P
a
per
|
2 Methodology
Following the approach of Pavelic et al. (2013), the methodology assumes groundwater as the sole source of irrigation water and hence gives an estimate of the area that could potentially be irrigated by groundwater disregarding any existing irrigation, whether from groundwater or surface water. Importantly, the method considers only sustainable 5
GWI from a resource perspective, i.e. the use of only renewable groundwater for human needs (including irrigation) while partially satisfying environmental requirements from this renewable resource. As a consequence, non-renewable (fossil) groundwater is not considered available, preventing long-term aquifer depletion.
The water balance assessment is based on a GIS analysis and mapping with a final 10
resolution of 0.5◦ assuming each cell (about 50 km x 50 km) to be homogeneous and
independent of other cells, i.e. no lateral flows occur between cells. For each cell, the
GWIP [L2] is calculated as the potential cropland area that the available groundwater
resource can irrigate:
GWIP= GW Available
Irrig. Water Demand (1)
15
where groundwater availability [L3T−1] is calculated as any excess of groundwater
recharge, considering other groundwater demands from humans (domestic uses, live-stock, industry) and the environment:
GW Available=GW Recharge−Human GW Demand−Environ. GW Req. (2)
20
The gross irrigation water demand [L T−1], which represents the groundwater
abstrac-tion needed to satisfy the deficit rainfall and the irrigaabstrac-tion losses, is determined by:
Irrig. Water Demand=
Pn
i=1(Crop Water Demandi×[%of Area]i)−Green Water
Irrig. Efficiency (3)
HESSD
11, 6065–6097, 2014Mapping irrigation potential from groundwater in Africa
Y. Altchenko and K. G. Villholth
Title Page
Abstract Introduction
Conclusions References
Tables Figures
◭ ◮
◭ ◮
Back Close
Full Screen / Esc
Printer-friendly Version Interactive Discussion
Discussion
P
a
per
|
Discus
sion
P
a
per
|
Discussion
P
a
per
|
Discussion
P
a
per
|
The equation parameters are given as follows:
– Crop Water Demand [L T−1] represents the amount of water needed by the crop
to grow optimally during the months of its growing period, independently of the water source and considering water as the only limiting factor for optimal growth (FAO, 1986).
5
– Green Water [L T−1] is the water available for the plants naturally and indirectly from the rainfall through soil moisture.
– % of Area [–] is the areal fraction of a specific crop relative to the total cropland.
– n[–] is the number of crops grown within the grid cell.
– Irrig. Efficiency [–] is the irrigation efficiency coefficient. It is used to express the 10
fraction of groundwater abstracted that is not lost along the water transport from the abstraction point to the crop (FAO, 1989). The extracted groundwater quantity does not reach fully the crops because of transport losses or losses in the field. The return flow to groundwater is considered lost for irrigation (i.e. not included in the recharge, see below) to not overestimate the groundwater availability.
15
– GW Recharge [L3T−1] is the net groundwater recharge. It corresponds to the total
quantity of water from rainfall which reaches the aquifer.
– Human GW Demand [L3T−1] is the groundwater use for anthropogenic activities,
such as domestic and industrial water supply and livestock watering. Domestic and industrial water requirement are assumed to come partly from groundwater 20
while livestock watering is assumed to be fully supplied by groundwater (see also Sect. 3.3).
– Environ. GW Req. [L3T−1] is the quantity of water coming from groundwater,
which is directly linked to the environment for maintaining ecosystems. This in-cludes river baseflow and groundwater influx to wetlands.
HESSD
11, 6065–6097, 2014Mapping irrigation potential from groundwater in Africa
Y. Altchenko and K. G. Villholth
Title Page
Abstract Introduction
Conclusions References
Tables Figures
◭ ◮
◭ ◮
Back Close
Full Screen / Esc
Printer-friendly Version Interactive Discussion
Discussion
P
a
per
|
Discus
sion
P
a
per
|
Discussion
P
a
per
|
Discussion
P
a
per
|
The proposed approach, taking annual water balances, yields an estimate of GWIP with respect to historic hydrology when averaging the assessment over a number of years with varying rainfall and recharge over the continent. This is described in more detail in the next section.
3 Data sources and preparation
5
3.1 Hydrological data
Data on recharge (GW Recharge, Eq. 2) and green water (Green Water, Eq. 3) de-rive from model outputs from the PCR-GLOBWB global hydrological model (Van Beek et al., 2011). Data for Africa from a global simulation with 0.5◦ spatial resolution for a recent 41 year period (January 1960 to December 2000) have been used (including 10
Madagascar, but excluding the smaller islands of Comoros, Mauritius, Seychelles, and Cape Verde). The model calculates for daily time steps the water storage in two ver-tically stacked soil layers and an underlying groundwater layer, as well as the water exchange between the layers and between the top layer and the atmosphere (rainfall, evaporation and snow melt). The model also calculates canopy interception and snow 15
storage. During the simulation period, land cover changes are not taken into considera-tion. For the green water availability, the sum of the simulated actual transpiration of the two soil layers under non-irrigation conditions was used. This conservative approach, disregarding soil evaporation, allows not overestimating the availability of water for the crops (Van Beek et al., 2011).
20
3.2 Crop and irrigation data
HESSD
11, 6065–6097, 2014Mapping irrigation potential from groundwater in Africa
Y. Altchenko and K. G. Villholth
Title Page
Abstract Introduction
Conclusions References
Tables Figures
◭ ◮
◭ ◮
Back Close
Full Screen / Esc
Printer-friendly Version Interactive Discussion
Discussion
P
a
per
|
Discus
sion
P
a
per
|
Discussion
P
a
per
|
Discussion
P
a
per
|
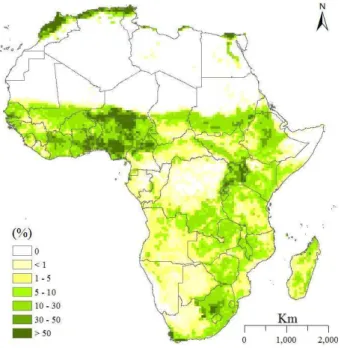
crop distribution, data for the 2000 crop distribution has been used (Monfreda et al.,
2008; Ramunkutty et al., 2008). Figure 1 shows the cropland (217×106ha)
distribu-tion in Africa. This includes the cultivated (i.e. harvested) cropland and non-cultivated cropland in 2000.
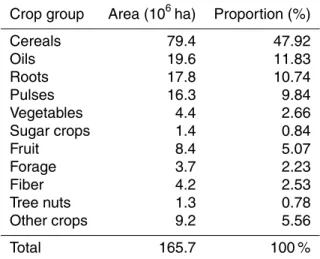
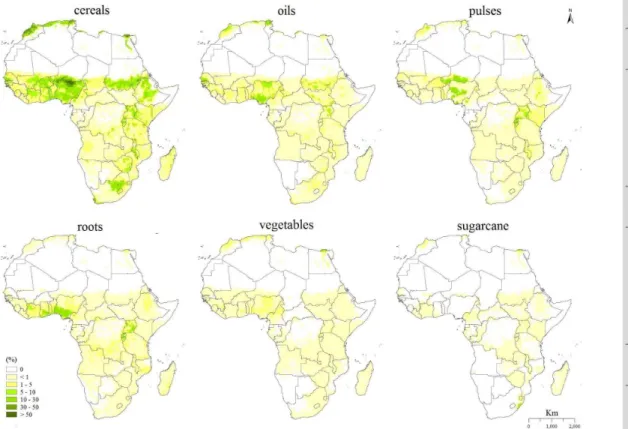
Six major irrigated crop groups, accounting for an average of 84 % of the total har-5
vested cropland in 2000 (165.7×10⁶ha) over the continent, were considered (Table 1).
These include: cereals, oils, roots, pulses, vegetables and sugar crops (sugarcane mostly in Africa). The proportion of the land area occupied by the different crop groups is shown in Fig. 2.
In certain areas, the aggregated crop group areas accounted for more than 84 % 10
of the harvested cropland. This is because double cropping occurs. Hence, in order to assure that double cropping does not entail exaggerated cropland areas, the crop group areas were downscaled by cell-by-cell factors, making the aggregated crop group area for those cells equal to 84 % of the harvested cropland.
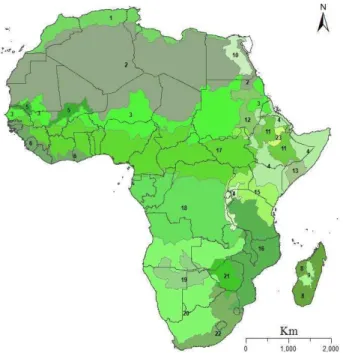
For the crop calendar, Africa can be divided into 23 irrigation cropping pattern zones, 15
within which crop calendar, irrigation method and cropping intensity can be assumed to be homogeneous within the cropland (FAO, 1997) (Fig. 3). This subdivision is applied in this study.
The crop calendar data have been extracted from the FAO crop calendar3and other
sources (FAO, 1992, 1986) and compiled into a calendar per crop group done for each 20
irrigation cropping pattern zone. The calendar indicates the specific crops present in the group for each irrigation cropping pattern zone (Supplement). Up to two specific crops from the same crop group can be cultivated per year on the same cropland and allows an annual cropping rotation.
The monthly crop water demand for each crop is determined by disaggregating to-25
tal (for one cropping season) crop water demand for that crop and knowledge of its crop calendar (Supplement). The seasonal crop water demand, growing periods and
3
HESSD
11, 6065–6097, 2014Mapping irrigation potential from groundwater in Africa
Y. Altchenko and K. G. Villholth
Title Page
Abstract Introduction
Conclusions References
Tables Figures
◭ ◮
◭ ◮
Back Close
Full Screen / Esc
Printer-friendly Version Interactive Discussion
Discussion
P
a
per
|
Discus
sion
P
a
per
|
Discussion
P
a
per
|
Discussion
P
a
per
|
associated single crop coefficients (Kc) for the various crops are extracted from the literature (FAO, 1992, 1986). Since the crop calendar includes entries with more than one specific crop for a crop group (e.g. millet/wheat for cereals) and they have simi-lar, but not equal monthly water demands (Supplement), a conservative approach is applied, whereby the larger figure for the crops have been applied, unless the diff er-5
ence between them is more than 40 mm, in which case this demand is reduced by 5 or 10 mm. The reason for applying the conservative approach is to ensure that the GWIP is not overestimated.
The irrigation efficiency (Irrig. Efficiency, Eq. 3) takes into consideration the water lost during the irrigation path from the water abstraction point to the water reaching the 10
plants. Water losses occur mainly during water transport (i.e. pipe leakage or evapo-ration/leakage in open canal system) and in the field (i.e. water running offthe surface or percolating past the root zone). Each irrigation cropping pattern zone has an irriga-tion efficiency coefficient based on figures found in the literature, type of crops irrigated and intensification level of the irrigation techniques (FAO, 1997) (Table 2). The coeffi -15
cient is mainly based on surface water irrigation and it is here assumed applicable to GWI. This assumption implies a conservative estimate of GWIP as open canal water transport from rivers or lakes is typically found less efficient than groundwater, which is abstracted more locally and in a distributed fashion (Foster and Perry, 2010).
3.3 Other groundwater uses
20
Irrigation is only one of the groundwater uses and it is necessary to take into account the other anthropogenic and environmental groundwater uses. They are divided into four categories: domestic, industrial, and livestock demands as well as environmental requirements. Irrigation from groundwater is possible only after the groundwater de-mands of these uses have been satisfied.
25
HESSD
11, 6065–6097, 2014Mapping irrigation potential from groundwater in Africa
Y. Altchenko and K. G. Villholth
Title Page
Abstract Introduction
Conclusions References
Tables Figures
◭ ◮
◭ ◮
Back Close
Full Screen / Esc
Printer-friendly Version Interactive Discussion
Discussion
P
a
per
|
Discus
sion
P
a
per
|
Discussion
P
a
per
|
Discussion
P
a
per
|
Domestic, industrial and livestock water demand is assumed constant over the period 1960–2000.
The environmental groundwater requirement remains highly uncertain. To account for this, three scenarios have been applied: the environmental groundwater require-ments represent 70 % (Scenario 1), 50 % (Scenario 2), and 30 % (Scenario 3) of the 5
recharge, respectively over the continent (Pavelic et al., 2013).
4 Calculation of groundwater irrigation potential
The GWIP (Eq. 1) is calculated as the average annual value over the 1960–2000 pe-riod, using annual estimates of irrigation water demand (Irrig. Water Demand). Hence, a temporal average of the irrigation potential is obtained. However, rather than equally 10
using the annual values of groundwater availability (GW Available), a constant aver-aged annual value of this parameter was used, rather than varying it between years. This in essence corresponds to smoothing out the variability in groundwater availability (and recharge) and accounting for the buffering effect of the resource. Hence, in low groundwater availability years, regular water availability is assumed. If the average GW 15
Available is negative in a cell (due to persistent low recharge years or high human and environmental demand), the availability is set to zero for that cell.
For the Irrig. Water Demand (Eq. 3), annual values were processed from aggregated monthly data, using crop water demand and green water for the individual crop groups within each cell, accounting for the share of each crop group on the total crop group 20
land (% of Area, Eq. 3). Since for each crop group, up to two specific crops can be grown in rotation on the same area but never concurrently (Supplement), the number of crops (n, Eq. 3) in this case refers to the number of crop groups, rather than specific crops. Similarly, the Crop Water Demand refers to the sum of the crop water demand of the actually grown crop in the crop group.
HESSD
11, 6065–6097, 2014Mapping irrigation potential from groundwater in Africa
Y. Altchenko and K. G. Villholth
Title Page
Abstract Introduction
Conclusions References
Tables Figures
◭ ◮
◭ ◮
Back Close
Full Screen / Esc
Printer-friendly Version Interactive Discussion
Discussion
P
a
per
|
Discus
sion
P
a
per
|
Discussion
P
a
per
|
Discussion
P
a
per
|
5 Results
The average net irrigation water demand (Irrig. Water Demand×Irrig. Efficiency) is
shown in Fig. 4. It is seen (Fig. 4a) that the irrigation demand reflects primarily the density of cropland (Fig. 1) and the aridity of the regions (Fig. 4b).
The groundwater available for irrigation is the surplus recharge after satisfying hu-5
man and environmental groundwater needs (Eq. 1). This varies according to the three scenarios (Fig. 5). The total renewable groundwater availability for irrigation across the
continent ranges from 692 (Scenario 1) to 1644 km3year−1 (Scenario 3). Not
surpris-ingly, the availability is greater along an equatorial band across the continent where rainfall and recharge are highest. It is also seen, that large parts of northern and south-10
ern Africa are devoid of excess recharge to enable irrigation from renewable ground-water resources.
Converting the groundwater availability into GWIP in terms of irrigable area, a similar pattern is found (Fig. 6). The white areas in central Africa with zero potential correspond to areas with no cropland, essentially areas covered by permanent forest. Appreciable 15
hydrological potential exists for groundwater irrigation across much of Africa, except for the most arid regions and in the most southern part where demand from other sec-tors compete with GWI (data not shown). Hence, most regions in the Sahel and the eastern tract of the continent, from Ethiopia down to Zimbabwe, may provide signifi-cant unexplored opportunities for groundwater development for agriculture, with up to 20
all cropland, and sometimes more, being irrigable from renewable groundwater. The maps also indicate that relatively large disparities in GWIP exist within individual coun-tries, e.g. Ethiopia, Mozambique, Malawi and Zambia. Potential hotspot areas should be further explored in terms of other factors governing the potential for GWI
develop-ment. Aggregating the GWIP across the continent, values range from 27.2×10⁶ha to
25
64.3×10⁶ha for the three scenarios, corresponding to 12.5 to 29.6 % of the cropland.
The GWIP for the 13 countries estimated by Pavelic et al. (2013) (13.5×10⁶ha) is here
HESSD
11, 6065–6097, 2014Mapping irrigation potential from groundwater in Africa
Y. Altchenko and K. G. Villholth
Title Page
Abstract Introduction
Conclusions References
Tables Figures
◭ ◮
◭ ◮
Back Close
Full Screen / Esc
Printer-friendly Version Interactive Discussion
Discussion
P
a
per
|
Discus
sion
P
a
per
|
Discussion
P
a
per
|
Discussion
P
a
per
|
present method does indicate the distributed extent of GWIP across the countries and for the whole continent. In Appendix A (Table A1), the GWIP for the individual coun-tries in Africa are given. The results show that the GWI area in Africa can safely be expanded by a factor of 10 or more, based on the conservative renewability and envi-ronmental requirements of the resource and the present human demands, possibly with 5
wide livelihood benefits for smallholder farmers in many Sahel and semi-arid regions of eastern Africa. Some blue areas with very high potential relative to the cropland area (Fig. 6i), as seen in arid parts of South Africa, Mali and Sudan can be explained by very small cropland areas relative to the cell size. Hence, accumulated recharge over the cell, albeit low in nominal terms, may be sufficient to irrigate these areas.
10
In order to further analyse the GWIP, and explore the untapped part of the poten-tial, the results are compared with existing data on the present development of GWI across Africa (Fig. 7). The map in Fig. 7a presents the best available continent-wide data for areas equipped for GWI (Siebert et al., 2010), while Fig. 7b shows the relative GWIP (in terms of area) in Scenario 2 (the environmental groundwater requirements 15
represent 50 % of recharge), expressed as the percentage of the data from Siebert. While this approach only captures and compares areas having non-negative values for present GWI development, it gives a clear indication of the contrast across the con-tinent with respect to the areas with and without further GWIP (the yellow and green areas vs. the red areas). In northern and southern Africa the untapped development 20
potential is very limited or patchy, while in western Africa and the eastern belt, still ap-preciable GWI development potential exists. These results also indicate, that presently GWI is mostly developed in regions with limited potential, and significantly in areas where groundwater is non-renewable (like in northern Africa) or where little uncommit-ted renewable groundwater resources exist. In fact, the method also gave indications 25
HESSD
11, 6065–6097, 2014Mapping irrigation potential from groundwater in Africa
Y. Altchenko and K. G. Villholth
Title Page
Abstract Introduction
Conclusions References
Tables Figures
◭ ◮
◭ ◮
Back Close
Full Screen / Esc
Printer-friendly Version Interactive Discussion
Discussion
P
a
per
|
Discus
sion
P
a
per
|
Discussion
P
a
per
|
Discussion
P
a
per
|
artefact is discernible in the horn of Africa. Here, appreciable GWI exists (Fig. 7a), while Fig. 1 shows no cropland. The explanation could be that areas in this region are mostly irrigated pasture land, or pasture land converted into irrigated cropland after the 2000 map of cropland (Fig. 1) was produced.
6 Discussion
5
6.1 Uncertainty and variability of recharge and environmental requirements
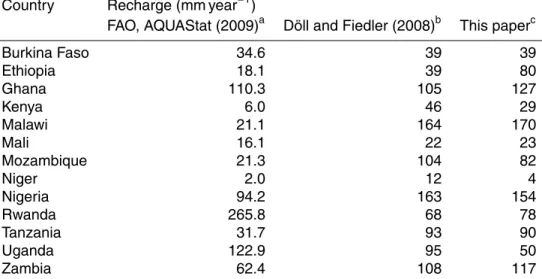
In assessing the confidence of the methodology presented, the uncertainty and tempo-ral variability of recharge as well as the uncertainty of the environmental requirements need to be taken into consideration. Table 4 summarizes estimations of
groundwa-ter recharge for a number of African countries from different sources. It shows that
10
the annual recharge estimation from the hydrological model PCR-GLOBWB (this pa-per) is quite similar to the one estimated from the WaterGAP Global Hydrology Model (WGHM) (Döll and Fiedler, 2008) while there is more discrepancy with the FAO dataset. Since the GWIP is strongly dependent on the recharge, this uncertainty will be reflected in the GWIP.
15
The maps in Fig. 8 present the average annual recharge (Fig. 8a) and the coeffi
-cient of variation of the recharge (Fig. 8b) of the 41 year simulation period. The coeffi -cient of variation shows clearly that the areas where the recharge is smaller (say less than 50 mm per year) also have the highest variability over the years. In these areas, recharge can vary from zero to double of the average recharge (dark red colour). The 20
results indicate that where groundwater recharge is sufficient to support GWI in these areas, it is likely to be a very strategic resource in buffering seasonal and inter-annual climate variability. Secondly, the actual buffering capacity of groundwater, which is gov-erned by the longer-term storage capacity of the aquifers, more so than the recharge, becomes equally important in these areas and need to be addressed in further and 25
HESSD
11, 6065–6097, 2014Mapping irrigation potential from groundwater in Africa
Y. Altchenko and K. G. Villholth
Title Page
Abstract Introduction
Conclusions References
Tables Figures
◭ ◮
◭ ◮
Back Close
Full Screen / Esc
Printer-friendly Version Interactive Discussion
Discussion
P
a
per
|
Discus
sion
P
a
per
|
Discussion
P
a
per
|
Discussion
P
a
per
|
only considered by using the long-term average GW Available in Eq. (1), as explained in the Sect. 4. Similarly, the buffering capacity of groundwater in a spatial sense was applied in assuming that all recharge in a cell can be captured anywhere in that cell.
The uncertainty associated with the environmental requirements relates to the lack of knowledge of the location and functioning of ecosystems dependent on groundwa-5
ter throughout Africa and their groundwater requirements in quantitative terms. Such ecosystems and their requirements may depend on the hydrogeological setup of an area, the scale of the aquifers, and the climate (Tomlinson, 2011). However, in ab-sence of better understanding and tested approaches, the three scenarios approach was used (Pavelic et al., 2013). When comparing the uncertainty related to the sce-10
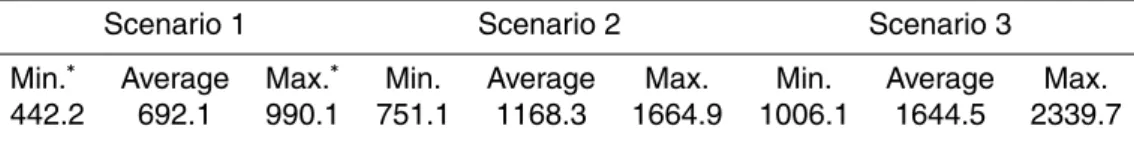
narios in terms of the GW Available (Table 5) (about 480 km3year−1
, as calculated
from the difference between the averages of Scenario 2 and 1, and Scenario 2 and 3,
respectively), and the uncertainty related to the recharge (estimated from the range be-tween the average and min. and average and max. annual GW Available for Scenario 2, which is 417 and 496 km3) it is apparent that the uncertainty on groundwater avail-15
ability related to the environmental requirements is on the same order of magnitude as the effect of the temporal variability of recharge.
6.2 Limitations of approach
The water balance approach considers renewable water availability as the major con-trolling parameter for GWIP and assumes non-limiting conditions in terms of other fun-20
damental physical properties, e.g. soil and water quality, terrain slope, and groundwa-ter accessibility (as degroundwa-termined by e.g. depth of the usable aquifer, storage available for recharge, and well yields) for the implementation of GWI. Considering an average landholding size of 1 ha with a single well, or alternatively 1 well per ha for landhold-ings larger than 1 ha, over the continent and the gross irrigation water demand per 25
HESSD
11, 6065–6097, 2014Mapping irrigation potential from groundwater in Africa
Y. Altchenko and K. G. Villholth
Title Page
Abstract Introduction
Conclusions References
Tables Figures
◭ ◮
◭ ◮
Back Close
Full Screen / Esc
Printer-friendly Version Interactive Discussion
Discussion
P
a
per
|
Discus
sion
P
a
per
|
Discussion
P
a
per
|
Discussion
P
a
per
|
with continental-wide maps of well yields (MacDonald et al., 2012), it is evident that in certain geological formations, like the basement rock aquifers, that occupy 34 % of the continent (Adelana and MacDonald, 2008), the yield of the geological substrata may in places be limiting for larger scale or very intensive GWI development.
Possible constraints related to hydrogeology as well as water quality and socio-5
economic constraints, such as infrastructure (roads, markets, energy/electricity) may further reduce this potential or hamper its realization as will be further analysed in a companion paper.
Furthermore, climate trends and progressive water demands from growing human and livestock populations have not been considered. For these reasons, it is suggested 10
to apply the most conservative estimates (i.e. Scenario 1) for a robust estimate of hydrological GWIP.
7 Conclusions
The present study has estimated the extent and distribution of groundwater irrigation
potential (GWIP) across the African continent (0.5◦ resolution), based on the
hydro-15
logically available and renewable groundwater over a 41 year recent historic period and using crop and cropland data from the beginning of the century. The GWIP is
as-sessed to be between 27.2×10⁶ha and 64.3×10⁶ha, depending on the proportion
of recharge assumed allocated preferentially to the environment (30–70 %), while as-suming constant human needs for groundwater. This is a gross estimate, disregarding 20
existing groundwater irrigation (GWI). However, with the present GWI area amounting
to approximately 2×10⁶ha, the difference between net and gross potential is small.
However, comparing GWIP to existing maps of GWI, it is clear, that present GWI has been primarily developed in northern and southern Africa where the development po-tential is relatively limited, and where it is governed by abstraction from non-renewable 25
HESSD
11, 6065–6097, 2014Mapping irrigation potential from groundwater in Africa
Y. Altchenko and K. G. Villholth
Title Page
Abstract Introduction
Conclusions References
Tables Figures
◭ ◮
◭ ◮
Back Close
Full Screen / Esc
Printer-friendly Version Interactive Discussion
Discussion
P
a
per
|
Discus
sion
P
a
per
|
Discussion
P
a
per
|
Discussion
P
a
per
|
This could significantly increase the food production and productivity in the region from a reliable and renewable resource.
The Supplement related to this article is available online at doi:10.5194/hessd-11-6065-2014-supplement.
Acknowledgements. Rens Van Beek, Geosciences – Utrecht University, kindly provided data
5
from the PCR-GLOBWB model. The work has been partially funded by the French Ministry of Agriculture and by USAID (Enhanced Regional Food Security through Increased Agricultural Productivity to Sustainably Reduce Hunger project of the USAID Southern Africa Feed The Future (FTF) programme (2012–2013)). It was also supported by CGIAR Strategic Research Program on Water, Land and Ecosystems (WLE).
10
References
Adelana, S. M. A. and MacDonald, A. M.: Groundwater research issues in Africa, in: Applied Groundwater Studies in Africa, edited by: Adelana, S. M. A. and MacDonald, A. M., IAH Selected Papers on Hydrogeology, no. 13, ch. 1, CRC Press, Taylor & Francis Group, London, UK, 507 pp., 2008.
15
Awulachew, S. B., Erkossa, T., and Namara, R. E.: Irrigation Potential in Ethiopia – Constraints and Opportunities for Enhancing the System, International Wa-ter Management Institute, available at: http://www.ata.gov.et/wp-content/uploads/ Ethiopia-Irrigation-Diagnostic-July-2010.pdf, last access: 20 May 2014, 59 pp., 2010. Comprehensive African Agriculture Development Programme – CAADP: Sustainable Land and
20
Water Management, The CAADP Pillar I Framework, available at: http://www.caadp.net/pdf/ CAADP%20Pillar%201%20Framework.pdf, last access: 21 May 2014, 76 pp., 2009.
Döll, P. and Fiedler, K.: Global-scale modeling of groundwater recharge, Hydrol. Earth Syst. Sci., 12, 863–885, doi:10.5194/hess-12-863-2008, 2008.
FAO: Irrigation Water Management: Irrigation Water Need, Training Manual no. 3, edited by:
25
HESSD
11, 6065–6097, 2014Mapping irrigation potential from groundwater in Africa
Y. Altchenko and K. G. Villholth
Title Page
Abstract Introduction
Conclusions References
Tables Figures
◭ ◮
◭ ◮
Back Close
Full Screen / Esc
Printer-friendly Version Interactive Discussion
Discussion
P
a
per
|
Discus
sion
P
a
per
|
Discussion
P
a
per
|
Discussion
P
a
per
|
FAO: Irrigation Water Management: Irrigation Scheduling, Training Manual no. 4, edited by: Brouwer, C., Prins, K., and Heibloem, M., Food and Agriculture Organization of United Na-tions, Rome, Italy, Land and Water Development Division, 66 pp., 1989.
FAO: Crop Water Requirements, FAO Irrigation and Drainage Paper no. 24, edited by: Dooren-bos, J., Pruitt, W. O., Aboukhaled, A., Damagnez, J., Dastane, N. G., Van den Berg, C.,
5
Rijtema, P. E., Ashford, O. M., and Frere, M., Food and Agriculture Organization of United Nations, Land and Water Development Division, Rome, Italy, 144 pp., 1992.
FAO: Irrigation Potential in Africa: a Basin Approach, FAO Land and Water Bulletin 4, Food and Agriculture Organization of United Nations, Land and Water Development Division, Rome, Italy, 177 pp., 1997.
10
FAO: Irrigation in Africa in Figures, AQUASTAT Survey – 2005, FAO Water Reports no. 29, Food and Agriculture Organization of the United Nations, Rome, available at: ftp://ftp.fao.org/ agl/aglw/docs/wr29_eng.pdf, last access: 20 May 2014, 74 pp., 2005.
FAO: Population density (persons/km2), available at: http://www.fao.org/geonetwork/srv/ en/resources.get?id=30586&fname=poprecl_ASCII.zip&access=private (last access:
15
31 March 2014), 2007a.
FAO: Gridded livestock of the world, available at: http://www.fao.org/ag/againfo/resources/en/ glw/GLW_dens.html (last access: 31 March 2014), 2007b.
Foster, S. and Perry, C.: Improving groundwater resource accounting in irrigated areas: a pre-requisite for promoting sustainable use, Hydrogeol. J., 18, 291–294,
doi:10.1007/s10040-20
009-0560-x, 2010.
MacDonald, A. M., Calow, R. C., Nicol, A. L., Hope, B., and Robins, N. S.: Ethiopia: water security and drought, Technical Report WC/01/02, British Geological Survey, Nottingham, available at: http://nora.nerc.ac.uk/501045/1/Ethiopia_map.pdf (last access: 20 May 2014), 2001.
25
MacDonald, A. M., Bonsor, H. C., Dochartaigh, B. É. Ó., and Taylor, R. G.: Quantitative maps of groundwater resources in Africa, Environ. Res. Lett., 7, 024009, doi:10.1088/1748-9326/7/2/024009, 2012.
Margat, J. and Van der Gun, J.: Groundwater Around the World: a Geographic Synopsis, CRC Press, Taylor & Francis Group, London, UK, 376 pp., 2013.
30
HESSD
11, 6065–6097, 2014Mapping irrigation potential from groundwater in Africa
Y. Altchenko and K. G. Villholth
Title Page
Abstract Introduction
Conclusions References
Tables Figures
◭ ◮
◭ ◮
Back Close
Full Screen / Esc
Printer-friendly Version Interactive Discussion
Discussion
P
a
per
|
Discus
sion
P
a
per
|
Discussion
P
a
per
|
Discussion
P
a
per
|
Ministry of Finance and Economic Development – MoFED: The Federal Democratic Republic of Ethiopia: Growth and Transformation Plan (GTP) 2010/11–2014/15 Draft, September 2010, Addis Ababa, 85 pp., 2010.
Ministry of Food and Agriculture and Ghana Irrigation Development Authority – MoFA and GIDA: National Irrigation Policy, Strategies and Regulatory Measures,
5
GIDA, Accra, available at: http://mofa.gov.gh/site/wp-content/uploads/2011/07/ GHANA-IRRIGATION-DEVELOPMENT-POLICY1.pdf, last access: 20 May 2014, 37 pp., 2011.
Ministry of Irrigation and Water Development – MoIWD: The Republic of Malawi: National Water Policy, Lilongwe, available at: http://www.moafsmw.org/Key%20Documents/National%
10
20Water%20Policy%20FINAL.pdf (last access: 4 April 2014), 2005.
Ministry of Water and Environmental Affairs – MoWEA: The Republic of South Africa: Na-tional Water Resource Strategy, Department of Water Affairs, available at: http://www. dwaf.gov.za/nwrs/LinkClick.aspx?fileticket=u_qFQycClbI%3d&tabid=91&mid=496 (last ac-cess: 4 April 2014), 2013.
15
New Partnership for Africa’s Development – NEPAD: Comprehensive Africa Agriculture Devel-opment Programme, available at: http://www.nepad.org/system/files/caadp.pdf, last access: 20 May 2014, 102 pp., 2003.
Pavelic, P., Smakhtin, V., Favreau, G., and Villholth, K. G.: Water-balance approach for assess-ing potential for smallholder groundwater irrigation in Sub-Saharan Africa, Water SA, 38,
20
399–406, doi:10.4314/wsa.v38i3.5, 2012.
Pavelic, P., Villholth, K. G., Smakhtin, V., Shu, Y., and Rebelo, L. M.: Smallholder groundwater irrigation in Sub-Saharan Africa: country-level estimates of development potential, Water Int., 38, 392–407, doi:10.1080/02508060.2013.819601, 2013.
Ramankutty, N., Evan, A., Monfreda, C., and Foley, J.: Farming the planet: 1. Geographic
dis-25
tribution of global agricultural lands in the year 2000, Global Biogeochem. Cy., 22, GB1003, doi:10.1029/2007GB002952, 2008.
Siebert, S., Burke, J., Faures, J. M., Frenken, K., Hoogeveen, J., Döll, P., and Portmann, F. T.: Groundwater use for irrigation – a global inventory, Hydrol. Earth Syst. Sci., 14, 1863–1880, doi:10.5194/hess-14-1863-2010, 2010.
30
HESSD
11, 6065–6097, 2014Mapping irrigation potential from groundwater in Africa
Y. Altchenko and K. G. Villholth
Title Page
Abstract Introduction
Conclusions References
Tables Figures
◭ ◮
◭ ◮
Back Close
Full Screen / Esc
Printer-friendly Version Interactive Discussion
Discussion
P
a
per
|
Discus
sion
P
a
per
|
Discussion
P
a
per
|
Discussion
P
a
per
|
Van Beek, L. P. H., Wada, Y., and Bierkens, M. F. P.: Global monthly water stress: I. Water bal-ance and water availability, Water Resour. Res., 47, W07517, doi:10.1029/2010WR009791, 2011.
Villholth, K. G.: Groundwater irrigation for smallholders in Sub-Saharan Africa – a syn-thesis of current knowledge to guide sustainable outcomes, Water Int., 38, 369–391,
5
doi:10.1080/02508060.2013.821644, 2013.
You, L., Ringler, C., Nelson, G., Wood-Sichra, U., Robertson, R., Wood, S., Guo, Z., Zhu, T., and Sun, Y.: What Is the Irrigation Potential for Africa? A Combined Biophysical and Socioe-conomic Approach, IFPRI Discussion Paper 00993, June 2010, IFPRI, available at: http: //www.ifpri.org/sites/default/files/publications/ifpridp00993.pdf (last access: 20 May 2014),
10
HESSD
11, 6065–6097, 2014Mapping irrigation potential from groundwater in Africa
Y. Altchenko and K. G. Villholth
Title Page
Abstract Introduction
Conclusions References
Tables Figures
◭ ◮
◭ ◮
Back Close
Full Screen / Esc
Printer-friendly Version Interactive Discussion
Discussion
P
a
per
|
Discus
sion
P
a
per
|
Discussion
P
a
per
|
Discussion
P
a
per
|
Table 1.Areal proportion of crop groups cultivated in Africa for the year 2000, adapted from Monfreda et al. (2008).
Crop group Area (106ha) Proportion (%)
Cereals 79.4 47.92
Oils 19.6 11.83
Roots 17.8 10.74
Pulses 16.3 9.84
Vegetables 4.4 2.66
Sugar crops 1.4 0.84
Fruit 8.4 5.07
Forage 3.7 2.23
Fiber 4.2 2.53
Tree nuts 1.3 0.78
Other crops 9.2 5.56
HESSD
11, 6065–6097, 2014Mapping irrigation potential from groundwater in Africa
Y. Altchenko and K. G. Villholth
Title Page
Abstract Introduction
Conclusions References
Tables Figures
◭ ◮
◭ ◮
Back Close
Full Screen / Esc
Printer-friendly Version Interactive Discussion
Discussion
P
a
per
|
Discus
sion
P
a
per
|
Discussion
P
a
per
|
Discussion
P
a
per
|
Table 2.Irrigation efficiency dependent on irrigation cropping pattern zone (FAO, 1997).
Irrigation Zone Irrigation
cropping name efficiency
pattern (%)
zone number
1 Mediterranean coastal zone 60
2 Sahara oases 70
3 Semi-arid to arid savanna West–East Africa 50
4 Semi-arid/arid savanna East Africa 50
5 Niger/Senegal rivers 45
6 Gulf of Guinea 50
7 Southern Sudan 50
8 Madagascar tropical lowland 50
9 Madagascar highland 50
10 Egyptian Nile and Delta 80
11 Ethiopian highlands 50
12 Sudanese Nile area 80
13 Shebelli-Juba river area in Somalia 50
14 Rwanda – Burundi – Southern Uganda highland 50
15 Southern Kenya – Northern Tanzania 50
16 Malawi – Mozambique – Southern Tanzania 45
17 West and Central African humid areas 45
18 Central African humid areas below equator 45
19 Rivers effluents on Angola/Namibia/Botswana border 50 20 South Africa – Namibia – Botswana desert and steppe 65
21 Zimbabwe highland 60
22 South Africa – Lesotho – Swaziland 60
HESSD
11, 6065–6097, 2014Mapping irrigation potential from groundwater in Africa
Y. Altchenko and K. G. Villholth
Title Page
Abstract Introduction
Conclusions References
Tables Figures
◭ ◮
◭ ◮
Back Close
Full Screen / Esc
Printer-friendly Version Interactive Discussion
Discussion
P
a
per
|
Discus
sion
P
a
per
|
Discussion
P
a
per
|
Discussion
P
a
per
|
Table 3.Other groundwater uses (adapted from Pavelic et al., 2013).
Uses/unit Daily water Portion assumed to
need (L) come from groundwater (%)
Domestic Inhabitant 50 75
Industrial Inhabitant 25 75
Livestock Big ruminant 40 100
Small ruminant 20 100
Pig 30 100
HESSD
11, 6065–6097, 2014Mapping irrigation potential from groundwater in Africa
Y. Altchenko and K. G. Villholth
Title Page
Abstract Introduction
Conclusions References
Tables Figures
◭ ◮
◭ ◮
Back Close
Full Screen / Esc
Printer-friendly Version Interactive Discussion
Discussion
P
a
per
|
Discus
sion
P
a
per
|
Discussion
P
a
per
|
Discussion
P
a
per
|
Table 4.Comparison of estimations of groundwater recharge for selected African countries.
Country Recharge (mm year−1)
FAO, AQUAStat (2009)a Döll and Fiedler (2008)b This paperc
Burkina Faso 34.6 39 39
Ethiopia 18.1 39 80
Ghana 110.3 105 127
Kenya 6.0 46 29
Malawi 21.1 164 170
Mali 16.1 22 23
Mozambique 21.3 104 82
Niger 2.0 12 4
Nigeria 94.2 163 154
Rwanda 265.8 68 78
Tanzania 31.7 93 90
Uganda 122.9 95 50
Zambia 62.4 108 117
ahttp://www.fao.org/nr/water/aquastat/main/index.stm (last access: 2 April 2014). bData as provided in Margat and Gun (2013).
HESSD
11, 6065–6097, 2014Mapping irrigation potential from groundwater in Africa
Y. Altchenko and K. G. Villholth
Title Page
Abstract Introduction
Conclusions References
Tables Figures
◭ ◮
◭ ◮
Back Close
Full Screen / Esc
Printer-friendly Version Interactive Discussion
Discussion
P
a
per
|
Discus
sion
P
a
per
|
Discussion
P
a
per
|
Discussion
P
a
per
|
Table 5.Aggregated groundwater available (km3year−1
) for the three environmental scenarios.
Scenario 1 Scenario 2 Scenario 3
Min.∗ Average Max.∗ Min. Average Max. Min. Average Max. 442.2 692.1 990.1 751.1 1168.3 1664.9 1006.1 1644.5 2339.7
HESSD
11, 6065–6097, 2014Mapping irrigation potential from groundwater in Africa
Y. Altchenko and K. G. Villholth
Title Page Abstract Introduction Conclusions References Tables Figures ◭ ◮ ◭ ◮ Back Close
Full Screen / Esc
Printer-friendly Version Interactive Discussion Discussion P a per | Discus sion P a per | Discussion P a per | Discussion P a per |
Table A1.Gross groundwater irrigation potential per country in Africa.
Countries Area of cropland irrigable
with groundwater∗(103ha)
Scenario (Percentage of groundwater going to environment)
1 2 3
(30 %) (50 %) (70 %)
Algeria 87 58 30
Angola 4458 3180 1901
Benin 454 323 191
Botswana 68 48 28
Burkina Faso 330 232 133
Burundi 124 86 49
Cameroon 3484 2483 1483
Central African Republic 4141 2956 1771
Chad 602 427 252
Côte d’Ivoire 1781 1267 754
Democratic Republic of Congo 12 443 8876 5309
Djibouti 3 2 1
Egypt 2 1 1
Equatorial Guinea 280 200 120
Eritrea 11 7 4
Ethiopia 3161 2233 1306
Gabon 2279 1628 976
Gambia 28 20 11
Ghana 930 659 388
Guinea 2011 1434 857
Guinea-Bissau 166 118 71
Kenya 447 310 173
Lesotho 12 8 5
Liberia 1272 908 544
Libya 21 15 8
Madagascar 4871 3473 2075
Malawi 511 363 214
Mali 784 556 329
Mauritania 61 43 26
Morocco 115 77 40
Mozambique 1764 1256 748
Namibia 94 67 39
Niger 32 20 10
Nigeria 4281 3023 1766
Republic of Congo 2918 2082 1246
Rwanda 73 50 28
Senegal 417 295 174
Sierra Leone 1298 926 554
Somalia 60 42 24
South Africa 181 120 63
South Sudan 1453 1033 613
Sudan 431 300 170
Swaziland 14 10 6
Tanzania 2390 1696 1003
Togo 269 191 113
Tunisia 19 13 6
Uganda 440 308 175
Western Sahara 0 0 0
Zambia 2976 2122 1268
Zimbabwe 301 211 121
HESSD
11, 6065–6097, 2014Mapping irrigation potential from groundwater in Africa
Y. Altchenko and K. G. Villholth
Title Page
Abstract Introduction
Conclusions References
Tables Figures
◭ ◮
◭ ◮
Back Close
Full Screen / Esc
Printer-friendly Version Interactive Discussion
Discussion
P
a
per
|
Discus
sion
P
a
per
|
Discussion
P
a
per
|
Discussion
P
a
per
|
Figure 1.Proportion of cropland per cell (0.5◦
HESSD
11, 6065–6097, 2014Mapping irrigation potential from groundwater in Africa
Y. Altchenko and K. G. Villholth
Title Page
Abstract Introduction
Conclusions References
Tables Figures
◭ ◮
◭ ◮
Back Close
Full Screen / Esc
Printer-friendly Version Interactive Discussion
Discussion
P
a
per
|
Discus
sion
P
a
per
|
Discussion
P
a
per
|
Discussion
P
a
per
|
Figure 2.Proportion of crop group area per cell (0.5◦
HESSD
11, 6065–6097, 2014Mapping irrigation potential from groundwater in Africa
Y. Altchenko and K. G. Villholth
Title Page
Abstract Introduction
Conclusions References
Tables Figures
◭ ◮
◭ ◮
Back Close
Full Screen / Esc
Printer-friendly Version Interactive Discussion
Discussion
P
a
per
|
Discus
sion
P
a
per
|
Discussion
P
a
per
|
Discussion
P
a
per
|
Figure 3. Delineation of the 23 irrigation cropping pattern zones in Africa (based on FAO, 1997).4
4
HESSD
11, 6065–6097, 2014Mapping irrigation potential from groundwater in Africa
Y. Altchenko and K. G. Villholth
Title Page
Abstract Introduction
Conclusions References
Tables Figures
◭ ◮
◭ ◮
Back Close
Full Screen / Esc
Printer-friendly Version Interactive Discussion
Discussion
P
a
per
|
Discus
sion
P
a
per
|
Discussion
P
a
per
|
Discussion
P
a
per
|
Figure 5. Average groundwater availability for irrigation (1960–2000), expressed in mill. m3year−1
cell−1
(0.5◦
HESSD
11, 6065–6097, 2014Mapping irrigation potential from groundwater in Africa
Y. Altchenko and K. G. Villholth
Title Page
Abstract Introduction
Conclusions References
Tables Figures
◭ ◮
◭ ◮
Back Close
Full Screen / Esc
Printer-friendly Version Interactive Discussion
Discussion
P
a
per
|
Discus
sion
P
a
per
|
Discussion
P
a
per
|
Discussion
P
a
per
|
Figure 6.(I) Total area in 103ha irrigable with groundwater inside a cell (0.5◦
HESSD
11, 6065–6097, 2014Mapping irrigation potential from groundwater in Africa
Y. Altchenko and K. G. Villholth
Title Page
Abstract Introduction
Conclusions References
Tables Figures
◭ ◮
◭ ◮
Back Close
Full Screen / Esc
Printer-friendly Version Interactive Discussion
Discussion
P
a
per
|
Discus
sion
P
a
per
|
Discussion
P
a
per
|
Discussion
P
a
per
|
Figure 8. (a)Average annual recharge (mm year−1