www.hydrol-earth-syst-sci.net/20/1971/2016/ doi:10.5194/hess-20-1971-2016
© Author(s) 2016. CC Attribution 3.0 License.
Crop-specific seasonal estimates of irrigation-water
demand in South Asia
Hester Biemans1, Christian Siderius1,2, Ashok Mishra3, and Bashir Ahmad4
1Alterra, Wageningen University and Research Centre, Wageningen, the Netherlands
2Environmental Economics and Natural Resources Group, Wageningen University, Wageningen, the Netherlands 3Agricultural and Food Engineering Department, IIT Kharagpur, Kharagpur, India
4Pakistan Agricultural Research Council, Islamabad, Pakistan
Correspondence to:Hester Biemans ([email protected])
Received: 17 June 2015 – Published in Hydrol. Earth Syst. Sci. Discuss.: 12 August 2015 Revised: 5 March 2016 – Accepted: 8 March 2016 – Published: 17 May 2016
Abstract. Especially in the Himalayan headwaters of the main rivers in South Asia, shifts in runoff are expected as a result of a rapidly changing climate. In recent years, our insight into these shifts and their impact on water availabil-ity has increased. However, a similar detailed understanding of the seasonal pattern in water demand is surprisingly ab-sent. This hampers a proper assessment of water stress and ways to cope and adapt. In this study, the seasonal pattern of irrigation-water demand resulting from the typical prac-tice of multiple cropping in South Asia was accounted for by introducing double cropping with monsoon-dependent plant-ing dates in a hydrology and vegetation model. Crop yields were calibrated to the latest state-level statistics of India, Pak-istan, Bangladesh and Nepal. The improvements in seasonal land use and cropping periods lead to lower estimates of irrigation-water demand compared to previous model-based studies, despite the net irrigated area being higher. Crop irrigation-water demand differs sharply between seasons and regions; in Pakistan, winter (rabi) and monsoon sum-mer (kharif) irrigation demands are almost equal, whereas in Bangladesh the rabi demand is ∼100 times higher. More-over, the relative importance of irrigation supply versus rain decreases sharply from west to east. Given the size and im-portance of South Asia improved regional estimates of food production and its irrigation-water demand will also affect global estimates. In models used for global water resources and food-security assessments, processes like multiple crop-ping and monsoon-dependent planting dates should not be ignored.
1 Introduction
As global demand for food increases, water resources – one of the main resources for producing food – are becoming in-creasingly stressed. South Asia, home to∼25 % of the world population, is often identified as one of the future water-stress hotspots (Kummu et al., 2014; Wada et al., 2011). Ex-cess food production in recent years has obscured this bleak future; increases in both agricultural productivity and crop-land extension have made the region food self-sufficient in its staple crops in recent decades. But the resources that sup-ported this increase – surface- and groundwater extracted for irrigation, land converted into cropland, increased use of nu-trients and pesticides – are not unlimited. Groundwater levels are already falling rapidly in large parts of South Asia due to overexploitation (Rodell et al., 2009; Tiwari et al., 2009) and surface-water irrigation is reaching its limits (Biemans, 2012), costly river interlinking schemes aside (Bagla, 2014; Gupta and Deshpande, 2004). In addition, higher tempera-tures and an expected higher variability in climate due to global warming further jeopardizes future food production in this region (Krishna Kumar et al., 2004; Mall et al., 2006; Moors et al., 2011).
the active–break cycle of the monsoon, which governs intra-seasonal droughts (Joseph and Sabin, 2008), both influenced by large-scale phenomena like El Niño (Joseph et al., 1994). Effort has also gone into quantifying the seasonal availabil-ity of snowmelt and glacier melt runoff on the regional scale (Bookhagen and Burbank, 2010; Siderius et al., 2013a), with intra-annual shifts in runoff expected in the future due to cli-mate change (Immerzeel et al., 2013; Lutz et al., 2014; Math-ison et al., 2015; Rees and Collins, 2006). When it comes to estimating water demand, however, a similar detailed under-standing of the seasonal pattern is surprisingly absent.
Two essential and well-known agricultural characteristics that distinguish South Asia from most other large food-producing regions in the world govern this water demand. First, South Asia’s agriculture is characterized by a high de-gree of multiple cropping. A first crop during the monsoon season (kharif) is often succeeded by a second crop during the dry season (rabi) (Portmann et al., 2010). Planting dates for the kharif crop are determined primarily by the onset of the monsoon rather than by an accumulation of degree days. High maximum temperatures form a constraint for crop pro-duction during the rabi season, favouring planting as early as possible. Second, with rainfall highly concentrated during June–September and significant moisture deficits occurring during the other months of the year, crop production is to a very large extent supported by a combination of canal and groundwater irrigation, especially in the dry winter season (rabi) (GoI, 2012).
Many models that are used for global to regional water resources assessments still lack representation of multiple cropping (e.g. Arnold and Fohrer, 2005; Best et al., 2011; Gerten et al., 2004; Liang et al., 1994). Typically, a single cropping period per year is simulated with a degree-day-based or predefined single planting date (see, e.g., Elliott et al., 2014; Kummu et al., 2014). Exceptions are the model by Wada et al. (2011), who applied multiple cropping in their es-timation of water stress, but in a simplified aggregated form without distinguishing between different crops and the mod-els of Alcamo et al. (2003) and Hanasaki et al. (2008), who applied multiple-cropping seasons using optimized planting dates. However, Hanasaki et al. (2008) noted that their opti-mization mainly reacted to cold spells and was performed un-der rainfed conditions, which does not lead to optimal plant-ing dates for the South Asia region. The study of Hoogeveen et al. (2015) accounted for multiple cropping by incorporat-ing national level FAO croppincorporat-ing calenders, but only present total mean annual irrigation demands for South Asia (Ta-ble 1). Siebert and Döll (2010) also took multiple cropping into account by using MIRCA land use data (as in the present study; see Sect. 2.2) and cropping calenders (Portmann et al., 2010). They showed results for global seasonal irrigation demands, but not for South Asia specifically. As a result, crop-specific seasonal estimates of irrigation-water demand in South Asia are still lacking.
In this paper, we aim to provide such spatially ex-plicit, crop-specific seasonal estimates of water demand and crop production, using a revised version of the Lund-Potsdam-Jena managed Land (LPJmL) hydrology and veg-etation model (Gerten et al., 2004), adjusted for the re-gion. We distinguish two main South Asian cropping peri-ods, kharif and rabi, and introduce zone-specific, monsoon-onset-determined planting dates for 12 major crop types, both rainfed and irrigated. We calibrate the improved model against the latest sub-national statistics on seasonal crop yields from four different countries – India, Pakistan, Nepal and Bangladesh – and explicitly evaluate the irrigation-water demand and crop production for the two cropping seasons.
2 Methodology 2.1 LPJmL
We used the LPJmL global hydrology and vegetation model for bio- and agro-spheres (Bondeau et al., 2007; Sitch et al., 2003), but developed a version that contains more spatial and temporal detail for South Asia. The LPJmL model has been widely applied to study the effects of climate change on water availability and requirements for food production at a global scale (Gerten et al., 2011; Falkenmark et al., 2009) and the potential of rainfed water-management options for rais-ing global crop yields (Rost et al., 2009). For South Asia, the model has been applied to study the adaptation potential of increased dam capacity and improved irrigation efficiency in light of climate change (Biemans et al., 2013). LPJmL physi-cally links the terrestrial hydrological cycle to the carbon cy-cle, making it a suitable tool for studying the relationship be-tween water availability and crop production. The model in-cludes algorithms to account for human influences on the hy-drological cycle, e.g. irrigation extractions and supply (Rost et al., 2008). Production and water use for 12 different crops, both rainfed and irrigated are simulated. LPJmL is a grid-based model, run at a resolution of 0.5◦, and at a daily time step.
Net irrigation-water demand (consumption) for irrigated crops is calculated daily in each grid cell as the minimum amount of additional water needed to fill the soil to field ca-pacity and the amount needed to fulfil the atmospheric evap-orative demand (Rost et al., 2008). Subsequently, the gross irrigation demand (withdrawal) accounts for application and conveyance losses, and is calculated by multiplying the net irrigation-water demand with a country-specific efficiency factor (Rohwer et al., 2007), which is different for surface-water irrigation and groundsurface-water irrigation (as in Biemans et al., 2013). Irrigation efficiency for canal water is estimated at 37.5 % in India, Bangladesh, Nepal and 30 % in Pakistan (Rohwer et al., 2007); efficiency of groundwater irrigation is estimated at 70 % for all countries (following Gupta and Deshpande, 2004).
Surface water is defined as the water available in local rivers, lakes and reservoirs and is calculated by a daily rout-ing algorithm (Biemans et al., 2009). Irrigation-water de-mand is assumed to be withdrawn from available surface wa-ter first. If surface wawa-ter is unavailable, it is assumed to be withdrawn from groundwater (Rost et al., 2008).
Crop growth is simulated based on daily assimilation of carbon in four pools: leaves, stems, roots and harvestable storage organs. Carbon allocated to those pools depends on crop phenology and is adjusted in case of water stress on the plants. Crops are harvested when either maturity or the max-imum number of growing days is reached (Bondeau et al., 2007; Fader et al., 2010).
To improve the understanding of spatial and temporal het-erogeneity in irrigation-water demand and crop production in South Asia, we made some adjustments to the version of LPJmL that is used for global studies. First of all, we intro-duced the simulation of two cropping cycles per year by de-veloping two different land use maps for kharif and rabi. Sec-ond, we applied zone-specific sowing dates related to mon-soon patterns. Third, we accounted for regional differences in crop management by performing a calibration of crop yields at the subnational level. In the next three sections, those ad-justments to LPJmL are explained in more detail.
In our experimental set-up, LPJmL is forced with daily precipitation, daily mean temperature, net longwave and downward shortwave radiation derived from the WFDEI data set (WATCH Forcing Data methodology applied to ERA-Interim reanalysis data) (Weedon et al., 2014). Using this data set, all LPJmL simulations were done for the period 1979–2009 after a 1000 year spin-up period to bring car-bon and water pools into equilibrium. The calibration and all analysis presented in this paper uses the simulation re-sults of the period 2003–2008 for comparison with available statistics. Kharif and rabi irrigation-water demand and crop production are estimated by performing two simulations us-ing different land use input and sowus-ing-date input data sets. Those two runs are subsequently combined to attain the sea-sonal pattern for irrigation-water demand and crop produc-tion.
For comparison and to show model improvements, LPJmL is also run with the single cropping land use input as in pre-vious model studies (Biemans et al., 2013) for which sow-ing dates are determined based on climate as in Waha et al. (2012).
2.2 Development of land use maps for kharif and rabi seasons
other gridded data sets for total cropland extent (Ramankutty et al., 2008), total harvested area (Monfreda et al., 2008), and area equipped for irrigation (Siebert et al., 2007), but has more temporal detail. For India, MIRCA2000 includes sub-national (i.e. state-level) information on the start and end of cropping periods. The data set explicitly includes multiple cropping.
Crop classes in MIRCA2000 were first aggregated to the crop classes available in the LPJmL model, which are fewer (12, irrigated and non-irrigated, plus one class with “other perennial crops”, versus 26 in MIRCA) but include the most important food crops for South Asia (see Fig. 2 for distin-guished crops). The exact period of monsoon (kharif) and dry season (rabi) cropping differs according to region. In India, kharif sowing is strongly related to the onset of the monsoon, whereas in large parts of Pakistan – where the monsoon is less pronounced – sowing can happen earlier or later because other factors like water availability for irrigation are more important. From the monthly MIRCA cropping calendars we decided to define the cropped area of the kharif season as the area under cultivation per crop as in September and that of rabi as the area per crop as in January. Perennial crops were only included in the kharif land use map.
Next, a few adjustments to the obtained data were made. First, MIRCA specifies three rotations of rice in northern In-dia, two during summer and one during winter months. We merged the two summer rotations to the kharif rice area and allocated one to the rabi rice area, accepting a potential mi-nor mismatch between data sets. Second, we corrected wheat and rice areas, both of which MIRCA equally divides over rabi and kharif. In reality, rice is mainly cropped during the kharif season and wheat is only cropped during the rabi (win-ter) season, when temperatures are lower and heat stress is avoided. We shifted all irrigated wheat to the rabi season and made compensations where possible by shifting an equal amount of irrigated rice area to the kharif season. Third, we shifted 45 % of area cropped with pulses from the rabi to kharif season to comply with the latest agricultural statis-tics (GoI, 2012). In this way, consistency with other data sets was largely maintained (i.e. total cultivated area, cultivated area per crop, area irrigated), while at the same time a better match with crop phenology and regional agricultural prac-tices was achieved.
Finally, we updated the area irrigated to the latest statistics. MIRCA represents land use and irrigated area for the period 1998–2002. Over the past 10 years, irrigated area has further increased in India alone from 76 to 86 million ha (gross irri-gated area), to 44 % of the total area. Statistics for India show (GoI, 2012) that the increase in irrigated area occurred for all crops. By shifting 10 % of rainfed area to irrigated area, while keeping the overall cropped area the same, we achieved an in-crease in gross irrigated area. We assumed that the all-India trend is mirrored in the neighbouring counties. Cropped area was then aggregated to 0.5◦ grids for both kharif and rabi, which formed the input into the LPJmL model. The resulting
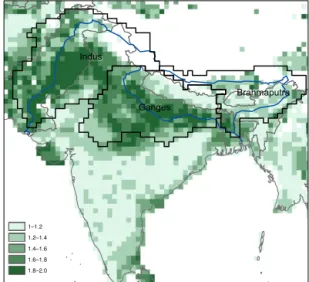
Indus
Ganges
Brahmaputra
1–1.2 1.2–1.4 1.4–1.6 1.6–1.8 1.8–2.0
Figure 1.Cropping intensity in South Asia (land use data sets de-rived for this study based on MIRCA2000. Average cropping inten-sity is defined here as the total annual harvested area (kharif and rabi) divided by the maximum cropped area of the two cropping seasons. Study-basin delineations are indicated in black.
land use input is in good agreement with subnational statis-tics on cropping areas in kharif and rabi (see Supplement, Figs. S1–S6).
Figure 1 shows the cropping intensity in the study region according to this newly compiled data set, as well as the de-lineation of the river basins for which we will present our results. Figure 2 shows the total cropped area during the kharif and rabi seasons for all major crops in South Asia (In-dia, Pakistan, Nepal and Bangladesh) according to the input data compiled here and compared to the agricultural statistics (GoI, 2014; Statistics, 2014).
2.3 Adjusted planting dates for kharif and rabi crops
Sowing dates for kharif crops are closely related to the onset of the monsoon as farmers start (trans)planting rice or other crops when the first rains have arrived. Normal onset dates of the monsoon over South Asia are determined by the India Meteorological Department, at 5- to 15-day intervals (IMD, 2015) (Fig. 3). The onset of the monsoon starts in Kerala in southern India around the first of June (Julian day 152) and arrives in western Pakistan around mid-July (Julian day 197). For the model simulations in this study, sowing dates for kharif crops were set to five days after the onset of the mon-soon, because several days of rain are needed before a crop is (trans)planted (Fig. 3). Inter-annual variations in the onset of the monsoon were not taken into account in this study. The perennial crop sugarcane is assumed to be planted on this date as well.
0 10 20 30 40 50 60 70
Tropical cereals
0 10 20 30 40 50 60 70
Wheat Ri
c
e
Ma
iz
e
Pulses
So
y
b
e
a
n
s
Gr
o
u
n
d
n
u
ts
Ra
p
e
s
e
e
d
Sugarcane
0 10 20 30 40 50 60 70
Kharif − statistics Rabi − statistics Annual − statistics Kharif − LPJmL Rabi − LPJmL Annual − LPJmL
Crop area (MHa)
Figure 2.Total crop area in South Asia (India, Pakistan, Nepal and Bangladesh) for different crops in the two dominant growing seasons. National statistics (average of 2003–2008) versus LPJmL input data derived from MIRCA as described in Sect. 2.2. For the spatial distribution of crops between states and provinces of India and Pakistan, Nepal and Bangladesh, see Annex. Temperate and tropical roots and sunflower are not shown because they occupy relatively small areas; other perennial crops are not shown because there are no statistics available.
Figure 3.Normal dates for the onset of the south-west monsoon as presented by the Indian Meteorological Department (left panel) and inter-polated over South Asia (right panel) derive input data for LPJmL, red numbers indicating Julian days, grey lines showing basin boundaries.
during winter and water availability in spring. As the exact date is difficult to determine, we set the first of November as the single sowing date for the rabi crops over the whole study area. Because the rabi crops are generally harvested by the end of March, the irrigation-water demand in the warm pre-monsoon summer months of April and May can almost entirely be attributed to perennial crops. In the analysis of seasonal irrigation demand, we therefore distinguish three seasons: kharif, from June until October; rabi, from Novem-ber until March; and a dry “summer” season from April to May. This dry pre-monsoon summer season is sometimes also called Zaid season.
2.4 Calibration of crop yields
Crop yields in LPJmL are calibrated by varying management intensity, which is represented by three coupled parameters:
maximum leaf area index, maximum harvest index, and a pa-rameter that scales leaf-level biomass production to plot level (Fader et al., 2010). The three parameters are related to crop density, crop varieties and the occurrence of poor soils, pests and diseases, respectively. “Plot level” in this context means the total area of the crop within the grid cell: a plot shares the same climate, soil and land use. “Scale” means that a yield reduction has been applied to translate from biomass pro-duction of individual plants to plot level. Fader et al. (2010) explain this as follows: “The assumption is that intensively managed crop stands (LAImax=7) have little or no areas with reduced productivity due e.g. to poor soil conditions or pests and diseases (α−a=1.0), while such areas are more
common in extensively managed crop stands (LAImax=1;
α−a=0.4)” (for a detailed description of the calibration
Figure 4. Observed vs. simulated (calibrated) crop yields for the most important crops in the different cropping seasons in tons of fresh
matter per hectare (T FM ha−1). Each dot represents one state (India), province (Pakistan) or country (Nepal, Bangladesh). Size of the circle
represents the relative area under that crop (for areas, see Figs. S1–S6).
The value of these management factors affects the esti-mated water demand, because a poorly developed crop with little leaf area will evaporate less and therefore demands less (irrigation) water and vice versa.
The calibration is performed for each crop individually, and management factors are usually determined at the country level in global applications of LPJmL. For this model version, we calibrated crop yields for kharif and rabi separately, as they are differentiated in the agricultural statis-tics. Moreover, we calibrated the management parameters at the sub-national level for India and Pakistan (state and province level, respectively) and at the national level for Nepal and Bangladesh. By calibrating at the sub-national level, existing spatial heterogeneity in management and crop yields between regions could be better represented. We used 5-year average yield statistics, for 2003–2004 till 2007–2008, the most recent period for which consistent records are available from different national agricultural statistics (India: GoI, 2012; Pakistan: http://www.pbs.gov.pk/ content/agricultural-statistics-pakistan-2010-11, last visited 1 July 2014; Bangladesh for the years from 2003–2004 till 2005–2006 form http://www.moa.gov.bd/statistics/statistics. htm#3 and for 2007–2008 in the 2011 yearbook http://www. bbs.gov.bd/PageWebMenuContent.aspx?MenuKey=234; Nepal; GoN, 2012). After calibration, the model is able to simulate the heterogeneity of (mean annual) yields between states and regions (illustrated in Fig. 4). Kharif rice and kharif maize crops show the highest variation between states and provinces. Overall, yields during the kharif season are lower than yields during the rabi season, when a higher
percentage of the area cropped is irrigated, and temperatures are more favourable. Interannual variations in crop yields are shown and discussed by Siderius et al. (2016).
3 Results
3.1 Seasonality in agricultural water demand
Table 1 shows estimates of seasonal net (consumption) and gross (withdrawal from surface and groundwater) irrigation-water demand between the four countries. India and Pakistan have the largest water demand, both in terms of consump-tion and withdrawal. While Pakistan’s net irrigaconsump-tion demand is almost equally divided over the kharif and rabi seasons, India’s demand is skewed towards the rabi season; almost three-quarters of net irrigation demand in India occurs in this dry season (including pre-monsoon summer). This difference between kharif and rabi is less pronounced for gross irriga-tion demand, i.e. water withdrawals, which include applica-tion and conveyance losses. In the rabi season a much higher proportion of the irrigation water is supplied from ground-water (Table 1), which has a higher overall efficiency than surface-water irrigation from canals.
0.0 0.5 1.0 1.5 2.0
Kharif Rabi Rabi Summer
J F M A M J J A S O N D
Net irr
igation w
ater demand (BCM/da
y)
Wheat Rice
Maize Tropical cereals
Pulses Oilcrops
Sugarcane Other crops
Before model improvement
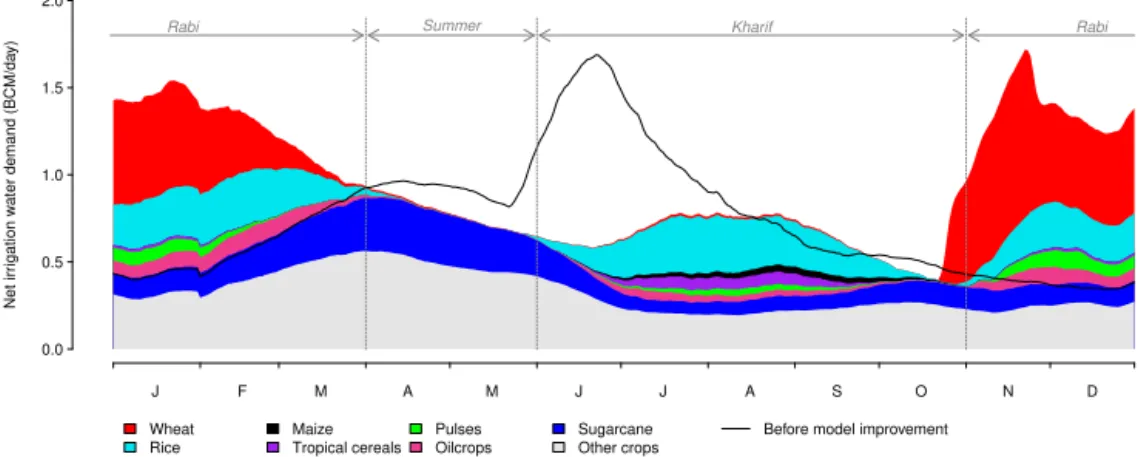
Figure 5.Mean annual cycle of net irrigation requirements for main agricultural crops in South Asia in BCM/day (30-day moving average). For comparison, the mean annual cycle of net irrigation requirements before model improvements (with single cropping season and climate driven sowing dates determination) is added in black.
during the rabi season in all countries, especially in In-dia. In Pakistan, the Indus provides annually approximately 120 BCM yr−1 of utilizable runoff, of which approximately two-thirds is used during the kharif (Randhawa, 2002). Our estimate of mean annual groundwater withdrawal in Pak-istan is at 60 BCM yr−1, of which three-quarters occurs dur-ing the rabi season and pre-monsoon summer. This is some-what higher than previous estimates of groundwater with-drawal, which were in the range of at 47 to 55 BCM yr−1 (Ahmed et al., 2007; Qureshi et al., 2003; Wada et al., 2010) but still lower than the estimated total potential of 68 BCM yr−1 (Randhawa, 2002). For India, the exact
dis-tribution of surface-water and groundwater withdrawal be-tween the kharif and rabi seasons is not well documented. Our model estimate of 217 BCM yr−1of groundwater
with-drawal, mainly occurring during the rabi season, is in agree-ment with earlier groundwater studies with estimates rang-ing from 190 (±37) BCM yr−1 by Wada et al. (2010) to 212.5 BCM yr−1(GoI, 2006).
Overall, our estimates of national total net and gross irrigation-water demand are in line with earlier studies and statistics, but at the lower end of the range for India. Ac-counting for monsoon-dependent planting dates, and thereby a more effective use of rainfall during the main kharif crop-ping season, reduced our estimate of total agricultural water demand compared to earlier regional studies, e.g. with the LPJmL model (Biemans et al., 2013). For Pakistan, our esti-mates are on the high side compared to other studies. Espe-cially for the rabi season, we estimate a high additional de-mand from cash crops like cotton. This dede-mand has to be met largely by groundwater abstractions, because runoff from the Indus and its tributaries is low during these months.
Evaluating the mean annual cycle of irrigation-water de-mand per crop reveals the reason behind seasonal differences in demand (Fig. 5). The single peak in net water demand for wheat during the rabi season stands out, while rice peaks in
both rabi and kharif seasons. The moderating effect of mon-soon rainfall during the kharif season is obvious, with net irrigation-water demand during the kharif season only ac-counting for about 30 % of the annual net irrigation-water demand (Table 1). So while water-use efficiency improve-ments in rice receive much attention, paddy fields being the epitome of excessive water consumption, rice is actually not the most water-demanding crop in the region. Because rice is grown mainly during the kharif season in most states, its water demand is lower than for wheat and sugarcane, which are grown during the dry rabi season. Those crops therefore depend much more on groundwater availability (see also Ta-ble 1 and Fig. 6 for contribution of groundwater irrigation per cropping season). Additionally, sugarcane has an atypical demand in time, caused by its very long cultivation period of about 12 months; it requires large amounts of irrigation wa-ter in the hot dry months of March, April and May, a period when rainfall is scarce and most other fields are left fallow.
The mean annual cycle of irrigation demand as calculated with single cropping and sowing dates determined based on climate (before model improvement) are also shown in Fig. 5.
3.2 Seasonal patterns of water demand for different basins
Figure 6.Gross irrigation-water demand for kharif (June to October) and rabi (November to March) cropping seasons, with selected river basins (Indus, Ganges, Brahmaputra).
J F M A M J J A S O N D
Net irr
igation w
ater demand (bcm/month)
0 2 4 6 8 10 12
J F M A M J J A S O N D
0 2 4 6 8 10 12
Indus
J F M A M J J A S O N D
Net irr
igation w
ater demand (bcm/month)
0 2 4 6 8 10 12 14
J F M A M J J A S O N D
0 2 4 6 8 10 12 14
Ganges
J F M A M J J A S O N D
Net irr
igation w
ater demand (bcm/month)
0.0 0.5 1.0 1.5
J F M A M J J A S O N D
0.0 0.5 1.0 1.5
Brahmaputra
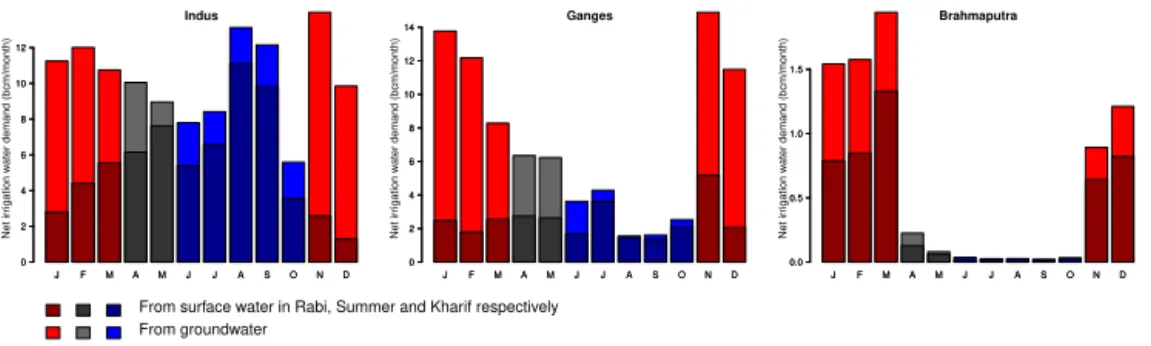
From surface water in Rabi, Summer and Kharif respectively From groundwater
Figure 7.Monthly net irrigation-water demand for three river basins. Colours indicate the different seasons (red – kharif, grey – summer, blue – rabi) and the dark areas the source for supplying the irrigation water (dark – surface water, light – groundwater).
parts of the basin, and no additional irrigation is needed. The same pattern can be seen to be even stronger in the Brahma-putra basin.
3.3 Food production in South Asia during the kharif-and rabi-cropping seasons
Figure 8 shows the total seasonal production of only the five most important food crops (wheat, rice, maize, tropical ce-reals and pulses), both for the region as a whole as for the individual basins. The total area irrigated to grow these food crops is smaller in kharif than rabi (35 Mha vs. 46 Mha total for the four counties), but total (rainfed plus irrigated) area used to grow these food crops is much larger in kharif than rabi (95 Mha vs. 57 Mha). While the percentage of area un-der irrigation, productivity per hectare and sources of water used greatly differ between the kharif and rabi seasons, total regional food-crop production is remarkably similar in the two seasons. A lower cropped area during the rabi season is compensated for by higher yields. Of the total production of food crops in South Asia during the kharif season, ∼50 % is supported by irrigation (Fig. 8). In the rabi season up to ∼95 % of food-crop production is supported by irrigation.
These estimates agree with the recent study of Smilovic et al. (2015), who focus on rice (kharif and rabi) and wheat (rabi) production in India only. They show that during kharif 68 % of rice production is produced on irrigated lands, which is only 56 % of the rice area sown. During rabi this percent-age is much higher: 96 % of the rice was irrigated (on 89 % of the sown area) and 97 % of the wheat production was irri-gated (on 93 % of the sown area) (Smilovic et al., 2015).
We also calculated the potential rainfed yield on those ar-eas currently irrigated. Absence of irrigation would reduce the kharif food-crop production with∼15 % (dark blue bar in Fig. 8), against a reduction of almost 60 % in rabi. This stresses the importance of sufficient irrigation-water supply for achieving food security in this region.
A closer look into the seasonal food production in the dif-ferent river basins shows clear differences. The Indus and the Ganges have a much higher annual production of food crops than the Brahmaputra.
ma-Figure 8.Mean annual seasonal irrigated (blue) and rainfed (green) production of food crops (sum of wheat, rice, maize, tropical cereals and pulses) in South Asia (Nepal, Pakistan, India and Bangladesh) and individual river basins. Light blue corresponds to potential rain-fed production on irrigated land, i.e. dark blue corresponds to the increase in production due to irrigation.
jority of food-crop production takes place during the kharif season.
4 Discussion
The seasonal estimates presented here on food production and related irrigation-water demand in South Asia form a new baseline estimate of South Asian seasonal water demand and food-crop production, as they provide more spatial, tem-poral and crop-specific details than previous estimates.
Incorporating seasonal cropping patterns in more detail leads to improved estimation of the timing of water demand. Figure 5 shows that the simulated timing of water demand is very different compared to a simulation with old settings – thus single cropping season and calculated sowing dates. This difference shows the importance of including multiple cropping in the simulation of irrigation-water demand. Espe-cially in this region with a very strong seasonal variability in both water availability and demand, an improved under-standing of the (changes in) timing of both water availability and demand is essential to understand current and future wa-ter stressed regions. Therefore, the effect of multiple crop-ping on patterns of irrigation-water demand should not be neglected. We show that seasonal water demand is a factor of crop-specific seasonal consumption, availability of rain-fall and different sources of water supply, i.e. groundwater or surface water, and the irrigation efficiencies connected to these sources. Despite these improvements, when modelling such large basins with complex hydrology and high diversity in agricultural and water-management practices, inevitably simplifications and local inaccuracies remain.
Our estimate of the net irrigation requirement (consump-tion) is influenced by the performed calibration and resulting management factors. Generally, regions with high
manage-ment factors will show higher yields and higher transpira-tion, but lower soil evaporation. The effect of the calibration on our estimate of net irrigation requirements was tested by making two model runs: one with all management parame-ters set to the lowest possible value and one with all man-agement parameters set to the highest possible values. This resulted in a net irrigation requirement for South Asia be-tween 307 and 389 km3, a variation of about 10 % compared to the here reported mean annual value of 346 km3.
Our estimate of gross irrigation demand, the water with-drawal, is strongly influenced by the water use efficiency value used, which is determined by a variety of factors like local irrigation practices, scale of analysis and source of wa-ter use. We used the most commonly reported values for the region, similar to other model-based studies in order to be able to compare results. Inclusion of regional, more application- and water-source-specific water use efficiency values in models would improve the estimation of gross wa-ter demand. Such detail is also necessary to gain betwa-ter in-sight into the adaptation potential of different measures like drip irrigation and alternate wetting and drying.
More attention to seasonal cropping patterns and their wa-ter demand opens the scope for further model improvement. Double cropping was evaluated by combining two seasonal model runs, one for kharif and one for rabi. Use of resid-ual soil moisture from one season to the other was not in-corporated in this way, nor could the continued depletion of groundwater be accurately modelled. An integrated double-cropping routine, with proper calibrated crop-specific plant-ing dates and yields, would provide such necessary analysis in a region where groundwater depletion is of serious con-cern.
Next, estimation of planting dates should be further im-proved, using detailed information on local agricultural prac-tices and local water availability. Further, the sowing dates were kept constant during the whole simulation period and was based on average data of monsoon onset, although ac-tual onsets vary year by year. In reality a farmer might de-cide year to year to sow earlier or later, which introduces an uncertainty in our calculations. Ample information is avail-able in the irrigation domain but it will require a form of cooperation between experts at the local to national level and the water resources modelling community. Sharing of input data might reduce costs and time expenditure, will increase its uptake and improve overall quality of water resources as-sessments.
assess-ment of both water demand and crop production, of high rele-vance in today’s world with its volatile food commodity mar-kets.
This paper highlights crop-specific periods of peak water demand that can form critical moments in agricultural pro-duction. Such better understanding of the size of water de-mand during critical moments, the crops that are responsi-ble for this water demand, and its relative importance for food production is essential to guide sustainable develop-ment of climate adaptation measures. This analysis can sup-port the selection of promising options to decrease irrigation-water demand. When combined with information on the (un)availability of surface water and the resulting pressure on groundwater resources (Fig. 7), it improves our understand-ing of the causes of water shortages and groundwater deple-tion. Finally, insight into the yield gap between rainfed and irrigated agriculture in specific regions, and between regions, can help target investments to improve irrigation practices or to increase productivity of rainfed agriculture.
5 Conclusions
Introducing seasonal crop rotation with monsoon-dependent planting dates in a global vegetation–hydrological model leads to better seasonal estimates of irrigation-water demand. Irrigation-water demand between the two main cropping sea-sons differs sharply both in terms of source and magnitude; gross irrigation demand during the rabi season is ∼30 % higher than during the kharif season, the traditional crop-ping season, when monsoon rainfall reduces the amount of supplemental irrigation water needed. Our estimate of total annual water demand is lower than that of previous studies (Biemans et al., 2013), despite the net irrigated area being higher. Overall, gross annual irrigation demand is estimated at 714 BCM yr−1; 247 BCM yr−1during the kharif monsoon season, 361 BCM yr−1during rabi and 106 BCM yr−1during the dry summer months of April and May.
Seasonal estimates of agricultural water demand better highlight crop-specific differences in peak water demand. Such increased temporal detail is needed for properly eval-uating the impact of expected shifts in supply of water as a result of a rapidly changing climate, especially in the Hi-malayan headwaters of some of the main rivers in South Asia. With temperatures rising and total precipitation fairly constant, increased melt from glaciers combined with an early melt of the snow cover is expected to shift the peak in spring runoff to early in the season (Immerzeel et al., 2010; Lutz et al., 2014). Whether this shift will affect critical mo-ments for irrigation or the ecosystem as a whole is to be as-sessed.
Our study has thereby more than regional relevance. Given the size and importance of South Asia, in terms of population and food production, improved regional estimates of produc-tion and its water demand will also affect global estimates.
In models used for global water resources and food-security assessments, processes like multiple cropping and monsoon-dependent planting dates should not be ignored.
The Supplement related to this article is available online at doi:10.5194/hess-20-1971-2016-supplement.
Acknowledgements. This work was carried out by the Himalayan Adaptation, Water and Resilience (HI-AWARE) consortium under the Collaborative Adaptation Research Initiative in Africa and Asia (CARIAA), with financial support from the UK Government’s Department for International Development and the International Development Research Centre, Ottawa, Canada. We acknowledge the Potsdam Institute for Climate Impact Research for their support in using the LPJmL model and computational facilities.
Disclaimer. The views expressed in this work are those of the creators and do not necessarily represent those of the UK Government’s Department for International Development, the International Development Research Centre, Canada or its Board of Governors.
Edited by: C. Stamm
References
Ahmed, A., Iftikhar, H., and Chaudhry, G.: Water resources and conservation strategy of Pakistan, Pakistan Dev. Rev., 997–1009, 2007.
Alcamo, J., Döll, P., Henrichs, T., Kaspar, F., Lehner, B., Rösch, T., and Siebert, S.: Development and testing of the WaterGAP 2 global model of water use and availability, Hydrolog. Sci. J., 48 317–337, 2008.
Arnold, J. G. and Fohrer, N.: SWAT2000: current capabilities and research opportunities in applied watershed modelling, Hydrol. Process., 19, 563–572, 2005.
Bagla, P.: India plans the grandest of canal networks, Science, 345, 128, doi:10.1126/science.345.6193.128, 2014.
Best, M. J., Pryor, M., Clark, D. B., Rooney, G. G., Essery, R. L. H., Ménard, C. B., Edwards, J. M., Hendry, M. A., Porson, A., Gedney, N., Mercado, L. M., Sitch, S., Blyth, E., Boucher, O., Cox, P. M., Grimmond, C. S. B., and Harding, R. J.: The Joint UK Land Environment Simulator (JULES), model description – Part 1: Energy and water fluxes, Geosci. Model Dev., 4, 677–699, doi:10.5194/gmd-4-677-2011, 2011.
Biemans, H.: Water constraints on future food production, Wa-geningen UR, WaWa-geningen, 168 pp., 2012.
Biemans, H., Hutjes, R. W. A., Kabat, P., Strengers, B. J., Gerten, D., and Rost, S.: Effects of precipitation uncertainty on discharge calculations for main river basins, J. Hydrometeorol., 10, 1011– 1025, 2009.
Bondeau, A., Smith, P. C., Zaehle, S., Schaphoff, S., Lucht, W., Cramer, W., and Gerten, D.: Modelling the role of agriculture for the 20th century global terrestrial carbon balance, Global Change Biol., 13, 679–706, 2007.
Bookhagen, B. and Burbank, D. W.: Toward a complete Himalayan hydrological budget: Spatiotemporal distribution of snowmelt and rainfall and their impact on river discharge, J. Geophys. Res., 115, 1–25, 2010.
Elliott, J., Deryng, D., Müller, C., Frieler, K., Konzmann, M., Gerten, D., Glotter, M., Flörke, M., Wada, Y., Best, N., Eisner, S., Fekete, B. M., Folberth, C., Foster, I., Gosling, S. N., Haddeland, I., Khabarov, N., Ludwig, F., Masaki, Y., Olin, S., Rosenzweig, C., Ruane, A. C., Satoh, Y., Schmid, E., Stacke, T., Tang, Q., and Wisser, D.: Constraints and potentials of future irrigation water availability on agricultural production under climate change, P. Natl. Acad. Sci., 111, 3239–3244, 2014.
Fader, M., Rost, S., Müller, C., Bondeau, A., and Gerten, D.: Vir-tual water content of temperate cereals and maize: Present and potential future patterns, J. Hydrol., 384, 218–231, 2010. Falkenmark, M., Rockstrom, J., and Karlberg, L.: Present and future
water requirements for feeding humanity, Food Secur., 1, 59–69, 2009.
Gerten, D., Schaphoff, S., Haberlandt, U., Lucht, W., and Sitch, S.: Terrestrial vegetation and water balance – hydrological evalua-tion of a dynamic global vegetaevalua-tion model, J. Hydrol., 286, 249– 270, 2004.
Gerten, D., Heinke, J., Hoff, H., Biemans, H., Fader, M., and Waha, K.: Global water availability and requirements for future food production, J. Hydrometeorol., 12, 885–899, doi:10.1175/2011jhm1328.1, 2011.
GoI: Dynamic groundwater resources of India (as of March, 2004), Central Ground Water Board, Ministry of Water Resources, Gov-ernment of India, Faridabad, 2006.
GoI: Agricultural Statistics at a glance 2012, Government of India, Ministry of Agriculture, New Delhi, 2012.
GoI: http://eands.dacnet.nic.in/, last access: 22 July 2014, Direc-torate of economics and statistics, Department of Agriculture and Cooperation, Ministery of Agriculture, Government of In-dia, 2014.
GoN: Statistical information on Nepalese Agriculture 2011/2012, Government of Nepal, Ministry of Agriculture, Kathmandu, 2012.
Goswami, B. N., Kulkarni, J. R., Mujumdar, V. R., and Chattopad-hyay, R.: On factors responsible for recent secular trend in the onset phase of monsoon intraseasonal oscillations, Int. J. Clima-tol., 30, 2240–2246, 2010.
Gupta, S. K. and Deshpande, R. D.: Water for India in 2050: first-order assessment of available options, Current Science, 86, 1216–1224, 2004.
Hanasaki, N., Kanae, S., Oki, T., Masuda, K., Motoya, K., Shi-rakawa, N., Shen, Y., and Tanaka, K.: An integrated model for the assessment of global water resources – Part 2: Applica-tions and assessments, Hydrol. Earth Syst. Sci., 12, 1027–1037, doi:10.5194/hess-12-1027-2008, 2008.
Hoogeveen, J., Faurès, J.-M., Peiser, L., Burke, J., and van de Giesen, N.: GlobWat – a global water balance model to assess water use in irrigated agriculture, Hydrol. Earth Syst. Sci., 19, 3829–3844, doi:10.5194/hess-19-3829-2015, 2015.
IMD: http://www.imd.gov.in/doc/wxfaq.pdf, last access:
30 September 2014, Indian Meteorological Department,
Pune, 2015.
Immerzeel, W. W., van Beek, L. P. H., and Bierkens, M. F. P.: Cli-mate Change Will Affect the Asian Water Towers, Science, 328, 1382–1385, 2010.
Immerzeel, W. W., Pellicciotti, F., and Bierkens, M. F. P.: Rising river flows throughout the twenty-first century in two Himalayan glacierized watersheds, Nat. Geosci., 6, 742–745, 2013. Joseph, P. V. and Sabin, T. P.: An ocean–atmosphere interaction
mechanism for the active break cycle of the Asian summer mon-soon, Clim. Dynam., 30, 553–566, 2008.
Joseph, P. V., Eischeid, J. K., and Pyle, R. J.: Interannual variability of the onset of the Indian summer monsoon and its association with atmospheric features, El Nino, and sea surface temperature anomalies, J. Climate, 7, 81–105, 1994.
Kajikawa, Y., Yasunari, T., Yoshida, S., and Fujinami, H.: Advanced Asian summer monsoon onset in recent decades, Geophys. Res. Lett., 39, L03803, doi:10.1029/2011GL050540, 2012.
Krishna Kumar, K., Rupa Kumar, K., Ashrit, R. G., Deshpande, N. R., and Hansen, J. W.: Climate impacts on Indian agriculture, Int. J. Climatol., 24, 1375–1393, 2004.
Kummu, M., Gerten, D., Heinke, J., Konzmann, M., and Varis, O.: Climate-driven interannual variability of water scarcity in food production potential: a global analysis, Hydrol. Earth Syst. Sci., 18, 447–461, doi:10.5194/hess-18-447-2014, 2014.
Liang, X., Lettenmaier, D. P., Wood, E. F., and Burges, S. J.: A Simple hydrologically Based Model of Land Surface Water and Energy Fluxes for GSMs, J. Geophys. Res., 99, 415–428, 1994. Lutz, A., Immerzeel, W., Shrestha, A., and Bierkens, M.:
Con-sistent increase in High Asia’s runoff due to increasing glacier melt and precipitation, Nat. Clim. Change, 4, 587–592, doi:10.1038/nclimate2237, 2014.
Mall, R., Singh, R., Gupta, A., Srinivasan, G., and Rathore, L.: Im-pact of Climate Change on Indian Agriculture: A Review, Cli-matic Change, 78, 445–478, 2006.
Mathison, C., Wiltshire, A. J., Falloon, P., and Challinor, A. J.: South Asia river-flow projections and their implications for water resources, Hydrol. Earth Syst. Sci., 19, 4783–4810, doi:10.5194/hess-19-4783-2015, 2015.
Monfreda, C., Ramankutty, N., and Foley, J. A.: Farming the planet: 2. Geographic distribution of crop areas, yields, physiological types, and net primary production in the year 2000, Global Bio-geochem. Cy., 22, GB1022, doi:10.1029/2007GB002947, 2008. Moors, E. J., Groot, A., Biemans, H., van Scheltinga, C. T., Siderius, C., Stoffel, M., Huggel, C., Wiltshire, A., Mathison, C., Ridley, J., Jacob, D., Kumar, P., Bhadwal, S., Gosain, A., and Collins, D. N.: Adaptation to changing water resources in the Ganges basin, northern India, Environ. Sci. Policy, 14, 758–769, 2011. Portmann, F. T., Siebert, S., and Döll, P.: MIRCA2000 –
Global monthly irrigated and rainfed crop areas around the year 2000: A new high-resolution data set for agricultural and hydrological modeling, Global Biogeochem. Cy., 24, Gb1011, doi:10.1029/2008gb003435, 2010.
Qureshi, A. S., Shah, T., and Akhtar, M.: The groundwater economy of Pakistan, Working Paper 64, International Water Management Institute, Lahore, Pakistan, 31 pp., 2003.
lands in the year 2000, Global Biogeochem. Cy., 22, GB1003, doi:10.1029/2007gb002952, 2008.
Randhawa, H. A.: Water development for irrigated agriculture in Pakistan: Past trends, returns and future requirements, Food and Agricultural Organization (FAO), FAO Corporate Document Repository, available at: www.fao.org/DOCREP/005/AC623E/ ac623e0i.htm (last access: 5 July 2014), 2002.
Rees, H. G. and Collins, D. N.: Regional differences in response of flow in glacier-fed Himalayan rivers to climatic warming, Hy-drol. Process., 20, 2157–2169, 2006.
Ren, R. and Hu, J.: An emerging precursor signal in the stratosphere in recent decades for the Indian summer monsoon onset, Geo-phys. Res. Lett., 41, 7391–7396 doi:10.1002/2014GL061633, 2014.
Rodell, M., Velicogna, I., and Famiglietti, J. S.: Satellite-based esti-mates of groundwater depletion in India, Nature, 460, 999–1002, 2009.
Rohwer, J., Gerten, D., and Lucht, W.: Development of Functional Irrigation Types for Improved Global Crop Modelling, No. 104, Potsdam Institute for Climate Impact Research, Postdam, 98 pp., 2007.
Rosegrant, M. W. and Cai, X.: Global Water Demand and Supply Projections, Water Int., 27, 170–182, 2002.
Rost, S., Gerten, D., Bondeau, A., Lucht, W., Rohwer, J., and Schaphoff, S.: Agricultural green and blue water consumption and its influence on the global water system, Water Resour. Res., 44, W09405, doi:10.1029/2007WR006331, 2008.
Rost, S., Gerten, D., Hoff, H., Lucht, W., Falkenmark, M., and Rockström, J.: Global potential to increase crop production through water management in rainfed agriculture, Environ. Res. Lett., 4, 044002, doi:10.1088/1748-9326/4/4/044002, 2009. Siderius, C., Biemans, H., Walsum, P. E. V. V., Ierland, E. V., Kabat,
P., and Hellegers, P.: Snowmelt contributions to discharge of the Ganges, Sci. Total Environ., 468–469, S93–S101, 2013a. Siderius, C., Hellegers, P. J. G. J., Mishra, A., van Ierland, E. C.,
and Kabat, P.: Sensitivity of the agroecosystem in the Ganges basin to inter-annual rainfall variability and associated changes in land use, Int. J. Climatol., 34, 3066–3077, doi:10.1002/joc.3894, 2013b.
Siderius, C., Biemans, H., van Walsum, P. E., van Ierland, E. C., Kabat, P., and Hellegers, P. J.: Flexible Strategies for Coping with Rainfall Variability: Seasonal Adjustments in Cropped Area in the Ganges Basin, Plos One, 11, e0149397, doi:10.1371/journal.pone.0149397, 2016.
Siebert, S. and Döll, P.: Quantifying blue and green virtual wa-ter contents in global crop production as well as potential pro-duction losses without irrigation, J. Hydrol., 384, 198–217, doi:10.1016/j.jhydrol.2009.07.031, 2010.
Siebert, S., Döll, P., Feick, S., Hoogeveen, J., and Frenken, K.: Global map of irrigation areas version 4.0.1, Johann Wolfgang Goethe University, Frankfurt am Main, Germany/Food and Agri-culture Organization of the United Nations, Rome, Italy, 2007. Siebert, S., Burke, J., Faures, J. M., Frenken, K., Hoogeveen, J.,
Döll, P., and Portmann, F. T.: Groundwater use for irrigation – a global inventory, Hydrol. Earth Syst. Sci., 14, 1863–1880, doi:10.5194/hess-14-1863-2010, 2010.
Sitch, S., Smith, B., Prentice, I. C., Arneth, A., Bondeau, A., Cramer, W., Kaplan, J. O., Levis, S., Lucht, W., Sykes, M. T., Thonicke, K., and Venevsky, S.: Evaluation of ecosystem dy-namics, plant geography and terrestrial carbon cycling in the LPJ dynamic global vegetation model, Global Change Biol„ 9, 161– 185, 2003.
Smilovic, M., Gleeson, T., and Siebert, S.: The limits of increasing food production with irrigation in India, Food Secur., 7, 835–856, 2015.
Statistics: P.B.o., http://www.pbs.gov.pk/content/
agriculture-statistics-pakistan-2010-11, last access:
22 July 2014.
Tiwari, V. M., Wahr, J., and Swenson, S.: Dwindling groundwater resources in northern India, from satellite gravity observations, Geophys. Res. Lett., 36, L18401, doi:10.1029/2009GL039401, 2009.
Wada, Y., van Beek, L. P. H., van Kempen, C. M., Reckman, J. W. T. M., Vasak, S., and Bierkens, M. F. P.: Global deple-tion of groundwater resources, Geophys. Res. Lett., 37, L20402, doi:10.1029/2010GL044571, 2010.
Wada, Y., Van Beek, L. P. H., Viviroli, D., Dürr, H. H., Weingartner, R., and Bierkens, M. F. P.: Global monthly water stress: 2. Wa-ter demand and severity of waWa-ter stress, WaWa-ter Resour. Res., 47, doi:10.1029/2010WR009792, 2011.
Waha, K., van Bussel, L. G. J., Muller, C., and Bondeau, A.: Climate-driven simulation of global crop sowing dates, Global Ecol. Biogeogr., 21, 247–259, doi:10.1111/j.1466-8238.2011.00678.x, 2012.