Authors
Amanda de Faria Barros1 Cristiane Moraes1 Milena Barcza Stockler Pinto2
Julie Calixto Lobo1 Denise Mafra1
1 Graduate Program on Cardiovascular Sciences, Fluminense Federal University (UFF), Niterói, Brazil. 2 Carlos Chagas Filho Biophysics Institute, Center for Health and Science, Federal University of Rio de Janeiro (UFRJ), Rio de Janeiro-RJ, Brazil.
Submitted on: 05/10/2012. Approved on: 04/13/2013.
Correspondence to:
Amanda Barros.
Rua da Inspiração, nº 297/101, Rio de Janeiro, RJ, Brazil. CEP: 21221-330.
E-mail: [email protected]
I
NTRODUCTIONPatients with chronic kidney disease (CKD) experience persisting inflamma-tion and a series of ensuing complicainflamma-tions. Cytokines such as interleukin-6 (IL-6) and tumor necrosis factors (TNF-α) act direc-tly upon the central nervous system to introduce alterations in neurotransmitter release and function, leading to disorde-red appetite and dysfunctional energy metabolism1-5 and the onset of wasting
syndrome, consisting of anorexia, incre-ased energy expenditure, reduction of protein stocks, and loss of fat and muscle tissue. Each individual component in this syndrome adds to the risk of death of pa-tients with CKD.6 Inflammatory processes
in CKD patients seem to be related to ano-rexia, which by its turn is a direct contri-butor to higher hospitalization rates, lo-wer quality of life, and higher death rates in hemodialysis (HD) patients.7 Indeed,
Zabel et al.8 found a positive correlation
between appetite reductions and inflam-matory markers in HD patients. Other authors have also verified correlations between high levels of pro-inflammatory cytokines and some appetite-regulating hormones.9-11
One of the many hormones studied in CKD is ghrelin, a peptide with 28 amino acids secreted by the stomach which, when released, stimulates the appetite through the central nervous system (CNS) and le-ads to weight and body fat gain.12 Two
forms of ghrelin are found in bodily tis-sues and fluids: acyl-ghrelin, the peptide’s active form, and des-acyl-ghrelin, which accounts for 80%-90% of the circulating
Is there association between acyl-ghrelin and inflammation
in hemodialysis patients?
Introduction and Objectives: Patients with chronic kidney disease (CKD) pre-sent anorexia, which may be related with the chronic inflammatory pro-cess. Thus the objective of this study was to evaluate if there is association between inflammation and the orexige-nic hormone, acyl-ghrelin, in CKD pa-tients undergoing hemodialysis (HD). Methods: Thirty-six patients were stu-died (61.1% men, 46.7 ± 14.9 years, BMI 22.9 ± 3.9 kg/m2) in regular HD
program (65.0 ± 46.8 months). Plasma levels of acyl-ghrelin and inflammatory markers TNF-α, IL-6 and CRP were measured by enzyme immunoassay (ELI-SA, Enzyme Linked Immunosorbent As-say). Anthropometric parameters were collected for assessment of nutritional status and dietary intake was assessed by food recall. Results: The patients presented elevated plasma levels of IL-6 (83 ± 10 pg/mL), TNF-α (21.06 pg/mL [20.6-40.0]) and CRP (2.7 pg/mL [1.7-3.4]) compared to normal values. Acyl--ghrelin plasma levels were (18.0 [1.3 to 77.7 pg/mL]) low when compared to healthy individuals. However, patients with high BMI (> 25 kg/m2) presented
lower acyl-ghrelin plasma levels (13.6 [1.3 to 30.5] pg/mL) when compared to patients with BMI < 25 kg/m2 (21.7
[7.4 to 77.7] pg/mL) (p < 0.05). Acyl--ghrelin and BMI were negatively cor-related (r = -0.38, p = 0.02) and there was no significant correlation between acyl-ghrelin and inflammatory markers.
Conclusions: Hemodialysis patients
showed low acyl-ghrelin levels and seem to present an acyl-ghrelin resistance and there was no correlation between inflam-mation and this orexigenic hormone.
A
BSTRACTKeywords: dialysis; ghrelin; inflammation; renal insufficiency, chronic.
ghrelin. Des-acyl-ghrelin appears to act as an anore-xigen and its levels are significantly increased in CKD patients as a consequence of poor renal clearance.13,14
Higher ghrelin levels may represent an attempt to increase the appetite and the anabolic activity of the growth hormone. However, in CKD patients the hor-monal axis may be negatively regulated because of inflammation and uremia.15
Administration of ghrelin to rats with CKD im-proved food intake, muscle mass, and reduced mus-cle protein degradation and levels of inflammatory cytokines.16 In fact, ghrelin seems to be a potent
anti-inflammatory agent in the immune system and in human endothelial cells, where it probably inhibits the expression of inflammatory cytokines IL-1β, IL-6, and TNF-α.17
Nonetheless, recent studies have indicated that the levels of total ghrelin and acyl-ghrelin are alte-red in inflammatory conditions.9-11 Total ghrelin and
acyl-ghrelin levels seem to be negatively correlated to inflammatory cytokines in patients with chronic kidney disease undergoing hemodialysis, particularly TNF-α and IL-6.11
Conflicting results have been published about this association. Therefore, this study aimed to analyze the correlation between acyl-ghrelin and inflammatory cytokines (IL-6, TNF-α, and CRP) in CKD patients undergoing hemodialysis.
M
ATERIALS ANDM
ETHODSTHESERIES
This cross-sectional study included 36 patients (61.2% males) with CKD from the Renalvida Clinic (Rio de Janeiro, Brazil). The study enrolled patients meeting the following criteria: men and women aged between 18 and 65 years on hemodialysis for over three months with arteriovenous fistulas as the ac-cess method. Patients with inflammatory, acute or malignant disease were excluded. The mean duration of HD sessions was of approximately three to four and a half hours. Subjects underwent HD three times a week, with blood flow rates above 250 mL/min, dialysate flow rates of 500 mL/min, and bicarbona-te buffer. The main causes for CKD were hyperbicarbona-ten- hyperten-sive nephrosclerosis (N = 24), followed by chronic glomerulonephritis (N = 6), diabetic nephrosclero-sis (N = 2), polycystic kidney disease (N = 1) and other diseases or unknown causes (N = 3). This
study was approved by the Ethics Committee of the medical School of the Fluminense Federal University (073/10). All patients gave informed consent for their participation in the study.
NUTRITIONALASSESSMENT
The following anthropometric parameters were measured: circumference of the arm and waist, dry weight, and height for the calculation of the BMI. Tricipital, subscapular, suprailiac, and biceps skin fold measurements were made to calculate body fat percentages and body density by the summation of the four skin folds, according to the procedure described by Durnin & Womersley,18 and body fat
percentages as per Siri’s19 equation. Measurements
were made after hemodialysis sessions by a trained professional.
Nutritional status was assessed based on the BMI (kg/m2), calculated by the ratio between dry
weight and height to the square and categorized in accordance with the recommendations of the World Health Organization.20 The cutoff points proposed
by Lohman et al.21 were used as reference values for
body fat percentages.
Corrected arm muscle area (CAMA) was used to improve the assessment of muscle tissue reser-ves, due to the correction for bone area. CAMA-based nutritional classification was carried out as per the procedures and reference values publi-shed by Frisancho.22 Waist circumference
measure-ments were made to analyze the profile of body fat distribution of the patients. Measured values were compared to borderline values associated with risk of complications related to obesity. Increased risk was seen when waist circumference was greater than 102 cm for males and 88 cm for females.23
Mean daily caloric and protein intake was estimated using 24-hour recall two-day food records (one day on hemodialysis and another off). Mean dai-ly nutrient intake was calculated using the NutWin software package (developed by the Nutrition Department of the Federal University of São Paulo - UNIFESP, São Paulo, Brazil).
BIOCHEMICALVARIABLES
Foundation (NKF, 2000).24 Dialysis dosage (Kt/V)
was calculated from blood urea values before and after dialysis, weight, and duration of hemodialy-sis as described by Daugirdas.25 Fast blood samples
were taken before hemodialysis sessions. Samples we-re centrifuged (15 min, 3000 x g, 4°C) and plasma was stored at -80°C for future analysis. Plasma levels of acyl-ghrelin were analyzed using a commercially available kit (Human acylated Ghrelin EIA - SPI Bio, Montigny, France) and the values were compared to acyl-ghrelin levels of 18 healthy individuals (51 ± 6.6 years; seven males, 11 females). Pro-inflammatory cytokines were analyzed through immunoenzyme assays (human C-reactive protein, DY1707, R&D Systems®; human TNF-α/TNFSF1A, DY210, R&D
Systems®; human IL-6, DY206, R&D Systems®) and
values compared to those of a group of healthy indi-viduals included in a study developed by our group.26
STATISTICALANALYSIS
Results were expressed in the form of mean values ± SD (standard deviation) or minimum and maximum va-lues as per the Shapiro-Wilk test of normality. Plasma acyl-ghrelin, TNF-α and CRP did not present normal distributions. The Mann-Whitney test was applied to analyze the differences between mean values. The t-test for independent samples was applied to analyze the differences between the mean values of the variables that followed a normal distribution. Variables were analyzed for gender and BMI (cutoff point set at 25.0 kg/m2). The correlation coefficients between the
varia-bles were calculated using Pearson’s or Spearman’s co-efficient as needed. Statistical significance was assigned for events with p < 0.05. Statistical analysis was carried out using software package SPSS (Statistical Package for the Social Sciences) 17.0 (Chicago, EUA).
R
ESULTSTable 1 shows anthropometric and biochemical pa-rameters. Fourteen percent of the patients had BMIs consistent with malnutrition (< 18.5 kg/m2) and
44.4% were overweight or obese (BMI > 25 kg/m2).
All patients had high percentages of body fat and about 20% of the male and 43% of the female indi-viduals had waist circumference measurements abo-ve NCEP (2001)23 recommendations. Contrastingly,
66.7% of the patients had nutrient depletion based on the corrected arm muscle area measurement.
Most individuals (70%) had caloric intakes under 35 kcal/kg/day, and only 30% had proper levels of energy intake. Mean protein intake was 1.4 ± 0.9 g/ kg/day, but half of the patients had less than 1.2 g/kg/ day of proteins.
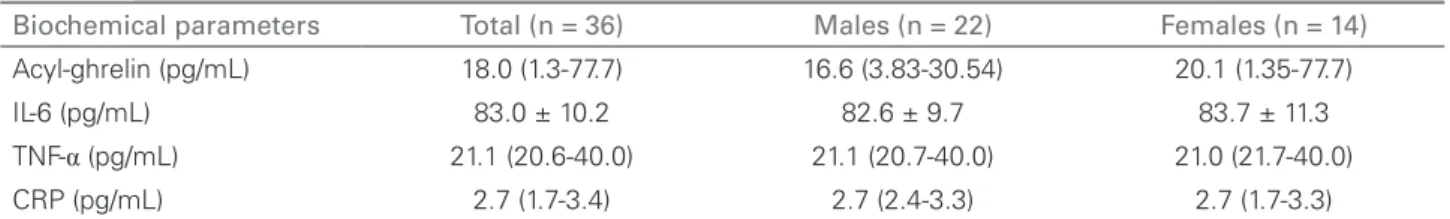
The biochemical data presented in Table 2 indi-cates that patients had high plasma concentrations of IL-6 (83.0 ± 10.2 pg/mL), TNF-α (21.06 [20.6-40.0] pg/mL) and CRP (2.7 [1.7-3.4] pg/mL), when com-pared to healthy subjects - IL-6 (2.7 ± 0.3 pg/mL), TNF-α (2.3 ± 1.2 pg/mL), CRP (0.59 ± 0.07 pg/mL).26
Patients had lower acyl-ghrelin concentrations (18.0 [1.3-77.7] pg/mL) than healthy subjects (24.2 [16.3-41.7] pg/mL) (p < 0.001).
Plasma concentrations of acyl-ghrelin were ne-gatively correlated with BMI (r = -0.38; p = 0.02), as seen in Figure 1. Overweight/obese patients had significantly lower levels of acyl-ghrelin (13.6 [1.3-30.5 pg/mL]) against individuals with a BMI under 25 kg/m2 (21.7 [7.4-77.7] pg/mL), as indicated in
Figure 2.
Among female subjects, body fat was negative-ly correlated with acyl-ghrelin (r = -0.53; p = 0.03) (Figure 3). There was no significant correlation be-tween age, nutritional status, and pro-inflammatory cytokines, or between acyl-ghrelin concentrations and cytokines (TNF-α, IL-6, CRP).
TABLE 1 MEANVALUESANDSTANDARDDEVIATIONS
FORANTHROPOMETRICANDBIOCHEMICAL PARAMETERS
Parameter Total
(n = 36)
Males (n = 22)
Females (n = 14)
Age (years) 46.0 ± 15.2 44.0 ± 12.6 49.4 ± 18.8
Time on HD
(months) 65.0 ± 46.8 60.0 ± 49.2 72.8 ± 42.5
Kt/V 1.5 ± 0.4 1.4 ± 0.3 1.7 ± 0.3
BMI (kg/m2) 22.9 ± 3.9 23.2 ± 4.1 22.3 ± 3.7
CAMA (cm2) 29.5 ± 12.9 30.2 ± 14.3 25.9 ± 13.3
Fat % 30.4 ± 6.8 27.4 ± 5.9* 35.2 ± 5.1
FFM (kg) 43.1 ± 9.6 48.1 ± 8.6* 35.2 ± 4.7
WC (cm) 81.5 ± 12.1 83.3 ± 11.2 78.6 ± 13.4
Albumin (g/dL) 3.6 ± 0.2 3.6 ± 0.3 3.6 ± 0.2
Hematocrit (%) 32.7 ± 4.8 32.7 ± 4.8 32.8 ± 4.9
Hemoglobin (g/dL) 10.8 ± 1.6 10.8 ± 1.7 10.9 ± 1.7
D
ISCUSSIONAltered levels of ghrelin, one of the peptides that affect appetite and nutritional status, have been des-cribed in patients with CKD.27,28 In this study, patients
on hemodialysis had lower levels of acyl-ghrelin than healthy subjects; additionally, patients with BMIs > 25 kg/m2 had significantly lower plasma
concentra-tions of acyl-ghrelin than individuals with BMIs < 25 kg/m2. No correlations were observed between
inflammatory markers and acyl-ghrelin levels.
High levels of total ghrelin have been described in CKD patients.13,27,29,30 However, a great deal of
the-se studies reported on plasma concentrations of total ghrelin, while this study looked into acyl-ghrelin, an orexigen, unlike des-acyl-ghrelin, an anorexigen that makes up for 90% of the total circulating ghrelin.
Authors have also described low levels of acyl-ghrelin in CKD patients. Oner-Iyidogan et al.11 assessed 36
hemodialysis patients and found low plasma con-centrations of acyl-ghrelin. Mafra et al.12 also found
low plasma levels of acyl-ghrelin in 125 patients on hemodialysis. According to these authors, patients with CKD have reduced plasma concentrations of acyl-ghrelin and high levels of des-acyl-ghrelin, being the high values of total ghrelin explained by the des-acyl component. In fact, Muscaritoli et al.9 found
significantly higher levels of des-acyl-ghrelin in hemo-dialysis patients than in healthy subjects.
This study revealed a negative correlation between BMI and plasma levels of acyl-ghrelin; in women, a strong negative correlation was found between acyl-ghrelin and body percent fat. These findings agree with Mafra et al.,12 according to whom
acyl-ghrelin levels were higher in patients with a BMI < 23 kg/m2. Likewise, when total ghrelin was
considered, some authors have found an inverse re-lation between total ghrelin and BMI, and CKD patients with cachexia and high levels of total ghre-lin. In view of these findings, this profile has been suggested as a mechanism to maintain energy ba-lance, avoiding weight loss in patients31,32 in whom
TABLE 2 PLASMACONCENTRATIONSOFACYL-GHRELINANDCYTOKINESINHEMODIALYSISPATIENTS
Biochemical parameters Total (n = 36) Males (n = 22) Females (n = 14)
Acyl-ghrelin (pg/mL) 18.0 (1.3-77.7) 16.6 (3.83-30.54) 20.1 (1.35-77.7)
IL-6 (pg/mL) 83.0 ± 10.2 82.6 ± 9.7 83.7 ± 11.3
TNF-α (pg/mL) 21.1 (20.6-40.0) 21.1 (20.7-40.0) 21.0 (21.7-40.0)
CRP (pg/mL) 2.7 (1.7-3.4) 2.7 (2.4-3.3) 2.7 (1.7-3.3)
IL-6: Interleukin-6; TNF: Tumor necrosis factor; CRP: C-reactive protein.
Figure 1. Correlation between plasma concentrations of acyl-ghrelin and BMI.
Figure 2.Box-plot of plasma concentrations of acyl-ghrelin according to BMI.
acyl-ghrelin is responsible for the orexigen effects of total ghrelin.33-35 Additionally, a recent study carried
out in humans found that the expression of activating enzyme ghrelin O-acyltransferase (GOAT) is altered by different body weight conditions, thus neutrali-zing ghrelin’s adaptive alterations observed in these conditions and contributing to the development or maintenance of anorexia or obesity.36
In fact, some authors have shown an inverse re-lation between BMI, body fat, and acyl-ghrelin le-vels.34 According to Chen et al.,35 reductions in body
weight increase ghrelin concentrations, while incre-ases in body weight reduce ghrelin concentrations. Thin patients appear to be have some form of ghre-lin resistance, for which reason they have a tendency to develop anorexia. This fact is consistent with our findings. Although 70% of the individuals had food intake levels lower than recommended levels, sub-jects with a BMI under 25 kg/m2 had higher plasma
concentrations of acyl-ghrelin than obese patients. Lower levels of acyl-ghrelin may be correlated with inflammation in patients with high levels of cytokines. However, no significant correlations were seen between inflammation, energy-protein intake, and acyl-ghrelin levels in this study.
Pro-inflammatory cytokines lead to protein ca-tabolism and muscle mass reduction.6 In this
stu-dy, a large portion of the patients had muscle de-pletion, despite the lack of significant correlations between pro-inflammatory cytokines and mus-cle tissue. According to Carrero & Stenvinkel,37
pro-inflammatory cytokines, particularly IL-6, play an important role in muscle catabolism and con-tribute to the onset of wasting, a condition seen in 23% to 76% of patients on hemodialysis characte-rized by caloric-protein depletion. This nutritional status deterioration is characterized by anorexia, high energy expenditure, low protein serum levels, loss of weight and muscle tissue.6,38,39
Fat is known to be an endocrine tissue that produ-ces and secretes various pro-inflammatory cytokines; one of them is IL-6, a key component in inflammatory processes. Apparently, high plasma concentrations of IL-6 are strongly correlated with the BMI in obese pa-tients.40 Additionally, according to Mafra et al.,41
obe-sity may be a factor in subclinical inflammation, in which increases in fat tissue lead to increases in pro--inflammatory cytokines such as IL-6. Although the
patients in this study had high body fat percentages, no correlation was established between this finding and inflammatory cytokines.
There is conflicting information on the cor-relation between total ghrelin, acyl-ghrelin, and inflammatory markers. Studies have provided evidences showing that total ghrelin may have anti--inflammatory effects by reducing the expression of pro-inflammatory cytokines.17,28 According to Yada
et al.,42 acyl-ghrelin appears to regulate the
prolife-ration of immune cells, the activation and secretion of pro-inflammatory cytokines, thus inhibiting the expression of pro-inflammatory cytokines such as TNF-α and IL-6.43
In sum, the plasma concentrations of acyl-ghrelin of patients on hemodialysis were found to be lower than in healthy subjects; these concentrations were negatively correlated with BMI and body fat per-centage, thus establishing the clear impact of nu-tritional status on acyl-ghrelin levels. Additionally, the presence of inflammation was evident in view of the levels of pro-inflammatory cytokines mentio-ned above, despite the absence of correlations with acyl-ghrelin levels.
Considering the important properties of ghre-lin and its derivatives in CKD and the many con-tradictory results published in the literature, more studies are required to clarify the correlation between acyl-ghrelin and inflammation in patients with chronic kidney disease.
A
CKNOWLEDGMENTSThe authors would like to thank CAPES, CNPq, and FAPERJ.
R
EFERENCES1. Kalantar-Zadeh K, Mehrotra R, Fouque D, Kopple JD. Me-tabolic acidosis and malnutrition-inflammation complex syn-drome in chronic renal failure. Semin Dial 2004;17:455-65. http://dx.doi.org/10.1111/j.0894-0959.2004.17606.x PMid:15660576
2. Kaysen GA. Inflammation: cause of vascular disease and mal-nutrition in dialysis patients. Semin Nephrol 2004;24:431-6. http://dx.doi.org/10.1016/j.semnephrol.2004.06.009 PMid:15490405
3. Kalantar-Zadeh K. Causes and consequences of the reverse epi-demiology of body mass index in dialysis patients. J Ren Nutr 2005;15:142-7. http://dx.doi.org/10.1053/j.jrn.2004.09.020 PMid:15648024
5. Dummer CD, Thomé FS, Veronese FV. Doença renal crôni-ca, inflamação e aterosclerose: novos conceitos de um velho problema. Rev Assoc Bras 2007;53:446-50. http://dx.doi. org/10.1590/S0104-42302007000500022
6. Mak RH, Ikizler AT, Kovesdy CP, Raj DS, Stenvinkel P, Kalantar-Zadeh K. Wasting in chronic kidney disease. J Cache-xia Sarcopenia Muscle 2011;2:9-25. http://dx.doi.org/10.1007/ s13539-011-0026-6 PMCid:3063874
7. Carrero JJ. Mechanisms of altered regulation of food intake in chronic kidney disease. J Ren Nutr 2011;21:7-11. http://dx.doi. org/10.1053/j.jrn.2010.10.004 PMid:21195909
8. Zabel R, Ash S, King N, Bauer J. The relationship between subjective appetite sensations, markers of inflammation and appetite in dialysis patients. J Hum Nutr Diet 2009;22:343-50. http://dx.doi.org/10.1111/j.1365-277X.2009.00968.x PMid:19624402
9. Muscaritoli M, Molfino A, Chiappini MG, Laviano A, Ammann T, Spinsanti P, et al. Anorexia in hemodialysis patients: the possible role of des-acyl ghrelin. Am J Nephrol 2007;27:360-5. http://dx.doi.org/10.1159/000103798 PMid:17556836 10. Mafra D, Guebre-Egziabher F, Fouque D. Endocrine role of
stomach in appetite regulation in chronic kidney disease: about ghrelin and obestatin. J Ren Nutr 2010;20:68-73. http://dx.doi. org/10.1053/j.jrn.2009.08.002 PMid:19913441
11. Oner-Iyidogan Y, Gurdol F, Kocak H, Oner P, Cetinalp-Demircan P, Caliskan Y, et al. Appetite-regulating hormones in chronic kidney disease patients. J Ren Nutr 2011;21:316-21. http:// dx.doi.org/10.1053/j.jrn.2010.07.005 PMid:21193324 12. Mafra D, Guebre-Egziabher F, Cleaud C, Arkouche W,
Mialon A, Drai J, et al. Obestatin and ghrelin interplay in he-modialysis patients. Nutrition 2010;26:1100-4. http://dx.doi. org/10.1016/j.nut.2009.09.003 PMid:20018486
13. Yoshimoto A, Mori K, Sugawara A, Mukoyama M, Yahata K, Suganami T, et al. Plasma ghrelin and desacyl ghrelin concen-trations in renal failure. J Am Soc Nephrol 2002;13:2748-52. http://dx.doi.org/10.1097/01.ASN.0000032420.12455.74 PMid:12397045
14. Aygen B, Dogukan A, Dursun FE, Aydin S, Kilic N, Sa-hpaz F, et al. Ghrelin and obestatin levels in end-stage re-nal disease. J Int Med Res 2009;37:757-65. http://dx.doi. org/10.1177/147323000903700319 PMid:19589259 15. Slee AD. Exploring metabolic dysfunction in chronic
kid-ney disease. Nutr Metab (Lond) 2012;9:36. http://dx.doi. org/10.1186/1743-7075-9-36 PMid:22537670 PMCid:3407016 16. Deboer MD, Zhu X, Levasseur PR, Inui A, Hu Z, Han G,
et al. Ghrelin treatment of chronic kidney disease: improve-ments in lean body mass and cytokine profile. Endocrinology 2008;149:827-35. http://dx.doi.org/10.1210/en.2007-1046 PMid:18039782 PMCid:2219314
17. Tesauro M, Schinzari F, Caramanti M, Lauro R, Cardillo C. Metabolic and cardiovascular effects of ghrelin. Int J Pept 2010;2010 pii:864342.
18. Durnin JV, Womersley J. Body fat assessed from total body density and its estimation from skinfold thickness: measure-ments on 481 men and women aged from 16 to 72 years. Br J Nutr 1974;32:77-7. http://dx.doi.org/10.1079/BJN19740060 PMid:4843734
19. Siri WE. Body composition from fluid spaces and density analy-sis of methods. In: Brozek J, Henschel A (eds.): Techniques for measuring body composition. Washington: National Research Council; 1961. p.223-44.
20. Obesity: preventing and managing the global epidemic. Report of a WHO consultation. World Health Organ Tech Rep Ser 2000;894: 1-253.
21. Lohman TG, Roche AF, Martorell R, editors. Anthropometric standardization reference manual: Abridged edition. Cham-paign: Human Kinetics Books; 1991.
22. Frisancho AR. New norms of upper limb fat and muscle areas for assessment of nutritional status. Am J Clin Nutr 1981;34:2540-5. PMid:6975564
23. Executive Summary of The Third Report of The National Cho-lesterol Education Program (NCEP) Expert Panel on Detec-tion, EvaluaDetec-tion, And Treatment of High Blood Cholesterol In Adults (Adult Treatment Panel III). JAMA 2001;285:2486-7. http://dx.doi.org/10.1001/jama.285.19.2486 PMid:11368702 24. K/DOQI clinical practice guidelines for chronic kidney
di-sease: evaluation, classification, and stratification. Am J Kid-ney Dis 2002;39:S1-266. http://dx.doi.org/10.1016/S0272-6386(02)70054-1
25. Daugirdas JT. Second generation logarithmic estimates of sin-gle-pool variable volume Kt/V: an analysis of error. J Am Soc Nephrol 1993;4:1205-13. PMid:8305648
26. Saldanha JF, Carrero JJ, Mafra D. The possible role of nesfatin-1 on appetite regulation in hemodialysis patients. Med Hypotheses 2011;77:654-7. http://dx.doi.org/10.1016/j.mehy.2011.07.006 PMid:21840647
27. Rodriguez Ayala E, Pecoits-Filho R, Heimbürger O, Lindholm B, Nordfors L, Stenvinkel P. Associations between plasma ghrelin levels and body composition in end-stage renal disease: a longi-tudinal study. Nephrol Dial Transplant 2004;19:421-6. http:// dx.doi.org/10.1093/ndt/gfg559 PMid:14736968
28. Mafra D, Farage NE, Lobo JC, Stockler-Pinto MB, Leal VO, Carvalho DP, et al. Relationship between total ghrelin and inflam-mation in hemodialysis patients. Peptides 2011;32:358-61. http:// dx.doi.org/10.1016/j.peptides.2010.11.023 PMid:21129426 29. Caliskan Y, Yelken B, Gorgulu N, Ozkok A, Yazici H, Telci
A, et al. Comparison of markers of appetite and inflamma-tion between hemodialysis patients with and without failed renal transplants. J Ren Nutr 2012;22:258-67. http://dx.doi. org/10.1053/j.jrn.2011.07.005 PMid:22056149
30. Tentolouris N, Makrilakis K, Doulgerakis D, Moyssakis I, Kokkinos A, Kyriaki D, et al. Increased plasma ghrelin levels in chronic renal failure are not associated with hemodynamic parameters. Horm Metab Res 2005;37:646-52. http://dx.doi. org/10.1055/s-2005-870530 PMid:16278789
31. Itoh T, Nagaya N, Yoshikawa M, Fukuoka A, Takenaka H, Shimizu Y, et al. Elevated plasma ghrelin level in underwei-ght patients with chronic obstructive pulmonary disease. Am J Respir Crit Care Med 2004;170:879-82. http://dx.doi. org/10.1164/rccm.200310-1404OC PMid:15271696
32. Shiiya T, Nakazato M, Mizuta M, Date Y, Mondal MS, Tanaka M, et al. Plasma ghrelin levels in lean and obese hu-mans and the effect of glucose on ghrelin secretion. J Clin Endocrinol Metab 2002;87:240-4. http://dx.doi.org/10.1210/ jc.87.1.240 PMid:11788653
33. Asakawa A, Inui A, Kaga T, Katsuura G, Fujimiya M, Fujino MA, et al. Antagonism of ghrelin receptor reduces food intake and body weight gain in mice. Gut 2003;52:947-52. http://dx.doi.org/10.1136/gut.52.7.947 PMid:12801949 PM-Cid:1773718
34. Naufel MF, Bordon M, de Aquino TM, Ribeiro EB, de Abreu Carvalhaes JT. Plasma levels of acylated and total ghre-lin in pediatric patients with chronic kidney disease. Pediatr Nephrol 2010;25:2477-82. http://dx.doi.org/10.1007/s00467-010-1628-5 PMid:20734087
35. Chen CY, Asakawa A, Fujimiya M, Lee SD, Inui A. Ghrelin gene products and the regulation of food intake and gut motili-ty. Pharmacol Rev 2009;61:430-81. http://dx.doi.org/10.1124/ pr.109.001958 PMid:20038570
36. Goebel-Stengel M, Hofmann T, Elbelt U, Teuffel P, Ahnis A, Kobelt P, et al. The ghrelin activating enzyme ghrelin-O-acyl-transferase (GOAT) is present in human plasma and expressed dependent on body mass index. Peptides 2013;43C:13-9. http:// dx.doi.org/10.1016/j.peptides.2013.02.011 PMid:23454172 37. Carrero JJ, Stenvinkel P. Inflammation in end-stage renal
38. Fouque D, Kalantar-Zadeh K, Kopple J, Cano N, Chauveau P, Cuppari L. A proposed nomenclature and diagnostic criteria for protein-energy wasting in acute and chronic kidney di-sease. Kidney Int 2008;73:391-8. http://dx.doi.org/10.1038/ sj.ki.5002585 PMid:18094682
39. Cuppari L, Kamimura MA. Avaliação nutricional na doença renal crônica: desafios na prática clínica. J Bras Nefrol 2009;31:28-35.
40. Weiss TW, Seljeflot I, Hjerkinn EM, Arnesen H. Adipose tissue pro-inflammatory gene expression is associated with cardiovas-cular disease. Int J Clin Pract 2011;65:939-44. http://dx.doi. org/10.1111/j.1742-1241.2011.02717.x PMid:21849008
41. Mafra D, Farage N. O papel do tecido adiposo na doença renal crônica. J Bras Nefrol 2006;28:108-13.
42. Yada T, Kaiya H, Mutoh K, Azuma T, Hyodo S, Kangawa K. Ghrelin stimulates phagocytosis and superoxide production in fish leukocytes. J Endocrinol 2006;189:57-65. http://dx.doi. org/10.1677/joe.1.06187 PMid:16614381