LPS-Stimulated Whole Blood Cytokine
Production Is Not Related to Disease
Behavior in Patients with Quiescent Crohn's
Disease
Mark M. T. J. Broekman1*, Hennie M. J. Roelofs1, Frank Hoentjen1, Renske Wiegertjes1, Nicole Stoel1, Leo A. Joosten2, Dirk J. de Jong1, Geert J. A. Wanten1
1Department of Gastroenterology & Hepatology, Radboud University Nijmegen Medical Center, Nijmegen, the Netherlands,2Department of Internal Medicine, Radboud University Medical Center, Nijmegen, the Netherlands
Abstract
Introduction
Crohn’s disease (CD) is a chronic inflammatory disease in which cytokines play a pivotal role in the induction and maintenance of inflammation. Innate cytokine production is geneti-cally determined and varies largely between individuals; this might impact the severity of inflammation. We aimed to assess whether ex-vivo endotoxin-stimulated levels of cytokines could be associated with disease phenotype.
Methods
Patients with quiescent CD (Harvey-Bradshaw Index4 and negative inflammation mark-ers) who were not using immunomodulating drugs or biologicals were eligible. Historical dis-ease characteristics (localization, behavior, number of bowel resections, drug history, extra-intestinal symptoms) were extracted from medical records. We measured cytokine levels (tumor necrosis factor (TNF)-α, interleukin (IL)-1β, IL-6 and IL-10) in supernatants of lipo-polysaccharide (LPS) -stimulated whole blood cultures and correlated these with disease characteristics and age- and sex-matched healthy controls. In addition, we analyzed whether single nucleotide polymorphisms (SNPs) in the promoter region of theTNF-αgene
were related to TNF-αlevels.
Results
We included 75 patients with CD and 24 healthy controls. Six patients were excluded because of increased inflammation markers resulting in a total of 69 patients. The mean age (SD) of patients with CD was 51.2 (12.3) years with a mean (SD) disease duration of 24.1 (11.5) years. Disease localization, peri-anal involvement and behavior were not related to LPS-stimulated TNF-α, IL-1β, IL-6 or IL-10 levels. In addition, combination of localization
a11111
OPEN ACCESS
Citation:Broekman MMTJ, Roelofs HMJ, Hoentjen F, Wiegertjes R, Stoel N, Joosten LA, et al. (2015) LPS-Stimulated Whole Blood Cytokine Production Is Not Related to Disease Behavior in Patients with Quiescent Crohn's Disease. PLoS ONE 10(7): e0133932. doi:10.1371/journal.pone.0133932
Editor:Markus M. Heimesaat, Charité, Campus Benjamin Franklin, GERMANY
Received:April 18, 2015
Accepted:July 2, 2015
Published:July 24, 2015
Copyright:© 2015 Broekman et al. This is an open access article distributed under the terms of the Creative Commons Attribution License, which permits unrestricted use, distribution, and reproduction in any medium, provided the original author and source are credited.
Data Availability Statement:All relevant data are within the paper.
Funding:The authors have no support or funding to report.
with behavior to differentiate mild from severe disease type showed no significant differ-ences. TNF-αlevels were higher in patients with CD (428 pg/ml IQR [267-468]) compared to healthy controls (459 pg/ml IQR [364-570], p=0.02). We found no associations between SNPs in the promoter region and TNF-αlevels.
Conclusion
In this study, innate cytokine production of TNF-α, IL-1β, IL-6 and IL-10 was not related to historical disease characteristics or disease severity in patients with quiescent CD. These findings suggest that genetically determined levels of these cytokines obtained from LPS-stimulated whole blood cultures are not linked with disease behavior or severity.
Introduction
There is a wide variation in the disease course in patients with Crohn’s Disease (CD) ranging from mild ileal inflammation to involvement of the entire gastro-intestinal tract with complica-tions from penetrating disease and extra-intestinal manifestacomplica-tions. So far no reliable biomark-ers have been identified as tools to predict disease course [1]. Among the studied biomarkers, patterns in cytokine production remain of particular interest, because of their significant role in the pathogenesis and course of CD [2–5]. The latter is illustrated by genome wide association studies showing that many susceptibility loci for CD are involved in the regulation of cytokine production [6].
The quantity of cytokines produced by individuals after exposure to a stimulus such as lipo-polysaccharide (LPS) varies to a large extent [7,8]. A persons’cytokine production appears to be genetically regulated for 60–70% [9]. This, in combination with a limited intrapersonal vari-ability makes that individuals can be categorized as high- or low producers [10–13]. Prior research in other inflammation-driven diseases showed an association between innate cytokine production and both disease course and response to treatment [14–16].
In CD the defective mucosal barrier of the gut lumen is predominantly exposed to gram-negative bacteria, containing high levels of LPS. In this way individual differences in cytokine production might steer the severity of inflammation and predict the disease course of patients with CD. With this hypothesis previous studies found an association between innate cytokine production in mucosal tissue and disease behavior. For example, mucosal levels of the pro-inflammatory cytokines tumor necrosis factor (TNF)-α, interleukin (IL)-1βand IL-6 were associated with disease relapse [17,18], while lower mucosal levels of the anti-inflammatory IL-10 increased the risk of disease [19]. However, the feasibility of mucosal cytokine measure-ments for clinical practice remains limited due to the need for biopsies.
quiescent CD, not using immunomodulators or biologicals and correlated these data to disease characteristics and phenotype to establish their role in disease development.
Methods
Ethics Statement
The local ethics committee, METC Arnhem Nijmegen, the Netherlands, approved the study under the protocol number 2013/091 and written informed consent was obtained from all par-ticipating patients. The study complies with the declaration of Helsinki.
Study population
Patients with CD in remission (defined as a Harvey-Bradshaw Index4) were eligible for par-ticipation. Patients using non-steroidal anti-inflammatory drugs, biologicals (anti-TNF-α
agents) or immunomodulating drugs (thiopurines, glucocorticoids, methotrexate and cyclo-sporine) other than 5-aminosalicylic derivates in the past six months were not eligible for study participation as these drugs modulateex vivocytokine production [16,21–24,26–30]. To
pre-vent the formation of a non-representative sample of patients with only mild disease, a history of CD-related abdominal surgery was set as an additional inclusion criterion. Exclusion criteria were concomitant systemic diseases, active malignancy or smoking of more than five cigarettes per day [31]. At the day of inclusion heparinized blood (10 ml) was collected for cytokine surements together with samples for C-reactive protein (CRP) and hemocytometry (as mea-sured in the central hospital laboratory). Patients with CRP levels>10 mg/l or leukocyte counts outside normal limits were excluded for analysis [32]. Age- and sex-matched healthy controls were included. Patients were enrolled at the Radboud University Medical Center in Nijmegen, the Netherlands.
Disease phenotype
Medical records were checked prior to cytokine measurements by one investigator (MB) for the following variables: disease duration, disease behavior according to the Montreal classifica-tion [33], occurrence of extra- intestinal symptoms, number of bowel resections and the time frame during which glucocorticoids, thiopurines, biologicals, methotrexate or cyclosporine had been prescribed. Besides analyses based on phenotypes derived from the Montreal classifica-tion we compared patients with a combinaclassifica-tion of ileal disease in the absence of fistulas (classi-fied as mild disease type) and patients with penetrating disease in combination with activity in both ileum and colon (classified as severe disease type). Two other outcomes used to separate mild and severe disease type were number of bowel resections and the percentage of years in which a patient received systemic treatment (glucocorticoids, thiopurines, methotrexate or bio-logicals). Both the number of bowel resections as wells as the number of years in which a patient received systemic treatment were corrected for disease duration to exclude bias by exposure time.
Cytokine measurement
Cytokines were measured in whole blood cultures after stimulation withE.coliO55:B5 LPS
(RPMI; PAA Laboratories GmbH) supplemented with glutamine. Diluted blood was seeded into a 6-well microtiter plate and stimulated with 1 ng/ml (final concentration) LPS. Blood was incubated at 37°C and 5% CO2. Supernatants were harvested after four hours (TNF-α) and 24
hours (other cytokines) of incubation and stored at -80°C until usage [28]. TNF-αlevels were measured using specific Pelikine compactTM human TNF-αenzyme-linked immunosorbent assay (ELISA) kits (Sanquin, Amsterdam, The Netherlands) according to the manufactures instructions with a sensitivity of 1–3 pg/ml. IL-1β, IL-6 and IL-10 were measured with specific Duoset ELISA Development kits (R&D Systems Inc, Minneapolis, MN, USA), with a sensitivity of 3.91 pg/mL for IL-1β(http://www.rndsystems.com/Products/DY201-05), 9.38 pg/mL for
IL-6, (http://www.rndsystems.com/Products/dy206-05/), and 31.2 pg/ml for IL-10 (http://www.
rndsystems.com/Products/DY217B-05), respectively. Cytokine levels where corrected for total
leukocyte counts.
Polymorphisms in the TNF-
α
promoter region
The presence of single nucleotide polymorphisms (SNPs) in the promoter region ofTNF-αhas been linked to the TNF-αproduction [12] and is in this way used as a surrogate marker to explore correlations between TNF-αproduction and disease characteristics [35]. To test this assumption in our cohort we correlated SNPs in the promoter region of theTNF-αgene with TNF-αlevels. Herefore, genomic DNA was isolated with the High Pure PCR Template Prepa-ration Kit (Roche Diagnostics GmbH, Mannheim, Germany) according to the manufacturers protocol. This kit removes heparin from the sample and therewith avoids its influence on the polymerase chain reaction (PCR). After dividing it into two blocks theTNF-αpromoter region was amplified by PCR using the primers depicted inTable 1. PCR products were analyzed by Sanger sequencing on an ABI3730 Genetic Analyzer (Applied Biosystems). A combination of Gene Runner, version 3.00 (Hasting Software, Inc) and ChromasPro, version 1.15 (Technely-sium Pty Ltd, Australia) was used to screen theTNF-αpromoter region for the presence of SNPs. Analysis were done prior to measurement of TNF-αlevels.
Statistics
Depending on the distribution of the data, mean with SD (parametric) or median with IQR (non-parametric) test were used. The relation between SNPs in the promoter region of the
TNF-αgene and TNF-αproduction was analyzed using the Kruskal-Wallis test. Haplotypes of
polymorphisms in theTNF-αpromoter region seen in more than three patients were tested for associations with TNF-αproduction. A two-tailed p-value of<0.05 was considered significant and Bonferroni correction was used to deal with multiple testing. Statistical analysis was per-formed by using SPSS version 20.0.0.1 (SPSS Inc, Chicago, IL, USA).
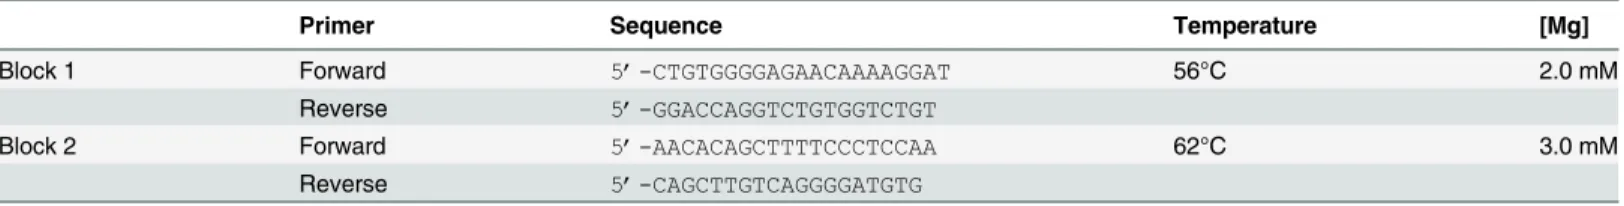
Table 1. Primer sequences and conditions for the TNF-αpromoter gene.
Primer Sequence Temperature [Mg]
Block 1 Forward 5’-CTGTGGGGAGAACAAAAGGAT 56°C 2.0 mM
Reverse 5’-GGACCAGGTCTGTGGTCTGT
Block 2 Forward 5’-AACACAGCTTTTCCCTCCAA 62°C 3.0 mM
Reverse 5’-CAGCTTGTCAGGGGATGTG
Mg:Magnesium concentration.
Results
Baseline characteristics
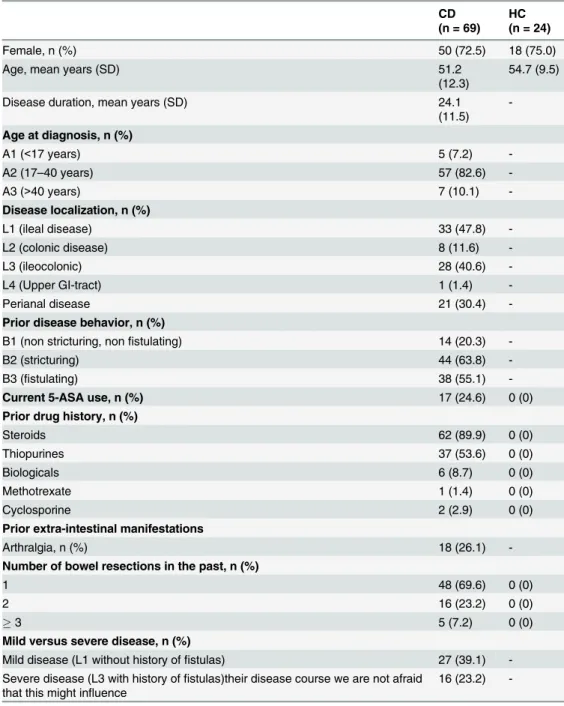
In total, 75 patients with histologically confirmed CD were included. Six patients were excluded for analysis based on elevated CRP levels or leukocyte counts. Baseline characteristics of the remaining 69 patients and 24 healthy controls are depicted inTable 2. There was no significant difference in gender (p = 0.97) and age (p = 0.2) between patients and controls.
Table 2. Baseline characteristics of the included patients with CD and HC.
CD (n = 69)
HC (n = 24)
Female, n (%) 50 (72.5) 18 (75.0)
Age, mean years (SD) 51.2
(12.3)
54.7 (9.5)
Disease duration, mean years (SD) 24.1
(11.5)
-Age at diagnosis, n (%)
A1 (<17 years) 5 (7.2)
-A2 (17–40 years) 57 (82.6)
-A3 (>40 years) 7 (10.1)
-Disease localization, n (%)
L1 (ileal disease) 33 (47.8)
-L2 (colonic disease) 8 (11.6)
-L3 (ileocolonic) 28 (40.6)
-L4 (Upper GI-tract) 1 (1.4)
-Perianal disease 21 (30.4)
-Prior disease behavior, n (%)
B1 (non stricturing, nonfistulating) 14 (20.3)
-B2 (stricturing) 44 (63.8)
-B3 (fistulating) 38 (55.1)
-Current 5-ASA use, n (%) 17 (24.6) 0 (0)
Prior drug history, n (%)
Steroids 62 (89.9) 0 (0)
Thiopurines 37 (53.6) 0 (0)
Biologicals 6 (8.7) 0 (0)
Methotrexate 1 (1.4) 0 (0)
Cyclosporine 2 (2.9) 0 (0)
Prior extra-intestinal manifestations
Arthralgia, n (%) 18 (26.1)
-Number of bowel resections in the past, n (%)
1 48 (69.6) 0 (0)
2 16 (23.2) 0 (0)
3 5 (7.2) 0 (0)
Mild versus severe disease, n (%)
Mild disease (L1 without history offistulas) 27 (39.1) -Severe disease (L3 with history offistulas)their disease course we are not afraid
that this might influence
16 (23.2)
-CD, Crohn’s disease; HC, healthy controls; SD, standard deviation; 5-ASA, 5-aminosalicylic acid.
Healthy controls versus patients with quiescent CD
Patients with CD had significant higher TNF-αlevels upon stimulation with LPS (p = 0.02). No difference was seen with IL-1β, IL-6 and IL-10 between patients with CD and healthy con-trols (Table 3).
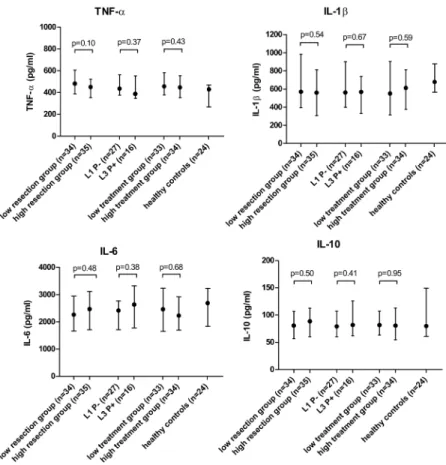
Correlation between cytokine production and disease phenotypes. Table 4andFig 1 show the median cytokine production and corresponding p-values in relation to disease char-acteristics and disease severity. None of the disease charchar-acteristics showed a significant correla-tion with TNF-α, IL-1β, IL-6 or IL-10 levels.
Polymorphisms in the TNF-
α
promoter region and TNF-
α
production
Fig 2shows the TNF-αvalues of patients with various genotypes in theTNF-αpromoter
region. We found no evidence for an increased TNF-αproduction in LPS-stimulated whole blood cultures of patients with one or more SNPs in theTNF-αpromoter region. The -308A genotype, the most used surrogate marker for a high producer phenotype, showed a median [IQR] TNF-αproduction of 450 pg/ml [306–554] compared to 469 pg/ml [378–590] in
Table 3. cytokine production in healthy controls versus patients with quiescent CD.
Healthy controls (n = 24) CD (n = 69) Pvalue
TNF-α[IQR] 428 [267–468] 459 [364–570] 0.02
IL-1β[IQR] 679 [565–878] 561 [374–850] 0.11
IL-6 [IQR] 2687 [1830–3228] 2384 [1703–3049] 0.39
IL-10 [IQR] 80 [61–149] 82 [59–107] 0.52
Cytokine levels (pg/ml) are presented as medians with the interquartile range [IQR]. TNF-α, Tumor necrosis factor alpha; IL, Interleukin; IQR, interquartile range; CD, Crohn's disease.
doi:10.1371/journal.pone.0133932.t003
Table 4. Cytokine production and disease characteristics.
TNF-α[IQR] Pvalue IL-1β[IQR] Pvalue IL-6 [IQR] Pvalue IL-10 [IQR] Pvalue
HC (n = 24) 428 [267–468] 679 [565–878] 2687 [1830–3228] 80 [61–149]
Localization
L1 (n = 33) 454 [362–624] 561 [356–903] 2384 [1585–3017] 89 [65–107]
L2 (n = 8) 516 [469–560] 603 [237–1243] 2715 [1701–3465] 64 [30–83]
L3 (n = 28) 421 [354–561] 0.41 568 [387–750] 0.90 2395 [1756–2830] 0.79 81 [55–112] 0.22
P—(n = 48) 452 [368–573] 569 [380–901] 2384 [1711–2872] 88 [64–111]
P + (n = 21) 483 [325–575] 0.98 560 [272–747] 0.58 2491 [1469–3332] 0.92 75 [55–107] 0.32
Behavior
Nofistulas (n = 31) 454 [400–563] 561 [384–905] 2417 [1707–2816] 79 [55–107] Fistulas (n = 38) 462 [350–579] 0.55 568 [298–813] 0.62 2351 [1567–3305] 0.81 82 [62–108] 0.50 No strictures (= 25) 408 [351–584] 511 [254–859] 2402 [1691–3062] 90 [67–114] Strictures (n = 44) 476 [387–573] 0.38 569 [400–866] 0.45 2384 [1703–3049] 0.92 77 [54–107] 0.12
Extra intestinal manifestations
No arthralgia (n = 51) 454 [373–578] 577 [379–902] 2445 [1706–3045] 85 [62–106] Arthralgia (n = 18) 476 [348–562] 0.90 550 [261–796] 0.51 2204 [1588–3088] 0.46 82 [53–124] 0.77
Cytokine levels (pg/ml) are presented as medians with the interquartile range [IQR]. HC, Healthy control; TNF-α, Tumor necrosis factor alpha; IL, Interleukin; L1, ileal disease; L2, colonic disease; L3, ileocolonic disease; P-, no peri-anal disease; P+, peri-anal disease; IQR, interquartile range.
patients with the most common genotype (P = 0.25). The -863AA genotype (TNF-α produc-tion of 523 pg/ml) and -857TT genotype (TNF-αproduction of 1053 pg/ml) were only detected once and were not included inFig 2. The haplotypes, -1032T with -863A (n = 12), and -1032T with -238A (n = 4) were not related with TNF-αproduction.
Discussion
We found that the inter individual variation in LPS-induced production of TNF-α, IL-1β, IL-6 and IL-10 in whole blood cultures was not related to disease phenotype in patients with quies-cent CD who were not taking immunomodulators or biologicals. Also, when disease character-istics where combined to differentiate mild from more severe disease type no differences were found.
The innate cytokine production by an individual is constant over time, but might be affected by many variables such as disease activity and concomitant drug treatment [16,22–29,31,36]. For this reason we excluded patients with disease activity or maintenance therapy, thereby minimizing variables other than genetic that can modulate cytokine production as far as possi-ble. To our knowledge, only a limited number of studies included patients with CD in remis-sion without maintenance therapy [5,21,37]. In these studies decreased levels of TNF-αand
Fig 1. Relation between cytokine production and disease severity.Values are presented as medians (pg/ml) with the interquartile range. For the number of bowel resections and treatment exposure patients were dichotomized in a low and high group according to the number of resections or the percentage of years in which they were treated with steroids, thiopurines, biologicals, methotrexate or cyclosporine, corrected for disease duration. Two patients were excluded for the analysis for treatment exposure, because no complete drug history was available. TNF-α, Tumor necrosis factor alpha; IL, Interleukin; L1, ileal disease; L3, ileocolonic disease; P-, no fistulas; P+, fistulating disease.
IL-6 produced by monocyte derived macrophages compared to healthy controls were found. Furthermore, an association with disease localisation in patients with CD was seen e.g. patients with colonic disease (L2) had significant lower TNF-αproduction upon LPS stimulation com-pared to patients with only ileal disease (L1) [21]. We did not find a significant difference in cytokine production between patients with L1 and L2 disease in our study. A possible explana-tion here might be that in our cohort only a small number of patients (n = 8; 11.6%) had exclusively colonic disease, compared to 44 (43.6%) in the study of Sewell et al. [21] Another explanation might be that they studied cytokine production from monocyte-derived macro-phages, while we studied whole blood cultures. To our knowledge there are no studies compar-ing cytokine production of whole blood cultures (includcompar-ing all natural components) with a homogeneous cell suspension of monocyte-derived macrophages, which makes it difficult to interpret these differences. It is unlikely that the higher TNF-αlevels which we found in patients with CD were caused by disease activity, but this cannot completely be excluded. A more likely explanation can be found in the different cell populations being investigated. The presence of neutrophils in a whole blood culture is the most important difference in experi-mental setup compared to stimulation of isolated peripheral monocytes or monocyte derived macrophages. Since TNF-αproduction is equal in isolated peripheral monocytes in CD and healthy controls [38], it might be that an impaired inhibitory function by neutrophils on pro-inflammatory cytokine production led to higher TNF-αvalues in patients with CD [39]. A recent study indeed showed a disturbed cell signaling in neutrophils from patients with CD, which supports our hypothesis [40]. However, further research is warranted to elucidate this mechanism.
Fig 2. TNF-αproduction (pg/ml) according to (SNPs) in the promoter region of theTNF-αgene.Values are expressed as medians with the interquartile range. The median value of the healthy controls serves as reference. TNF-α, Tumor necrosis factor alpha; SNPs, single nucleotide polymorphisms
With respect to IL-6, there is another study which also used LPS stimulated whole blood cultures and measured IL-6 levels in patients with CD and HD. They found reduced IL-6 levels in patients with CD, however this study included patients with active disease and on mainte-nance therapy [41]. This might have influenced IL-6 levels and such makes it hard to compare with our results.
IL-10 is considered the most potent anti-inflammatory cytokine in the human immune response, playing a key role in immune homeostasis. Its significance for CD follows from IL-10 knock-out mice developing CD-like enterocolitis [42]. Furthermore, SNPs in IL-10 may predis-pose for young onset CD, which is considered as more severe and difficult to treat [43]. There-fore, it can be hypothesized that patients with a high producer phenotype of IL-10 have a milder disease course [19]. A study in patients with CD in remission showed that IL-10 levels were decreased in patients with a history of fistulating disease [44]. An important difference with our study is that the majority of the patients in the latter study used immunomodulators. Since fistulas are more difficult to treat, it is likely that especially these patients were on immu-nosuppressive medication. Knowing that immunomodulating agents affect cytokine produc-tion, this might have influenced their findings [23].
Techniques of measuring cytokine production in peripheral blood have been well estab-lished. However, apart from studies comparing cytokine levels of healthy persons with patients with CD, the application of these techniques to explore a relation with disease characteristics in CD is limited to a few recent studies [20,21,44]. An alternative strategy to categorize patients as high- or low producers is to look at SNPs involved in cytokine regulation. These SNPs can lead to an increase or decrease in cytokine production and their presence is therefore used as a surrogate marker for high- or low producer phenotype [35,45]. Our study was not primarily designed to explore an association between SNPs in theTNF-αgene and TNF-αproduction. Even so the results do not support such a relation, which is in line with recent literature [46]. Therefore, it seems more appropriate to categorize patients as being low or high producer based on actual cytokine measurements rather than on genetic proxy’s.
Our study comes with some limitations. First of all, the power of our study to pick up more subtle associations can be compromised by our strict inclusion criteria, which limited the num-ber of enrolled patients. Nevertheless, the included patients represent a unique population of patients with CD in whom immune functions are probably not disturbed by disease activity or concomitant use of immunomodulating drugs. Furthermore, we defined“remission”as a Har-vey-Bradshaw Index of4, in combination with normal leukocyte counts and CRP levels. Although colonoscopy is the golden standard to exclude mucosal inflammation, this was con-sidered a too high burden for our patients in this setting. The strict inclusion criteria precluded participation of patients with maintenance therapy or active disease, i.e. those with a potentially severe disease course. However, compared to a previous study in patients with CD in our hos-pital no differences were seen in disease characteristics [47], suggesting that our inclusion crite-ria did not lead to significant selection bias. Differences in the moment of diagnosis may have influenced the outcomes for drug exposure to some extent, because of evolving treatment regimes. More specifically, patients with a longer disease history were relatively underexposed to new treatment modalities, while patients with a more recent date of diagnosis usually are confronted with steroid-free treatment strategies. To prevent bias, we merged the data of gluco-corticoid, thiopurine, biological and other immunosuppressants use. This gave us a valuable impression for the need of immunnosupressive drugs to control disease activity. In order to prevent bias, medical records and presence of SNPs in the TNF-αpromoter region were ana-lyzed before measuring TNF-αproduction.
drugs or biologicals could not be correlated to historical disease phenotype, course or severity. This suggests that individual differences in innate cytokine production are not important for the development of disease phenotype in CD.
Author Contributions
Conceived and designed the experiments: MB HR LJ FH DJ GW. Performed the experiments: MB HR RW NS. Analyzed the data: MB HR RW NS FH DJ GW. Contributed reagents/materi-als/analysis tools: MB HR FH DJ GW. Wrote the paper: MB HR FH LJ DJ GW.
References
1. Vermeire S, Ferrante M, Rutgeerts P (2013) Recent advances: Personalised use of current Crohn's dis-ease therapeutic options. Gut 62: 1511–1515. doi:10.1136/gutjnl-2012-303958PMID:24037876
2. Neurath MF (2014) Cytokines in inflammatory bowel disease. Nat Rev Immunol 14: 329–342. doi:10. 1038/nri3661PMID:24751956
3. Waldner MJ, Neurath MF (2014) Master regulator of intestinal disease: IL-6 in chronic inflammation and cancer development. Semin Immunol 26: 75–79. doi:10.1016/j.smim.2013.12.003PMID:24447345
4. Brown SJ, Mayer L (2007) The immune response in inflammatory bowel disease. Am J Gastroenterol 102: 2058–2069. PMID:17561966
5. Marks DJ, Harbord MW, MacAllister R, Rahman FZ, Young J, et al. (2006) Defective acute inflamma-tion in Crohn's disease: a clinical investigainflamma-tion. Lancet 367: 668–678. PMID:16503465
6. Jostins L, Ripke S, Weersma RK, Duerr RH, McGovern DP, et al. (2012) Host-microbe interactions have shaped the genetic architecture of inflammatory bowel disease. Nature 491: 119–124. doi:10. 1038/nature11582PMID:23128233
7. Westendorp RG, Langermans JA, Huizinga TW, Elouali AH, Verweij CL, et al. (1997) Genetic influence on cytokine production and fatal meningococcal disease. Lancet 349: 170–173. PMID:9111542
8. Riyazi N, Slagboom E, de Craen AJ, Meulenbelt I, Houwing-Duistermaat JJ, et al. (2005) Association of the risk of osteoarthritis with high innate production of interleukin-1beta and low innate production of interleukin-10 ex vivo, upon lipopolysaccharide stimulation. Arthritis Rheum 52: 1443–1450. PMID: 15880595
9. de Craen AJ, Posthuma D, Remarque EJ, van den Biggelaar AH, Westendorp RG, et al. (2005) Heritability estimates of innate immunity: an extended twin study. Genes Immun 6: 167–170. PMID: 15674372
10. van der Linden MW, Huizinga TW, Stoeken DJ, Sturk A, Westendorp RG (1998) Determination of tumour necrosis factor-alpha and interleukin-10 production in a whole blood stimulation system: assessment of laboratory error and individual variation. J Immunol Methods 218: 63–71. PMID: 9819123
11. Yaqoob P, Newsholme EA, Calder PC (1999) Comparison of cytokine production in cultures of whole human blood and purified mononuclear cells. Cytokine 11: 600–605. PMID:10433807
12. Jacob CO, Fronek Z, Lewis GD, Koo M, Hansen JA, et al. (1990) Heritable major histocompatibility complex class II-associated differences in production of tumor necrosis factor alpha: relevance to genetic predisposition to systemic lupus erythematosus. Proc Natl Acad Sci U S A 87: 1233–1237. PMID:2105500
13. Wouters IM, Douwes J, Thorne PS, Heederik D, Doekes G (2002) Inter- and intraindividual variation of endotoxin- and beta(1—>3)-glucan-induced cytokine responses in a whole blood assay. Toxicol Ind Health 18: 15–27. PMID:12703679
14. Botha-Scheepers S, Watt I, Slagboom E, de Craen AJ, Meulenbelt I, et al. (2008) Innate production of tumour necrosis factor alpha and interleukin 10 is associated with radiological progression of knee oste-oarthritis. Ann Rheum Dis 67: 1165–1169. PMID:18029383
15. Brazova J, Sediva A, Pospisilova D, Vavrova V, Pohunek P, et al. (2005) Differential cytokine profile in children with cystic fibrosis. Clin Immunol 115: 210–215. PMID:15885645
16. Kayakabe K, Kuroiwa T, Sakurai N, Ikeuchi H, Kadiombo AT, et al. (2012) Interleukin-1beta measure-ment in stimulated whole blood cultures is useful to predict response to anti-TNF therapies in rheuma-toid arthritis. Rheumatology (Oxford) 51: 1639–1643.
18. Yamamoto T, Umegae S, Kitagawa T, Matsumoto K (2004) Mucosal cytokine production during remis-sion after resection for Crohn's disease and its relationship to future relapse. Aliment Pharmacol Ther 19: 671–678. PMID:15023169
19. Meresse B, Rutgeerts P, Malchow H, Dubucquoi S, Dessaint JP, et al. (2002) Low ileal interleukin 10 concentrations are predictive of endoscopic recurrence in patients with Crohn's disease. Gut 50: 25–
28. PMID:11772962
20. Maranville JC, Micic D, Hanauer SB, Di Rienzo A, Kupfer SS (2014) In vitro sensitivity assays and clini-cal response to glucocorticoids in patients with inflammatory bowel disease. J Crohns Colitis 8: 1539–
1547. doi:10.1016/j.crohns.2014.06.013PMID:25052346
21. Sewell GW, Rahman FZ, Levine AP, Jostins L, Smith PJ, et al. (2012) Defective tumor necrosis factor release from Crohn's disease macrophages in response to Toll-like receptor activation: relationship to phenotype and genome-wide association susceptibility loci. Inflamm Bowel Dis 18: 2120–2127. doi: 10.1002/ibd.22952PMID:22434667
22. Koss K, Satsangi J, Fanning GC, Welsh KI, Jewell DP (2000) Cytokine (TNF alpha, LT alpha and IL-10) polymorphisms in inflammatory bowel diseases and normal controls: differential effects on production and allele frequencies. Genes Immun 1: 185–190. PMID:11196710
23. Hildner K, Marker-Hermann E, Schlaak JF, Becker C, Germann T, et al. (1998) Azathioprine, mycophe-nolate mofetil, and methotrexate specifically modulate cytokine production by T cells. Ann N Y Acad Sci 859: 204–207. PMID:9928388
24. Gerards AH, de Lathouder S, de Groot ER, Dijkmans BA, Aarden LA (2003) Inhibition of cytokine pro-duction by methotrexate. Studies in healthy volunteers and patients with rheumatoid arthritis. Rheuma-tology (Oxford) 42: 1189–1196.
25. Nikolaus S, Bauditz J, Gionchetti P, Witt C, Lochs H, et al. (1998) Increased secretion of pro-inflamma-tory cytokines by circulating polymorphonuclear neutrophils and regulation by interleukin 10 during intestinal inflammation. Gut 42: 470–476. PMID:9616306
26. Swantek JL, Cobb MH, Geppert TD (1997) Jun N-terminal kinase/stress-activated protein kinase (JNK/ SAPK) is required for lipopolysaccharide stimulation of tumor necrosis factor alpha (TNF-alpha) transla-tion: glucocorticoids inhibit TNF-alpha translation by blocking JNK/SAPK. Mol Cell Biol 17: 6274–6282. PMID:9343388
27. Papadakis KA, Targan SR (2000) Tumor necrosis factor: biology and therapeutic inhibitors. Gastroen-terology 119: 1148–1157. PMID:11040201
28. Horton DL, Remick DG (2010) Delayed addition of glucocorticoids selectively suppresses cytokine pro-duction in stimulated human whole blood. Clin Vaccine Immunol 17: 979–985. doi:10.1128/CVI. 00404-09PMID:20445007
29. Ai W, Li H, Song N, Li L, Chen H (2013) Optimal method to stimulate cytokine production and its use in immunotoxicity assessment. Int J Environ Res Public Health 10: 3834–3842. doi:10.3390/
ijerph10093834PMID:23985769
30. Page TH, Turner JJ, Brown AC, Timms EM, Inglis JJ, et al. (2010) Nonsteroidal anti-inflammatory drugs increase TNF production in rheumatoid synovial membrane cultures and whole blood. J Immunol 185: 3694–3701. doi:10.4049/jimmunol.1000906PMID:20713883
31. Ouyang Y, Virasch N, Hao P, Aubrey MT, Mukerjee N, et al. (2000) Suppression of human 1beta, IL-2, IFN-gamma, and TNF-alpha production by cigarette smoke extracts. J Allergy Clin Immunol 106: 280–287. PMID:10932071
32. Vermeire S, Van Assche G, Rutgeerts P (2004) C-reactive protein as a marker for inflammatory bowel disease. Inflamm Bowel Dis 10: 661–665. PMID:15472532
33. Louis E, Van Kemseke C, Reenaers C (2011) Necessity of phenotypic classification of inflammatory bowel disease. Best Pract Res Clin Gastroenterol 25 Suppl 1: S2–7. doi:10.1016/S1521-6918(11) 70003-8PMID:21640927
34. Damsgaard CT, Lauritzen L, Calder PC, Kjaer TM, Frokiaer H (2009) Whole-blood culture is a valid low-cost method to measure monocytic cytokines—a comparison of cytokine production in cultures of human whole-blood, mononuclear cells and monocytes. J Immunol Methods 340: 95–101. doi:10. 1016/j.jim.2008.10.005PMID:19000693
35. Castro-Santos P, Suarez A, Lopez-Rivas L, Mozo L, Gutierrez C (2006) TNFalpha and IL-10 gene poly-morphisms in inflammatory bowel disease. Association of -1082 AA low producer IL-10 genotype with steroid dependency. Am J Gastroenterol 101: 1039–1047. PMID:16573780
37. Smith AM, Rahman FZ, Hayee B, Graham SJ, Marks DJ, et al. (2009) Disordered macrophage cytokine secretion underlies impaired acute inflammation and bacterial clearance in Crohn's disease. J Exp Med 206: 1883–1897. doi:10.1084/jem.20091233PMID:19652016
38. Schwarzmaier D, Foell D, Weinhage T, Varga G, Dabritz J (2013) Peripheral monocyte functions and activation in patients with quiescent Crohn's disease. PLoS One 8: e62761. doi:10.1371/journal.pone. 0062761PMID:23658649
39. Gresnigt MS, Joosten LA, Verschueren I, van der Meer JW, Netea MG, et al. (2012) Neutrophil-medi-ated inhibition of proinflammatory cytokine responses. J Immunol 189: 4806–4815. doi:10.4049/ jimmunol.1103551PMID:23053514
40. Somasundaram R, Nuij VJ, van der Woude CJ, Kuipers EJ, Peppelenbosch MP, et al. (2013) Periph-eral neutrophil functions and cell signalling in Crohn`s disease. PLoS One 8: e84521. doi:10.1371/ journal.pone.0084521PMID:24367671
41. Koss K, Satsangi J, Welsh KI, Jewell DP (2000) Is interleukin-6 important in inflammatory bowel dis-ease? Genes Immun 1: 207–212. PMID:11196713
42. Kuhn R, Lohler J, Rennick D, Rajewsky K, Muller W (1993) Interleukin-10-deficient mice develop chronic enterocolitis. Cell 75: 263–274. PMID:8402911
43. Amre DK, Mack DR, Morgan K, Israel D, Lambrette P, et al. (2009) Interleukin 10 (IL-10) gene variants and susceptibility for paediatric onset Crohn's disease. Aliment Pharmacol Ther 29: 1025–1031. doi: 10.1111/j.1365-2036.2009.03953.xPMID:19210299
44. Correa I, Veny M, Esteller M, Pique JM, Yague J, et al. (2009) Defective IL-10 production in severe phe-notypes of Crohn's disease. J Leukoc Biol 85: 896–903. doi:10.1189/jlb.1108698PMID:19237638
45. Waschke KA, Villani AC, Vermeire S, Dufresne L, Chen TC, et al. (2005) Tumor necrosis factor receptor gene polymorphisms in Crohn's disease: association with clinical phenotypes. Am J Gastroenterol 100: 1126–1133. PMID:15842589
46. Larsen MH, Albrechtsen A, Thorner LW, Werge T, Hansen T, et al. (2013) Genome-Wide Association Study of Genetic Variants in LPS-Stimulated IL-6, IL-8, IL-10, IL-1ra and TNF-alpha Cytokine Response in a Danish Cohort. PLoS One 8: e66262. PMID:23823136