Skin to calyx distance is not a predictive factor for
miniaturized percutaneous nephrolithotomy outcomes
_______________________________________________
Faruk Ozgor
1, Onur Kucuktopcu
1, Burak Ucpinar
1, Fatih Yanaral
1, Murat Binbay
11 Department of Urology, Haseki Training and Research Hospital, Istanbul, Turkey
ABSTRACT
ARTICLE
INFO
______________________________________________________________ ______________________
Objective: To evaluate the predictive value of the distance from skin to calyx (SCD) on the outcome and complication rates of patients undergoing mPNL.
Materials and Methods: Patient’s charts, who had undergone mPNL between June 2012 and June 2015, were analyzed retrospectively. Patients who had a preoperative com-puterized tomography (CT) were enrolled into the study. Two separateurologists evalu-ated the CT scans and calculevalu-ated the SCD defined as the distance between the skin and surface/lateral edge of the calyx, which was the preferred site of entry for percutaneous access. The average value of the two measurements was included inthe final analysis to avoid bias. The mean SCD was 75mm. According to the median SCD value, patients were divided into two groups: group 1 (SCD ≤75) and group 2 (SCD >75).
Results: A total of 140 patients and 130 patients were enrolled in groups 1 and 2, re-spectively. The mean operation time and the mean fluoroscopy time was significantly longer in group 2 (p:0.004 vs. p:0.021). The rate of blood transfusion was significantly higher in group 1 (6 patients). None of patientsin group 2required blood transfusion (p:0.017). Stone-free status after a single session of mPNL was 67.1% in group 1 and 75.4% in group 2 (p:0.112). After additional procedures, stone-free rates increased to 84.3% and 85.4% in group 1 and group 2, respectively (p:0.802).
Conclusion: Our study demonstrated that longer SCD was not a predictive factor for stone-free rates after mPNL. However, SCD over 75mm was associated with longer operation time and fluoroscopy time with lower rates of transfusion.
Keywords:
Obesity; Nephrostomy, Percutaneous; Kidney Calculi
Int Braz J Urol. 2017; 43: 679-85
_____________________ Submitted for publication: May 20, 2016
_____________________ Accepted after revision: October 01, 2016 _____________________ Published as Ahead of Print: February 10, 2017
INTRODUCTION
Percutaneous nephrolithotomy (PNL) is a well-established surgical optionfor renal stone(s) larger than 2cm and staghorn calculi. Satisfactory stone-free rates can be achieved with PNL. Yet, the procedure itself bears some serious potential compli-cations including bleeding,which may require blood transfusion, adjacent organ injury and septicemia
(1). Conventional PNL is performed using a 24F to
30F nephrostomy tract and the use of larger size instruments have been associated with
unfavora-ble outcomes (2). Recent advances in technology have enabled the design of instruments with smal-ler diameters to use in PNL. Miniaturized percuta-neous nephrolithotomy (mPNL) is defined asPNL performed by using an instrument with an access sheath of 12-20F diameter(3).
Mo-reover, in obese patients, the inadequate length of the working sheath and working instrumentshave an adverse effect on PNL outcomes. Taking into consideration the differences in body types and body fat distribution among people and races, some authors suggested that the distance from skin to calyx (SCD) is amore predictive factor than body mass index on PNL outcomes (5).
Factors affecting the mPNL outcomes are still being investigated and the role of SCD has not been previously evaluated. To our knowledge, this is the fi rst study that investigates the effect of SCD onthe outcome and complication rates of patients undergoing mPNL.
MATERIALS AND METHODS
After approval from the ethics committee, a retrospectivechartreview ofa consecutive series of patientsundergoing mPNL in a tertiary academic center between June 2012 and June 2015 was an-alyzed. Every patient included in the study had undergone a preoperative computerized tomogra-phy (CT) scan and a follow-up imaging 3 months after the mPNL operation. Patients under 18 years of age, withkidney abnormalities, with no avai-lable preoperative CT scans and with a history of PNL procedurewith multiple accesses were exclu-ded from the study.
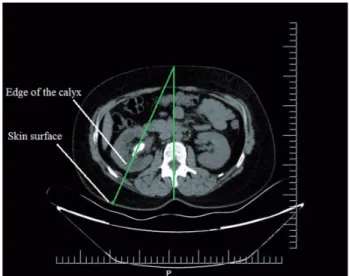
Kidney and stone characteristics of every patient were evaluated with non-contrast compu-terized tomography, preoperatively. Complex sto-nes were defi ned as those located in the pelvis and in at least one calyx or multiple calyces.For each patient, stone size and SCD were measured by two separate urologists to avoid bias. The average value between the two measurements was taken for fi nal analysis. The distance was calculated by drawing a vertical line from the spinous process to the anterior abdominal wall and a second line starting from the anterior abdominal wall and tra-versing the point of the calyceal edge. The SCD was defi ned as the distance between the skin and surface/lateral edge of the calyx, which was the preferred site of entry for percutaneous access (Figure-1). While calculating the SCD, Hounsfi eld unit difference between renal parenchyma and pelvicaliceal system was taken into account to
Figure 1- Example of an axial image from a CT scan, demonstrating the way 'Skin to calyx distance'calculated.
identify the exact point of differentiation between calyx and parenchyma. In our study, the calcula-ted mean SCD was 75mm. According to the me-dian SCD value, patients were stratifi ed into two groups: group 1 (SCD ≤75) and group 2 (SCD >75).
Surgical technique
In the lithotomy position under general anesthesia, a 5Fr ureteral catheter was inserted. In the prone position, the calyceal system was visu-alized using contrast media and access was per-formed to appropriate calyx using an 18G needle under the C-armed scopy unit. A 0.035-inch hy-drophilic guide-wire was delivered into the pelvi-calyceal system. The access tract was dilated using Amplatz dilatators, then an 18- or 20Fr Amplatz sheath was inserted into the pelvicalyceal system. Stone fragmentation was performed with laser or ultrasonic lithotripter and stone extraction forceps was used for stone removal. After completion of the procedure, nephrostomy tube was placed un-der fl uoroscopy if necessary. Operation time was calculated as the time from access to the preferred calyx to the insertion of the nephrostomy tube.
stone-free status was reassessed in the outpatient setting with non-contrast abdominal CT. Patients with complete stone clearence and patients with residual fragments under 4mm were accepted as stone free.
For statistical analysis, values were evalu-ated as numbers, means, percentages and intervals. Numbers and percentages were compared using the Chi-square test. Before the comparison of means of values, the values were evaluated for homogenity. Homogenously distributed values were compared using Student T test and heterogenously distributed values were compared using Mann Whitney U test.
RESULTS
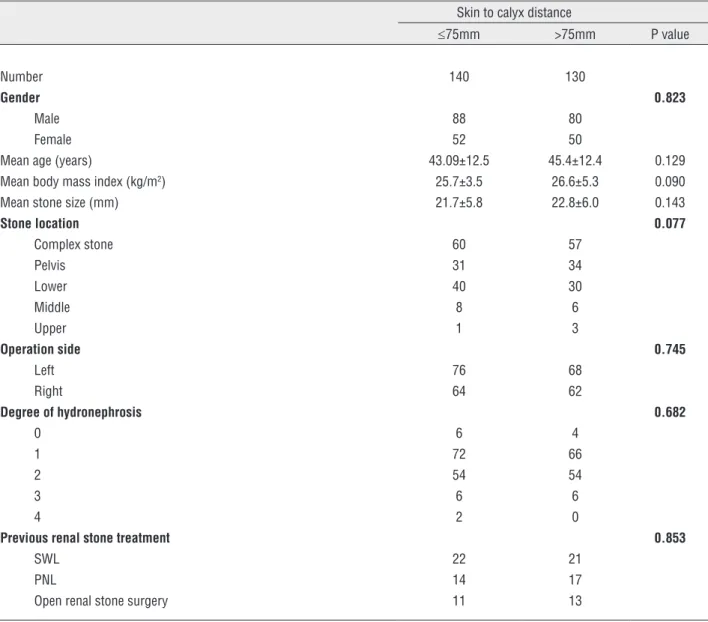
According to the study design, 140 pa-tients with SCD ≤75mm (range, 48-75mm) and 130 patients with SCD >75mm (range, 76-126mm) were enrolled into group 1 and group 2, respec-tively. Preoperative characteristics including gen-der, age, stone size and stone location were simi-lar between the groups (p:0.823, p:0.129, p:0.143 and p:0.077, respectively). Also, the mean BMI was comparable between the groups (p:0.090). Preoperative charecteristics of the two groups are summarized in Table-1.
Table 1 - Comparison of preoperative demographics.
Skin to calyx distance
≤75mm >75mm P value
Number 140 130
Gender 0.823
Male 88 80
Female 52 50
Mean age (years) 43.09±12.5 45.4±12.4 0.129
Mean body mass index (kg/m2) 25.7±3.5 26.6±5.3 0.090
Mean stone size (mm) 21.7±5.8 22.8±6.0 0.143
Stone location 0.077
Complex stone 60 57
Pelvis 31 34
Lower 40 30
Middle 8 6
Upper 1 3
Operation side 0.745
Left 76 68
Right 64 62
Degree of hydronephrosis 0.682
0 6 4
1 72 66
2 54 54
3 6 6
4 2 0
Previous renal stone treatment 0.853
SWL 22 21
PNL 14 17
In both groups, the lower pole was the most preferred location for access. The mean op-eration time was 91.6±37.7min. in group 1 and 105.8±41.9 min. in group 2 (p:0.004). The mean fluoroscopy time was significantly longer in group 2 (p:0.021). The mean hemoglobin drop was higher in group 1 but the difference was not sta-tistically significant (p:0.178). The mean duration of hospitalization time was comparable between the groups (p:0.404) (Table-2).
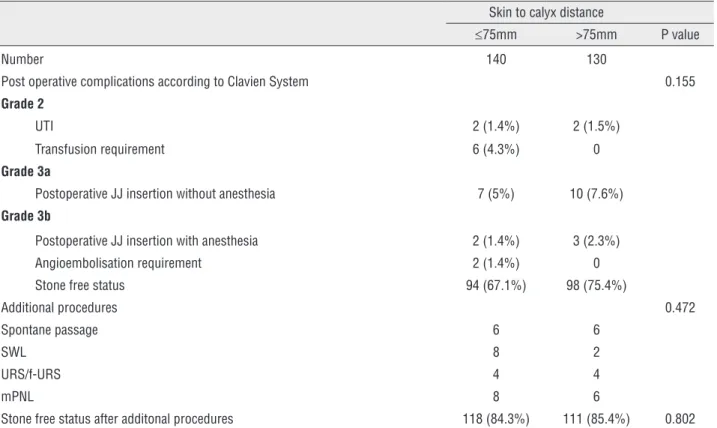
Complications as evaluated by the Clavien system were similar between the groups (p:0.155). Requirement of postoperative JJ insertion was the most common complication in both groups (9 pa-tients in group 1 and 13 papa-tients in group 2). Fe-ver requiring antibiotic therapy was observed in 4 patients (2 patients in group 1 and 2 patients in group 2). When the complications were separate-ly evaluated, the rate of bleeding requring blood transfusion was significantly higher in group 1 and occurred in 6 patients. In two of the 6 patients, angioembolisation was required. In group 2, no patients required blood transfusion (p:0.017). No pulmonary complications and Clavien grade 4 or 5 complications were encountered in both groups.
Stone-free status after a single session of mPNL was 67.1% and 75.4% in group 1 and group 2, respectively (p:0.112). Spontaneous pas-sage of residual fragments occurred in 12 patients. Additional procedures including SWL, F-URS and
mPNL were performed to 20 patients in group 1 and to 12 patients in group 2. After additional procedures, stone free-rates increased to84.3% and 85.4% in group 1 and group 2, respectively (p:0.802) (Table-3).
DISCUSSION
According to the World Health Organiza-tion, obesity is defined as body mass index (BMI) greater than or equal to 30kg/m2(6). However, fat
dispersion is not homogenous among patients with similar BMI. Different body types and thicker ret-roperitoneal fat tissue can become obstacles dur-ing percutaneous access, which is the most chal-lenging part of the PNL procedure. Okhunov et al. developed the Size,Tract length (skin-to-stone distance), degree ofObstruction,Number of caly-ces involved and stoneEssence (density) (STONE) nephrolithometry scoring system for conventional PNL, which includes percutaneous tract length (PTL) and reported that STONE was predictive for stone-free status (7). In another study, Akhavein et al. demonstrated that higher residual fragments remained after conventional PNL in patients with PTL >100mm when compared with patients with PTL ≤100mm (8).
Previous studies that investigated the ef-fect of BMI on PNL outcomes reported controver-sial results (9,10). When we divided patients with
Table 2 - Comparison of perioperative findings.
Skin to calyx distance
≤75mm >75mm P value
Number 140 130
Mean operation time (minutes) 119.6±39.1 131.8±43.1 0.002
Mean fluoroscopy time (minutes) 5.0±3.7 6.1±3.4 0.021
Access location 0.051
Lower 126 114
Middle 14 10
Upper 0 6
Number of intercostal access 0 4 0.037
Mean hemoglobin drop (g/dL) 1.02±1.50 0.78±1.1 0.178
different BMI subgroups according to the WHO criteria, we found no significant difference in operative and post operative results. We hypoth-esized that SCD may have a better predictive value in forecasting outcomes of mPNL because of the variances in fat deployment. To our knowledge, this is the first study to analyze the effect of SCD on intraoperative parameters, outcomes, and com-plication rates of patients undergoing mPNL.
Skin-to-stone distance (SSD) is a predic-tive value used to estimate outcomes after SWL. Gonulalan et al. studied the significance of SSD on PNL outcomes (11). In that study, the outcomes after PNL were compared between two groups that were stratified according to their median SSDs. Gonulalan et al. did not detect a significant re-lationship between longer SSD and PNL success. Once adequate access to the appropriate calyx is achieved, access to the renal pelvis is rela-tively easier, which decreases the importance of the skin-to-stone distance. In Gonulalan’s study, nearly 45% of patients had a renal pelvis stone. Table 3 - Comparison of postoperative results and complications.
Skin to calyx distance
≤75mm >75mm P value
Number 140 130
Post operative complications according to Clavien System 0.155
Grade 2
UTI 2 (1.4%) 2 (1.5%)
Transfusion requirement 6 (4.3%) 0
Grade 3a
Postoperative JJ insertion without anesthesia 7 (5%) 10 (7.6%)
Grade 3b
Postoperative JJ insertion with anesthesia 2 (1.4%) 3 (2.3%)
Angioembolisation requirement 2 (1.4%) 0
Stone free status 94 (67.1%) 98 (75.4%)
Additional procedures 0.472
Spontane passage 6 6
SWL 8 2
URS/f-URS 4 4
mPNL 8 6
Stone free status after additonal procedures 118 (84.3%) 111 (85.4%) 0.802
Thus, we believe that SCD is more predictive than SSD in PNL procedures.
In a recent study, Cakmak et al. analyzed the effect of abdominal fat parameters on PNL outcomes (12). In a univariate analysis, they found that visceral fat area (VFA) and abdominal cir-cumference on computerized tomography (ACCT) were predictive factors for estimating PNL success rates. Moreover, in a multivariate analysis, ACCT was found to be the only abdominal fat parameter to influence the stone-free rates. During PNL, ac-cess to the kidney is obtained through retroperito-neal fat tissue. We suggest that the skin-to-calyx distance is a more reliable parameter than the en-tire ACCT because patients who are obese tend to have different fat distribution patterns.
mPNL. However, Knoll et al. study only included patients with solitary renal stones (13). In an-other study, Kirac et al. reported a stone-free rate of 96% after mPNL (14). In that study, the rate of multiple calyx stones was 32.4%, which was comparable with our complex stone rate (42.9% in group 1 vs. 43.8% in group 2). However, the mean stone size was smaller compared with our study (10.5 vs. 21.7 mm in group 1 and 22.8mm in group 2). The stone characteristics in our study may account for our lower stone-free rates com-pared with other studies. Also, we found no sig-nificant correlation between the length of SCD and stone-free rates.
We found that the mean operation time and mean fluoroscopy time were significantly longer in patients with longer SCD. Ortiz et al. re-ported that poor fluoroscopic visualization of the stone and proper calyx in the presence of increas-ing retroperitoneal fat tissue may brincreas-ing about dif-ficulties in obtaining access (15). Additionally, depth perception becomes harder with increasing SCD, which results in an increased number of ac-cess trials. In our study, the number of acac-cess trials was not reported because of missing data, which will be a subject of our future studies. Keheila et al. emphasized that dilatation and securing the tract in patients with a longer SCD was a chal-lenging and time-consuming process (16).
Fuller et al. preferred to obtain subcostal access to avoid pulmonary complications in pa-tients who were obese and thus more vulnerable to undesired respiratory events under general an-esthesia in the prone position (17). However, our approach in selecting an access location is differ-ent. Upper kidney poles are closer to the back than the lower poles and this may shorten the SCD. We performed 6 upper pole accesses in group 2, but performed no upper pole access in group 1. There was a large difference with access locations be-tween groups but it did not reach statistical sig-nificance (p=0.051). Additionally, upper pole access was performed through the 11th intercostal space in
4 patients; however, we encountered no pulmonary complications. Our results imply that using smaller caliber instruments may prevent pulmonary com-plications. Comparison of the efficiency and safety of upper pole access during conventional PNL and
mPNL in patients who are obese may be the subject of another study.
Blood transfusion rate following conven-tional PNL has been reported between 0.8% and 45% (18). The incidence of blood transfusion sig-nificantly decreased with the use of miniaturized instruments. Cheng et al. reported a 1.4% blood transfusion rate in mPNL (19). Abdelhafez et al. demonstrated a 0.5% blood transfusion rate in 191 patients following mPNL (20). In our study popu-lation, blood transfusion was required in 6 (4.3%) patients in group 1, and no patients required blood transfusion in group 2. Kuntz et al. emphasized that thick perirenal fat tissue may have a protective role by providing external compression, thereby pre-venting hemorrhagic events intraoperatively and after removal of the nephrostomy tube, which may account for the lower transfusion rates in patients with SCD >75mm (21).
Our study, which to the best of our knowl-edge is the first to investigate the effect of SCD on mPNL outcomes, has some limitations. We are aware of the retrospective nature of our study. Additionally, SCD was measured preoperatively on CT scans from an axial plane, which would not match with the exact distance between the skin and the desired calyx for access. However, we measured SCD in a similar manner for every patient. Also, preoperative CT imaging was perfor-med in the supine position and the PNL operation was performed in the prone position, which may have altered the exact SCD. Finally, our procedu-res were performed by different surgeons with di-fferent levels of experience.
To conclude, our study demonstrated that SCD was not a predictive factor for stone-free rates following mPNL. The SCD value >75mm was associated with a longer operation time, longer fluoroscopy screening time, and lower transfusion rates. Our findings need to be validated in further prospective, randomized studies with larger study populations.
ABBREVIATIONS
PNL= Percutaneous nephrolithotomy
BMI= Body mass index
CT= Computerized tomography
KUB= Kidney-ureter-bladder X-Ray
SWL= Shockwave lithotripsy
UTI= Urinary tract infection
JJ= Double J catheter
f-URS= Flexible ureteroscopy
PTL= Percutaneous tract length
mPNL= Miniaturized percutaneous nephrolithotomy
CONFLICT OF INTEREST
None declared.
REFERENCES
1. Unsal A, Resorlu B, Atmaca AF, Diri A, Goktug HN, Can CE, et al. Prediction of morbidity and mortality after percutaneous nephrolithotomy by using the Charlson Comorbidity Index. Urology. 2012;79:55-60.
2. Mishra S, Sharma R, Garg C, Kurien A, Sabnis R, Desai M. Prospective comparative study of miniperc and standard PNL for treatment of 1 to 2 cm size renal stone. BJU Int. 2011;108:896-9.
3. Jackman SV, Docimo SG, Cadeddu JA, Bishoff JT, Kavoussi LR, Jarrett TW. The “mini-perc” technique: a less invasive alternative to percutaneous nephrolithotomy. World J Urol. 1998;16:371-4.
4. Kamphuis GM, Baard J, Westendarp M, de la Rosette JJ. Lessons learned from the CROES percutaneous nephrolithotomy global study. World J Urol. 2015;33:223-33.
5. Astroza GM, Neisius A, Tsivian M, Wang AJ, Preminger GM, Lipkin ME. Does the nephrostomy tract length impact the outcomes of percutaneous nephrolithotomy (PNL)? Int Urol Nephrol. 2014;46:2285-90.
6. de Simone G, Devereux RB, Chinali M, Best LG, Lee ET, Galloway JM, et al. Prognostic impact of metabolic syndrome by different definitions in a population with high prevalence of obesity and diabetes: the Strong Heart Study. Diabetes Care. 2007;30:1851-6.
7. Okhunov Z, Friedlander JI, George AK, Duty BD, Moreira DM, Srinivasan AK, et al. nephrolithometry: novel surgical classification system for kidney calculi. Urology. 2013;81:1154-9. 8. Akhavein A, Henriksen C, Syed J, Bird VG. Prediction of single
procedure success rate using S.T.O.N.E. nephrolithometry surgical classification system with strict criteria for surgical outcome. Urology. 2015;85:69-73.
9. Assmy AM, Shokeir AA, Nahas AR, Shoma AM, Eraky I, El-Kenawy MR, et al. Outcome of percutaneous nephrolithotomy: effect of body mass index. Eur Urol. 2007;52:199-204.
10. Sergeyev I, Koi PT, Jacobs SL, Godelman A, Hoenig DM. Outcome of percutaneous surgery stratified according to body mass index and kidney stone size. Surg Laparosc Endosc Percutan Tech. 2007;17:179-83.
11. Gonulalan U, Akand M, Coban G, Cicek T, Kosan M, Goktas S, et al. Skin-to-stone distance has no impact on outcomes of percutaneous nephrolithotomy. Urol Int. 2014;92:444-8. 12. Cakmak O, Tarhan H, Cimen S, Ekin RG, Akarken I, Oztekin O,
et al. The effect of abdominal fat parameters on percutaneous nephrolithotomy success. Can Urol Assoc J. 2016;10:E99-E103. 13. Knoll T, Jessen JP, Honeck P, Wendt-Nordahl G. Flexible
ureterorenoscopy versus miniaturized PNL for solitary renal calculi of 10-30 mm size. World J Urol. 2011;29:755-9. 14. Kirac M, Bozkurt ÖF, Tunc L, Guneri C, Unsal A, Biri H. Comparison
of retrograde intrarenal surgery and mini-percutaneous nephrolithotomy in management of lower-pole renal stones with a diameter of smaller than 15 mm. Urolithiasis. 2013;41:241-6. 15. Torrecilla Ortiz C, Meza Martínez AI, Vicens Morton AJ, Vila Reyes
H, Colom Feixas S, Suarez Novo JF, et al. Obesity in percutaneous nephrolithotomy. Is body mass index really important? Urology. 2014;84:538-43.
16. Keheila M, Leavitt D, Galli R, Motamedinia P, Theckumparampil N, Siev M, et al. Percutaneous nephrolithotomy in super obese patients (body mass index ≥ 50 kg/m²): overcoming the challenges. BJU Int. 2016;117:300-6.
17. Fuller A, Razvi H, Denstedt JD, Nott L, Pearle M, Cauda F, et al. The CROES percutaneous nephrolithotomy global study: the influence of body mass index on outcome. J Urol. 2012;188:138-44.
18. Turna B, Nazli O, Demiryoguran S, Mammadov R, Cal C. Percutaneous nephrolithotomy: variables that influence hemorrhage. Urology. 2007;69:603-7.
19. Cheng F, Yu W, Zhang X, Yang S, Xia Y, Ruan Y. Minimally invasive tract in percutaneous nephrolithotomy for renal stones. J Endourol. 2010;24:1579-82.
20. Abdelhafez MF, Amend B, Bedke J, Kruck S, Nagele U, Stenzl A, et al. Minimally invasive percutaneous nephrolithotomy: a comparative study of the management of small and large renal stones. Urology. 2013;81:241-5.
21. Kuntz NJ, Neisius A, Astroza GM, Tsivian M, Iqbal MW, Youssef R, et al. Does body mass index impact the outcomes of tubeless percutaneous nephrolithotomy? BJU Int. 2014;114:404-11.
_______________________ Correspondence address: