DOI: 10.1590/0047-2085000000146
1 University of Pernambuco (UPE), Medicine College (Serra Talhada Campus, Mental Health and Primary Health Care Discipline, Practice Laboratory, Research and Evaluation in Mental Health.
2 Federal University of São Paulo (Unifesp), Health Informatics Department.
3 Oswaldo Cruz Foundation (Fiocruz) Sergio Arouca Public Health National School (ENSP). 4 University of Pernambuco (UPE), Biologic Sciences Institute.
5 Federal University of São Paulo (Unifesp), Psychiatry and Medical Psychology Department. Address for correspondence: Pauliana Valéria Machado Galvão
Escola Nacional de Saúde Pública Sergio Arouca Fundação Oswaldo Cruz
Rua Leopoldo Bulhões, 1480, Manguinhos Received on
9/14/2016 Approved on
1/18/2017 Keywords
Cross-cultural comparison, internet, scales, validation studies.
Palavras-chave
Comparação transcultural, internet, escalas, estudos de validação.
Online Cognition Scale in the Portuguese
(Brazil) version (OCS-BR)
Confiabilidade e validade de construto da Online Cognition
Scale da versão português (Brasil) (OCS-BR)
Hugo Rafael de Souza e Silva
1, Kelsy Catherina Nema Areco
2, Paulo Bandiera-Paiva
2, Pauliana Valéria
Machado Galvão
3, Analia Nusya de Medeiros Garcia
4, Dartiu Xavier da Silveira
5ABSTRACT
Objective: To evaluate construct validity and reliability of the Portuguese (Brazil) version of
Online Cognition Scale (OCS-BR). Methods: Portuguese (Brazil) versions of Online Cognition
Scale (OCS), of Internet Addiction Test (IAT) and socio demographic questionnaire was ap-plied to a sample (n = 359) of health university students. Construct validity evidence was ve-rified through the factorial and convergent validity by Confirmatory Factor Analysis (CFA) and internal consistency and stability analysis through Cronbach’s alpha and intraclass correlation coefficient (ICC) respectively. Discriminative power of items were analyzed using item-total
correlation and point biserial correlation. Results: OCS-BR presented satisfactory evidence
of construct validity. The instrument showed Cronbach’s alpha of 0.91 and ICC of 0.91.
Con-clusion: Portuguese (Brazil) version of OCS shows items consistently gatherd to measure the Problematic Internet Use (PIU) construct, it is considered s stable instrument in time and with sufficient evidence of construct validity.
RESUMO
Objetivo: Avaliar a validade de construto e a confiabilidade da versão em português (Brasil)
da Online Cognition Scale (OCS-BR). Métodos: As versões em português (Brasil) da Online
Cognition Scale (OCS), da Internet Addiction Test (IAT) e um questionário sociodemográfico foram aplicados em uma amostra (n = 359) de estudantes universitários de saúde. A evidên-cia de validade de construto foi verificada por meio da validade fatorial e convergente pela Análise Fatorial Confirmatória e pela análise da consistência internal e estabilidade pelo alpha de Cronbach e coeficiente de correlação intraclasse (ICC), respectivamente. O poder discrimi-nativo de itens foi analisado usando a correlação item-total e a correlação do ponto
bisse-rial. Resultados: A OCS-BR apresentou evidência satisfatória de validade de construto. O
instrumento apresentou o alpha de Cronbach de 0,91 e ICC de 0,91. Conclusão: A versão em
INTRODUCTION
The internet invention – which happened in the 1960s – is a humankind breakthrough because of its relevance in the daily lives of many people, families and companies. In the current days, it is estimated that the internet has more than 3 billion users worldwide1.
Despite its many benefits, the internet has also been associated with the emergence of a phenomenon, which is still not set in the main diagnostic classification systems of Psychiatry. This phenomenon is known as “internet addiction” (IA) or Problematic Internet Use (PIU) and has been receiving a special attention from the academic community owing to the access availability to its high prevalence rates and to its negative consequences.
The PIU has been defined as a pattern of the internet mal-adaptive use, characterized by the excessive usage, which
leads to organic, psychosocial and behavioral losses2. Its
prevalence rates vary between 0.3% and 37.9%3. This variation
may be justified by the difference found in the instruments
that are used to measure the problem2, which reflect distinct
theories, sampling characteristics, psychometric fragilities of the used psychometric scales.
To account how the prevalence rates vary according to the instrument used showed the case of the Asian countries. These countries consider that the PIU is a public health problem which affects mainly students, a study was proposed to estimate the prevalence of the disorder in six countries of the continent (China, Hong Kong, Japan, South Korea, Malaysia and Philippines), with 5366 adolescents between 12-18 years old. The study used two instruments to verify the prevalence rates: Internet Addiction Test (IAT) and Chinese Internet Addiction Scale (CIAS). Another highlight is the disparity between prevalence rates depending on the instrument. Considering CIAS the prevalence of PIU reaches six-fold in Malaysian adolescents4.
This variation is also a consequence of the various evaluation tools fa PIU. The literature counts, between 1995 and 2013, around 45 instruments were developed in 23
languages to measure the PIU2.
The main theoretical basis of the instruments are the addiction models and the impulse control disorders. Thus, most instruments are adaptations, without any kind of concerns
related to psychometric5 or to the diagnosis criteria found in
the Substance Use and Pathological Game of the Diagnostic and Statistical Manual of Mental Disorders, 4th (DSM-IV).
The IAT is the more used instrument among the researchers and the media in general, to evaluate this kind of problem. It was translated to 18 languages and validated in
31 studies2. The PIU prevalence verified in studies that have
used this instrument has varied between 2.6% and 10.9%6.
Despite being an extensively used instrument, the IAT is
also the most criticized one7. The arguments report that a
solid constructed theoretical perspective is lacking to make
an evaluation of the PIU8. Similarly, fragile evidences are
found in the construct validity2,9,10 and the content validity
of some items is considered outdated or even vague9,11.
In this sense, the necessity of an instrument that has its own theoretical model – with closely tested psychometric qualities – is, hence, justified.
On the other hand, six instruments were created from a model that was exclusively developed to explain the maintenance and the etiology of the PIU maladaptive behavior2,12.
The main representative of this model for the PIU is the
Online Cognition Scale (OCS)13. It was translated into six
languages2, including Portuguese14 and with psychometric
qualities that were verified in five studies13,15-18. Differently
from IAT, the OCS is the operationalization of a specific
theoretical model for the PIU13 and it has clear evidences of
construct validity2.
The OCS has theoretical assumptions derived from cognitive behavioral model. This, in turn, tries to explain how maladaptive cognitions about the internet use (distorted thoughts) are a proximal and sufficient cause for the etiology and maintenance of PIU. Therefore, it suggests that the cognitive symptoms of PIU may precede and cause the affective and/or behavioral symptoms associated with the disorder. The OCS fulfills the requirement of having a strong theoretical assumption, consisting of the operationalization
as a measure of the cognitive behavioral model for the PIU13.
The instrument has 36 items organized in four sub-scales (loneliness/depression, impulse control decrease, social comfort and distraction) and has presented construct,
convergent and factorial validities12. However, there was
no differential validity between the sub-scales loneliness/
depression, impulse control decrease and social comfort17.
The instrument reliability estimated by the Cronbach’s Alpha varies between 0.85 and 0.9413,15-17.
The potentialities presented by the OCS contribute to an understanding of the PIU etiology and maintenance. In this way, this instrument must have its psychometric qualities studied to guarantee a valid and transculturally accepted instrument. It is important to emphasize that, because of the lack of instrument to measure the validated PIU for the Brazilian population, the current study aimed to verify the construct validity and the reliability of the Portuguese Version of the Online Cognition Scale (OCS-BR).
METHODS
Participants
Sciences and Physical Education) who study at Instituto de Ciências Biológicas of the Universidade de Pernambuco
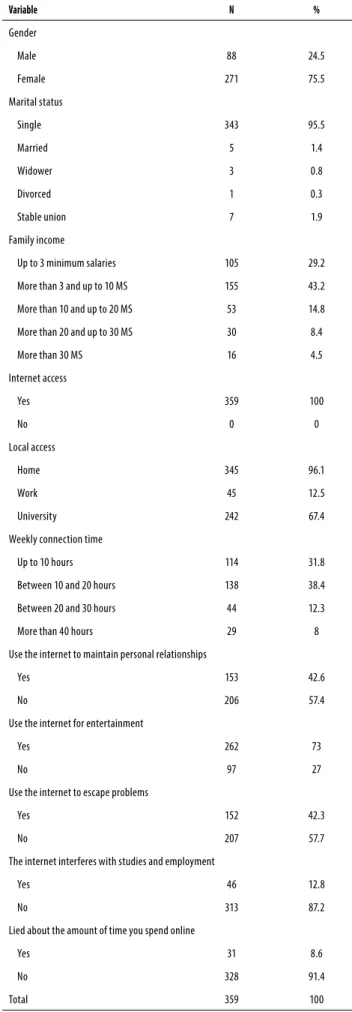
(ICB/UPE) participated in this research. The used sampling method was ‘at convenience’ sampling and students from the first to the last year of the various courses were included. The sufficient quantitative number of students for the study was determined by the minimum sample size required for the Confirmatory Factor Analysis (CFA) to generate robust results, that is, in the proportion of ten individuals for each item of the instrument. The students who were included in the study were duly enrolled in health under graduation courses, aged ≥ 18 years of age, without cognitive impairment that would impair the completion of the instrument. Students who did not agree to participate in the study were excluded, also the ones who did not sign the Consent Form or that inadequately filled out the instruments. Twenty-three individuals were excluded from the sample due to their inadequate filling of the form related to data collection. In the end, there was a sample of 359 students, composed by 271 (75.5%) women – with an average age of 19.49 years old (DP = 2.33). It was observed that 100% of the sample had access to the internet.
Instruments
Three instruments were used for the data collection: a questionnaire regarded to the social demography and internet use habits; the Portuguese (Brazil) versions of the Online Cognition Scale (OCS-BR) and the Internet Addiction Test (IAT-BR).
The questionnaire regarded to the social demographic characterization and internet use habits was composed by questions related to gender, age, course, budget, marital status, internet access, weekly internet use, usage motivations, tools/apps used and daily negative repercussions of the internet use.
The Portuguese Version of the OCS was used. This version was translated to the Brazilian population by Silva et al.14. It
is a self-applied instrument composed by 36 items that are answered in a Likert scale, with a score that varies from one (totally disagree) to seven points (totally agree). The score ranges between 36 to 252 points and it is directly related to the PIU level. The cutoff to establish PIU varies according to the sex of the individual, for males values ≥ 92 and for
females ≥ 78 demonstrate PIU19.
The Portuguese Version of the IAT was also applied. It is a scale composed by 20 items of self-filling questions with answers that are given in a Likert Scale of five points. The total score may vary from zero to one hundred points. The higher is the obtained score, the higher is the addiction severity. The ones who have got a score ≥ 31 points are considered internet addicted20.
Procedures
The data collection happened during the class period, between the months of April and June of 2013, according to the authorization which was given by both the institution and the professors. The instruments were applied after a brief explanation about its filling and the signature of the Consent Form. Then, the instruments were distributed and applied in all present that agreed in participating. Moreover, the time that the participants spent to fill in the forms was also measured, and it has presented an average of 15 minutes.
The test-rest technique was chosen to verify the OCS-BR time-stability. In this way, in every five initial interviews, one individual was invited to be part of another interview, that what happened 15 days after the first one. That was the followed procedure until, at least 20% of the initial sample could be reached. In the end, 72 individuals went to the second interview.
Data analysis
The analysis of the OCS-BR psychometric qualities was
done according to the guideline suggested by Hair et al.21
and Marôco22. The conjectures related to the reliability and
construct validity were both verified.
The reliability evaluation involved an estimation of the internal consistence, Cronbach’s Alpha, that must vary to
being adequate between 0.8-0.923. The instrument
time-stability was verified through the intraclass correlation
coefficient (ICC) which must present scores ≥ 0.724. The
discriminating power of item regarded to differentiate themselves was verified through the items total correlation coefficient and the point-biserial correlation; both must be ≥ 0.3 (item-total correlation)25.
The evidence of the construct validity was analyzed through the CFA. This is considered an efficient method to test the first one. The construct validity is understood as the degree in which a group of manifest variables reflect
the latent theoretical construct that it wants to measure21.
The CFA is the more indicated method to investigate the construct validity through the factorial and convergent validities.
Before being performed, it was verified the presence of multivariate outliers and the conjecture of the multivariate and univariate normalities. These were analyzed through
the Squared Mahalanobis Distance (D2) and the Degree of
Freedom (df). The individuals who presented a relation ≥ 3
were considered the outliers21. The conjecture of the uni and
multivariate normalities were done through the Skewness (Sk) and Kurtosis (Ku) coefficients and the indicators of |Sk| ≥ 3 and |Ku| ≥ 10 were considered a violation of the assumptions
of normality22,26. The Maximum Likelihood Method was used
to estimate the goodness of fit of the model.
following scores: Χ2/df: [1; 2]; GFI: ≥ 0.95; Comparative Fit
Index (CFI): ≥ 0.95; Root Mean Square Error of Approximation (RMSEA): ≤ 0.0721,22.
The factorial validity is reached when the items specification of a determined latent construct has a satisfactory goodness of fit quality. This kind of validity is verified through the patterned factor loads (λ2). There will be
factorial validity when all the manifest variables present λ2 ≥
0.2522.
The convergent validity consists in a degree in which the manifest variables share or converge to an elevated variance
proportion that is common to the latent construct19. To
present a convergent validity, a model must have its factor loads (λ) ≥ 0.5 and significant (p < 0.05)21, Average Variance
Extracted (AVE) ≥ 0.5 and the Construct Reliability (CR) ≥ 0.721,27. For this same purpose, the Spearman correlation
coefficient between OCS-BR and IAT-BR was also verified. The analyses of the descriptive statistic, bivariate and reliability were done through the statistic software SPSS v. 20 and the CFA through the SPSS AMOS v.20. The point-biserial correlations were verified through the Winsteps software.
This study followed Resolution 196/1996 of the National Health Council for research on human beings. All participants signed a Consent Form. The present study was approved by the Ethics and Research Committee of the Federal University of São Paulo (Unifesp), CAAE number: 10900712.0.0000.5505 and opinion No. 173.337/12.
RESULTS
The demographic and internet usage characteristics are presented in Table 1.
To initially meet the study objectives, a CFA was done, testing the OCS-BR factorial structure for the sample that was
being studied, according to what was proposed by Daviset
al.13 (Figure 1).
As stated in the CFA results, the model has revealed the
following quality indicators: χ2/df = 1.759 (p = 0.171), GFI =
0.99, CFI = 0.99, RMSEA = 0.04 and ECVI = 0.05. Neither the presence of outliers nor the existence of violation of the normal distribution assumptions were verified. The λ were all above 0.5 and statistically significant (p < 0.001). The CR was 0.85 and the AVE was 0.59. The manifest variables presented an Explained Variance (EV) that has varied between 0.44 and 0.72. The EV of each variable was: distraction EV = 0.44, social comfort EV = 0.50, loneliness/depression EV = 0.68 and impulse control decrease EV = 0.72. The model presents goodness of fit indexes that revealed a very good adequation of the OCS-BR factorial structure, showing clear evidences of factorial and convergent validities, in other words, construct validity.
Table 1. Frequency of demographic and internet use variables
Variable N %
Gender
Male 88 24.5
Female 271 75.5
Marital status
Single 343 95.5
Married 5 1.4
Widower 3 0.8
Divorced 1 0.3
Stable union 7 1.9
Family income
Up to 3 minimum salaries 105 29.2
More than 3 and up to 10 MS 155 43.2
More than 10 and up to 20 MS 53 14.8
More than 20 and up to 30 MS 30 8.4
More than 30 MS 16 4.5
Internet access
Yes 359 100
No 0 0
Local access
Home 345 96.1
Work 45 12.5
University 242 67.4
Weekly connection time
Up to 10 hours 114 31.8
Between 10 and 20 hours 138 38.4
Between 20 and 30 hours 44 12.3
More than 40 hours 29 8
Use the internet to maintain personal relationships
Yes 153 42.6
No 206 57.4
Use the internet for entertainment
Yes 262 73
No 97 27
Use the internet to escape problems
Yes 152 42.3
No 207 57.7
The internet interferes with studies and employment
Yes 46 12.8
No 313 87.2
Lied about the amount of time you spend online
Yes 31 8.6
No 328 91.4
Problematic Internet Use
Social Comfort e1
0.51
0.71
0.83
0.85
0.67
0.69
0.73
0.45
e2
e3
e4 Diminished Impulse Control
Loneliness – Depression
Distraction
Figure 1. Confirmatory Factor Analysis (CFA) of the four OCS dimensions as indicators of the Problematic Internet Use (PIU) constructs.
Since the results have shown a good coherence of the factorial model thought by Davis et al.13, the reliability
indicators and the items discrimination coefficient were estimated for the group of items and for each one of the sub-scales that have been shown in the cited model.
The internal consistency was analyzed through the Cronbach’s Alpha Coefficient and it has displayed satisfactory scores, the instrument as a whole (0.91) and for the 4 sub-scales: social comfort (0.77); loneliness/depression (0.73); impulsiveness (0.81); and distraction (0.77).
The analysis of the items discrimination coefficient demonstrated that the item-total correlation in the first analysis ranged between 0.281 and 0.525 for the sub-scale social comfort, between 0.293 and 0.652 for the impulse
control decrease, 0.230 and 0.603 for loneliness/depression and 0.356 and 0.659 for distraction. The point-biserial correlation has satisfactorily varied in all sub-scales with at least 0.300 and at most 0.750. The items 5, 18 and 24 (Table 2) presented a item-total correlation < 0.3 (Table 3).
After the withdrawal of the items with a low-discriminating power, the total correlation of the items varied between 0.311 and 0.650, the point-biserial correlation ranged between 0.300 and 0.760, the four sub-scales presented scores that were considered satisfactory. After the items withdrawal, an increment in the Cronbach’s Alpha of the four sub-scales was verified, though there was no variation in the instrument internal consistency as a whole; for it has remained with a Cronbach’s Alpha of 0.91 (Table 3).
Table 2. Items with discriminative power of the unsatisfactory items
Itens Portuguese version English version
5 Eu posso ser eu mesmo(a) online I can be myself online
18 Eu nunca ico online por mais tempo do que eu havia planejado I never stay on longer than I have planned
24 Poucas pessoas gostam de mim além daquelas que eu conheço online Few people like me but the ones who I meet online
Table 3. Item-total correlation and biserial-point correlation of the OCS-BR four sub-scales
Analysis 1* Analysis 2
CITC PBC CAID CITC PBC CAID
Social comfort
Cronbach α = 0.77 Cronbach α = 0.78
Item 1 0.525 0.580 0.752 0.529 0.620 0.376
Item 2 0.432 0.440 0.763 0.456 0.460 0.305
Item 3 0.374 0.390 0.768 0.370 0.410 0.211
Item 4 0.489 0.580 0.757 0.470 0.610 0.292
Item 5 0.281 0.530 0.783 *** *** ***
Item 6 0.517 0.450 0.755 0.538 0.470 0.337
item 7 0.376 0.470 0.771 0.338 0.470 0.164
Item 8 0.312 0.320 0.773 0.311 0.330 0.200
Item 9 0.505 0.440 0.760 0.520 0.450 0.314
Item 10 0.503 0.450 0.758 0.503 0.450 0.290
Item 11 0.355 0.300 0.773 0.370 0.300 0.243
Item 12 0.418 0.440 0.764 0.431 0.460 0.232
Item 13 0.361 0.410 0.769 0.371 0.430 0.178
Analysis 1* Analysis 2
CITC PBC CAID CITC PBC CAID
Impulse control decrease
Cronbach α = 0.81 Cronbach α = 0.82
Item 14 0.545 0.610 0.796 0.549 0.640 0.805
Item 15 0.455 0.520 0.806 0.475 0.560 0.814
Item 16 0.652 0.690 0.782 0.629 0.710 0.795
Item 17 0.563 0.580 0.794 0.562 0.580 0.804
Item 18 0.293 0.510 0.826 *** *** ***
Item 19 0.531 0.540 0.798 0.539 0.550 0.807
Item 20 0.300 0.340 0.818 0.315 0.350 0.828
Item 21 0.418 0.390 0.812 0.425 0.370 0.821
Item 22 0.646 0.630 0.783 0.650 0.630 0.792
Item 23 0.629 0.580 0.788 0.630 0.560 0.797
Loneliness/Depression
Cronbach α = 0.73 Cronbach α = 0.75
Item 24 0.230 0.300 0.753 *** *** ***
Item 25 0.529 0.630 0.684 0.515 00.63 0.710
Item 26 0.603 0.710 0.659 0.619 0.720 0.669
Item 27 0.578 0.750 0.669 0.590 0.760 0.682
Item 28 0.553 0.610 0.679 0.550 0.620 0.700
Item 29 0.347 0.490 0.737 0.334 0.500 0.771
Distraction
Cronbach α = 0.77
Item 30 0.356 0.440 0.773
Item 31 0.421 0.730 0.763
Item 32 0.398 0.540 0.771
Item 33 0.484 0.510 0.751
Item 34 0.659 0.630 0.712
Item 35 0.543 0.580 0.738
Item 36 0.646 0.630 0.715
Cronbach α of the instrument = 0.91 Cronbach α of the instrument = 0.91
* Applied in all instrument. ***Item withdrawn due to low-discriminant power. CITC: corrected item-total correlation; PBC: point biserial correlation; CAID: Cronbach’s alpha if item deleted.
Considering that the items removal did not result in any improvement of the product internal consistency and the fact that the point-biserial correlations have been adequate since the first analysis, the instruments items maintenance is used for the discussion and in their respective sub-scales.
For the time-stability, a high concordance degree between the test-retest was found with an ICC of 0.91. These
findings demonstrate that the OCS-BR has a good time-stability.
The Table 4 presents the Spearman Correlation Coefficients (ρ) among the four OCS-BR sub-scales. The correlations ranged between 0.54 and 0.68, and all of them were statistically significant (p < 0.001). The correlation between studied versions of the IAT-BR and the OCS-BR was ρ = 0.722.
Table 4. Factor Correlation of the OCS-BR instrument
Number of Items Social comfort Diminished impulse control Loneliness/Depression Distraction
Spearman’s rho Social comfort 13 1.000 0.581** 0.571** 0.546**
Diminished Impulse control 10 0.581** 1.000 0.689** 0.597***
Loneliness/Depression 6 0.571** 0.689** 1.000 0.549**
Distraction 7 0.546** 0.597** 0.549** 1.000
DISCUSSION
This study aimed to verify the construct validity and the reliability indicators of the Online Cognition Scale in the Portuguese (Brazil) version. The instrument showed satisfactory factorial and convergent indicators enough evidences of construct validity, besides adequate reliability indexes.
The CFA model13 has perfectly fit in the studied
population. In this way, the manifest variables are gathered aiming to measure the construct PIU. This is just a possible theoretical model to explain the phenomenon, thus, the existence of other models with many complexities is, hence, acceptable.
A model must not only present an acceptable goodness of fit, but also it must demonstrate construct validity evidences. This can be understood as the fact that a group of manifest variables can really reflect the latent theoretical construct that they want to measure. For that purpose, the CFA is an efficient method to analyze the construct at
this level21. The construct validity has three components:
factorial, convergent and discriminative validities22. The last
one was not applied to the studied model, once we are facing a unidimensional factorial model, with only one latent construct. This study emphasized exclusively the verification of the construct validity through the factorial and convergent validities.
The factorial validity happens when the items specification of a determined latent construct has a satisfactory goodness of fit and the patterned factor loads
are significant and higher than 0.2522. The factorial validity
found in this study was like the one that was found by Davis
et al.13, presenting factor loads that were significant and
patterned and that have ranged between 0.51 and 0.81. In both cases the goodness of fit may have been influenced by the reduction of the quantity of items, since the 36 items of the instrument were transformed in four manifest variables to compose the model. These variables are also known here as sub-scales (impulse control decrease; loneliness/depression; distraction; social comfort). That
was done through a method that is known as parceling,
which has the potential to enhance the goodness of fit of the model. This happens when the model complexity is reduced. This simplification is desirable because models that have a smaller quantity of variables are more likely to present a favorable goodness of fit21.
The convergent validity consists in a degree in which the manifest variables share or converge to an elevated variance proportion that is common to the latent construct. The confirmatory factor analysis allows the verification of this type of validity through the AVE, the CR and also the EV analysis21.
The AVE is the average percentage of the explained
variance of the items21, in other words, it is a summarized
indicator of the convergence. The latent constructs must present AVE > 0.5. An AVE that is below the recommended score indicates that, generally, there are more mistakes in the items that were caused by the explained variance than the ones motivated by the factorial structure. This study has found AVE = 0.59, which is a result that is slightly below of what was possible to calculate from the factor loads that were presented in the CFA original work, in which AVE = 0.6713.
Another convergent validity indicator is the construct reliability, which is considered a measure of internal consistency. Different from the Cronbach’s Alpha, it is not influenced by its quantity of items and its calculation takes into consideration the measure error, that is the degree in which the manifest variable is not explained by the latent construct. Therefore, when the CFA is used, this measure is more reliable than the Cronbach’s Alpha.
In this study, we have found for RC = 0.85, a score that was closer to the one that was possible to be calculated in study of Davis et al.13, in which RC = 0.89. However, the cited study
didn’t present scores for the RC and for the AVE. A hypothesis to explain why these indicators were not frequently showed in studies is that they are not calculated by the updated statistic software.
The squared factor loads are called explained variance21,
that represents how the amount of variation presented by a manifest variable can be explained by the latent construct. This study has found that the explained variance for the manifest variables ranges between 0.44 and 0.72, and those were the lowest scores found for the variable distraction and the highest for the impulse control decrease. For the in study of Davis et al.13, the scores changed between 0.51 and 0.81, and
the lowest and the highest scores found were like as our study.
Van Rooij and Prause28 state that the items related to the
impulse control decrease, generally, have a low proportion of
explained variance. Widyanto et al.29 found that the impulse
control decrease was responsible for 6% of the explained variance, opposite to, for example, the prominence shown by the 35% of explained variance. In another study, this
dimension was not a good predictor for the PIU30.
A possible explanation for the OCS elevated explained variance for the variable impulse control decrease –
differently from what was found by Van Rooij and Prause28
and Widyanto et al.29 – is the theoretical model behind
the instrument. The OCS is the operationalization of the cognitive behavioral theory for the PIU, a specific theory and that considers the psychopathological processes as causes which induce the issue that are necessary for the occurrence
and maintenance of the excessive internet use12.
control mechanisms31. A study with 18 adolescents with PIU
has verified a volume reduction of the gray matter in the dorsolateral prefrontal cortex, in the orbito-frontal cortex and
of the supplementary motor area32. The authors concluded
that these alterations may be associated with the cognition losses related to the inhibitory control. Such modifications are also noticed in other addictive disorders like chemical
dependence and pathological game33.
Indeed, the cognitive distortions related to the inhibitory control have an essential role in the etiology and maintenance of the problematic internet use behavior for the OCS and the behavioral cognitive model. In the PIU behavioral cognitive model, this dimension involves obsessive thoughts about the internet and the persistent inability to reduce its use, despite
the will to do it13. In this point of view, the main diagnoses
criteria proposed for the PIU cover this dimension34-39, which
supports this aspect maintenance in screening tools of individuals with problematic internet use.
Another distinction is given to the manifest variable loneliness/depression, which has presented an explained variance of 0.68. Studies involving psychiatric comorbidities and the PIU have verified a significant and positive
association between depression and the PIU. Carli et al.40
verified that 75% of the individuals who were classified with PIU had depression.
A meta-analysis leaded by Ho et al.41 evaluated
the association between the PIU and the psychiatric comorbidities. Eight studies have fulfilled the inclusion criteria. The studies analyzed 12,851 individuals, among them 1,641 were classified with PIU. The analyses verified a positive and significant association between the PIU and the depression (OR = 2,77). In the cited study, the depression was the most prominent disorder among the individuals with PIU with a rate of 26.3%. Until now, the temporal relation between these disorders is not established yet. Only
one longitudinal study was done by Ko et al.42. The authors
have evaluated 2,293 taiwanese students with a regular age of 12.36 years old. In the first evaluation, 233 (10.8%) were identified with PIU, through the Chen Internet Addiction Scale (CHEN). There was a follow up with these students that lasted for two years, when they were reevaluated in the following six, twelve and twenty-four months. The study has found out that depression (OR = 1.56) was a predictor variable for the PIU during the investigation.
In this way, it is suggested that depression and the PIU may have a common psychopatological mechanism. Albeit, other longitudinal studies must be done to ensure which of these disorders occurs first. In the theoretical point of view, Davis et
al.12 suggest that the depression as an etiological mechanism
that may precede the PIU; so, it constitutes itself as condition to cause the issue that is necessary for the PIU appearance.
The OCS-BR has shown itself as a reliable instrument. The internal consistency revealed that the instrument as
whole has a Cronbach’s Alpha of 0.91. All the other studies involving the internal consistency analysis of the OCS have presented closer scores, that have ranged between 0.85 and 0.94. It is possible to conclude that, despite the cultural differences, the OCS items are gathered to measure the PIU construct; although the quantity of items contribute to the adequacy of this estimate. However, we highlight that the OCS reduced version (10 items) has also presented the same score of internal consistency18.
The OCS-BR sub-scales presented a Cronbach’s Alpha that have varied between 0.73 and 0.81. In study of Davis
et al.13, these scores ranged between 0.77 and 0.87. In both
studies, the scores were closer and have shown themselves as adequate. In other words, the items are consistently gathered to measure each one of the sub-scales: distraction, loneliness/depression, impulsiveness and social comfort.
The OCS-BR has demonstrated an elevated time-stability after 15 days, presenting an ICC of 0.91. The validation test
regarded to the OCS (that was applied in Turkish students)15,
has verified the time-stability of this scale with an interval of four weeks between the test and the retest, and it has found an ICC of 0.90. This result is, hence, very close to the one found in this study, even with the time difference for the test-retest.
The OCS-BR sub-scales have shown correlation values between 0.54 and 0.68, suggesting none superposition between the sub-scales once, in psychometric terms, they seem to have different measures. Some authors consider this as a discriminant validity evidence18,43. Correlation values
above 0.7 are problematic for the discriminant validity. This fact has occurred in study of Davis et al.13 among the scales
loneliness/depression, impulse control decrease and social comfort. This lacking of the discriminant validity among the sub-scales has suggest a new factorial structure with three
factors and two sub-scales (dependence and distraction)18.
But, our results demonstrate an independence among the sub-scales. So, the factorial model maintenance – which was previously suggested by Davis et al.13 – is still recommended.
The OCS-BR presented a correlation of 0.722 with the IAT-BR. This kind of correlation between new instruments and a largely used test – like it is the case between the OCS and the IAT – is a proof that they can measure, nearly, the same construct44.
The items 5, 18 and 24 presented a total items correlation below 0.3. Some authors consider this an indicator of a low-discriminating power of the items, which can exclude these items from the discussion. However, this elimination didn’t bring any negative influences to the whole internal consistency of the instrument. The point-biserial correlation – another discriminating power indicator of the item – was also adequate.
Furthermore, both the original study and the semantic
equivalence of the OCS-BR13,14, have verified a good
be considered: (1) these items inadequacy might have happened due to some cultural factors in the studied sample; (2) The OCS was developed 12 years ago and the internet has been evolving rapidly in the last years, which makes necessary to make a regular review of these items owing to the fact that the internet evolution must be accompanied. It might be necessary to make a readjustment of these items, as well as to reevaluate them in their content validity. Therefore, we suggest that studies of validation based on the Item Response Theory (IRT) must be done. This theory aims to verify the singly item validation within the model. By now, there are enough arguments to keep these items maintenance.
Though the results of our study can be considered satisfactory, some limitations must be highlighted. The sample was restricted because it was convenient to do it, and that has created a result generalization for the population. Another fact is that, both this study and the study of Davis
et al.12 were done within college students, thus, the OCS
usage in other populations and/or group age deserves precaution. Studies with other populations must be done to guarantee a safe application in clinic and research scenarios. Another aspect is related to the absence of a cut-off point to determine the problematic internet use. Studies that aim to establish a cut-off point, the specificity and sensitiveness indexes of the OCS are strongly recommended by us.
CONCLUSION
The OCS-BR has presented sufficient evidences of construct validity, which suggests that its items are gathered to measure the Problematic Internet Use. Moreover, it has shown itself as a reliable instrument, displaying levels of internal consistency and stability in satisfactory timing. Being the validated instrument to be used in populations of the Brazilian university students; yet for the application in other populations and in clinical settings, caution is necessary. We suggest other studies in order to validate the OCS-BR in the general population.
INDIVIDUAL CONTRIBUTIONS
Hugo Rafael de Souza e Silva – Contributed to the
conception, the design, analysis and interpretation of the data, writing of the article and final approval of the version to be published.
Kelsy Catherina Nema Areco – Contributed to the
analysis and interpretation of the data, relevant critical review of the intellectual content and final approval of the version to be published.
Paulo Bandiera-Paiva – Contributed to the analysis
and interpretation of the data, relevant critical review of the
intellectual content and final approval of the version to be published.
Pauliana Valéria Machado Galvão – Contributed to
the analysis and interpretation of the data, relevant critical review of the intellectual content and final approval of the version to be published.
Analia Nusya de Medeiros Garcia – Collaborated in
the conception and design, relevant critical revision of the intellectual content and final approval of the version to be published.
Dartiu Xavier da Silveira – Contributes to the
conception, design, analysis and interpretation of the data, writing of the article and final approval of the version to be published.
CONFLICTS OF INTEREST
The authors Hugo Rafael de Souza e Silva, Dartiu Xavier da Silveira, Kelsy Catherina Nema Areco, Paulo Bandiera-Paiva and Anália Nusya de Medeiros Garcia declare that there is no conflict of interest in relation to this article. The author Pauliana Valéria Machado Galvão declares receiving doctoral scholarship from the Coordination of Improvement of Higher Education Personnel (Capes/Ministry of Education), with a doctorate in Epidemiology of Public Health, Sérgio Arouca National School of Public Health, Oswaldo Cruz Foundation.
ACKNOWLEDGMENTS
No acknowledgment.
REFERENCES
1. International Telecommunication Union. ICT Facts and Figures. Geneva: ITU; 2014.
2. Laconi S, Rodgers RF, Chabrol H. The measurement of internet addiction: A critical review of existing scales and their psychometrics properties. Comput Human Behav. 2014;41:190-202.
3. Pezoa-Jares RE, Espinoza-Luna IL, Vasquez-Medina JA. Internet Addiction: A Review. J Addict Res Ther. 2012;S6:1-10.
4. Mak KK, Lai CM, Watanabe H, Kim DI, Bahar N, Ramos M, et al. Epidemiology of internet behaviors and addiction among adolescents in six Asian countries. Cyberpsychol Behav Soc Netw. 2014;17(11):720-8.
5. Berner JE, Santander TJ. Abuso y dependencia de internet: la epidemia y su controversia. Rev. Chil Neuro-Psiquiatr. 2012;50:181-90.
6. Cheng C, Li AY. Internet addiction prevalence and quality of (real) life: a meta-analysis of 31 nations across seven world regions. Cyberpsychol Behav Soc Netw. 2014;17(12):755-60.
7. Demetrovics Z, Szeredi B, Rózsa S. The three-factor model of Internet addiction: the development of the Problematic Internet Use Questionnaire. Behav Res Methods. 2008;40(2):563-74.
9. Hinić D. Problems with ‘Internet addiction’ diagnosis and classiication. Psychiatr Danub. 2011;23(2):145-51.
10. Pontes HM, Patrão IM, Griiths MD. Portuguese validation of the Internet Addiction Test: An empirical study. J Behav Addict. 2014;3(2):107-14.
11. Wallace P. Internet addiction disorder and youth: There are growing concerns about compulsive online activity and that this could impede students’ performance and social lives. EMBO Rep. 2014;15(1):12-6.
12. Davis RA. A cognitive-behavioral model of pathological internet use. Comput Human Behav. 2001;17:187-95.
13. Davis RA, Flett GL, Besser A. Validation of a new scale for measuring problematic internet use: implications for pre-employment screening. Cyberpsychol Behav. 2002;5(4):331-45.
14. Silva HR, Areco KC, Bandiera-Paiva P, Galvão PV, Garcia AN, Silveira DX. Avaliação da equivalência semântica da versão em português (Brasil) da Online Cognition Scale. Cad Saude Publica. 2014;30(6):1327-34.
15. Ozcan NK, Buzlu S. An assistive tool in determining problematic internet use: validity and reliability of the Online Cognition Scale in a sample of university students. J Dependence. 2005;6:19-26.
16. Zec G. Faktorska struktura instrumenta Online Cognition Scale I predvidanje patoloskog koristenja internet: Zagreb University, Croatia; 2005.
17. Song J, Yang FC. The usage of Online Cognition Scale in 538 medical undergraduates. Chinese Mental Health Journal. 2007;21:526-30.
18. Jia R, Jia HH. Factorial validity of problematic internet use scales. Comput Human Behav. 2009;25:1335-42.
19. Ozcan NK, Buzlu S. Internet use and its relation with the psychosocial situation for a sample of university students. Cyberpsychol Behav. 2007;10(6):767-72.
20. Conti MA, Jardim AP, Hearst N, Cordás TA, Tavares H, Abreu CN. Avaliação da equivalência semântica e consistência interna de uma versão em português do Internet Addiction Test (IAT). Rev Psiquiatr Clín. 2012;39(3):106-10.
21. Hair JF, Black WC, Babin BJ, Anderson RE, Tathan RL. Multivariate Data Analysis. 6th ed. New York: Bookman; 2009.
22. Marôco J. Análise de Equações Estruturais – Fundamentos Teóricos, Software & Aplicações. 1. ed. Lisboa: Number R; 2010.
23. Streiner DL. Being inconsistent about consistency: when coeicient alpha does and doesn’t matter. J Pers Assess. 2003;80(3):217-22.
24. Shrout PE, Fleiss JL. Intraclass correlations: uses in assessing rater reliability. Psychol Bull. 1979;86(2):420-8.
25. Field A. Descobrindo a estatística usando o SPSS-2: Bookman; 2009.
26. Kline RB. Principles and practice of structural equation modelling. 2th ed. New York: Press G; 2004.
27. Fornell C, Larcker DF. Evaluating Structural Equation Models with Unobserved Variables and Measurement Error. J Mark Res. 1981;18:39-50.
28. Van Rooij AJ, Prause N. A critical review of “Internet addiction” criteria with suggestions for the future. J Behav Addict. 2014;3(4):203-13.
29. Widyanto L, Griiths M, Brunsden V. The Psychometric Properties of the Internet Related Problem Scale: A Pilot Study. Int J Ment Health Addiction. 2008;6:205-13.
30. Widyanto L, Griiths MD, Brunsden V. A psychometric comparison of the Internet Addiction Test, the Internet-Related Problem Scale, and self-diagnosis. Cyberpsychol Behav Soc Netw. 2011;14(3):141-9.
31. Brand M, Young KS, Laier C. Prefrontal control and internet addiction: a theoretical model and review of neuropsychological and neuroimaging indings. Front Hum Neurosci. 2014;8:375.
32. Yuan K, Qin W, Wang G, Zeng F, Zhao L, Yang X, et al. Microstructure abnormalities in adolescents with internet addiction disorder. PLoS One. 2011;6(6):e20708.
33. American Psychiatric Association. DSMTF. Diagnostic and statistical manual of mental disorders: DSM-5. 5th ed. Washington, D.C.: APA; 2013.
34. Young KS. Internet addiction: the emergence of a new clinical disorder. Cyberpsychol Behav. 1996;1:237-44.
35. Beard KW, Wolf EM. Modiication in the proposed diagnostic criteria for Internet addiction. Cyberpsychol Behav. 2001;4(3):377-83.
36. Shapira NA, Lessig MC, Goldsmith TD, Szabo ST, Lazoritz M, Gold MS, et al. Problematic internet use: proposed classiication and diagnostic criteria. Depress Anxiety. 2003;17(4):207-16.
37. Ko CH, Yen JY, Chen CC, Chen SH, Yen CF. Proposed diagnostic criteria of Internet addiction for adolescents. J Nerv Ment Dis. 2005;193(11):728-33.
38. Aboujaoude E, Koran LM, Gamel N, Large MD, Serpe RT. Potential markers for problematic internet use: a telephone survey of 2,513 adults. CNS Spectr. 2006;11(10):750-5.
39. Tao R, Huang X, Wang J, Zhang H, Zhang Y, Li M. Proposed diagnostic criteria for internet addiction. Addiction. 2010;105(3):556-64.
40. Carli V, Durkee T, Wasserman D, Hadlaczky G, Despalins R, Kramarz E, et al. The association between pathological internet use and comorbid psychopathology: a systematic review. Psychopathology. 2013;46(1):1-13.
41. Ho RC, Zhang MW, Tsang TY, Toh AH, Pan F, Lu Y, et al. The association between internet addiction and psychiatric co-morbidity: a meta-analysis. BMC Psychiatry. 2014;14:183.
42. Ko CH, Yen JY, Chen CS, Yeh YC, Yen CF. Predictive values of psychiatric symptoms for internet addiction in adolescents: a 2-year prospective study. Arch Pediatr Adolesc Med. 2009 Oct;163(10):937-43.
43. MacKenzie SB, Podsakof PM, Jarvis CB. The problem of measurement model misspeciication in behavioral and organizational research and some recommended solutions. J Appl Psychol. 2005;90(4):710-30.