ANTHROPOGENIC DISTURBANCES
CETRA, M.1 and PETRERE JR., M.2
1Departamento de Ciências Exatas e Tecnológicas – DCET/UESC, CEP 45650-000, Ilhéus, BA, Brazil 2Departamento de Ecologia, Instituto de Biociências – UNESP, CEP 13506-900, Rio Claro, SP, Brazil Correspondence to: Mauricio Cetra, Departamento de Ciências Exatas e Tecnológicas – DCET/UESC,
Rodovia Ilhéus-Itabuna, Km 16, CEP 45650-000, Ilhéus, BA, Brazil, e-mail: [email protected] Received August 29, 2004 – Accepted October 10, 2004 – Distributed May 31, 2006
(With 3 figures)
ABSTRACT
The Corumbataí river is one of the main tributaries of the right margin of the Piracicaba river, itself a tributary of Tietê river. The Corumbataí is part of the Paraná river basin and is regionally important not only because of its good-quality water but also because the local landscape has unique features. This study aimed to characterize the fish assemblage of the Corumbataí in order to provide background data for evaluating its environmental status. For this purpose, within the Corumbatai river basin 4 of the main rivers were chosen, along which 3 sampling points each were established. Twenty-four samplings were carried out during March-July and September-December 2001. Diversity measures were used to evaluate biotic data. A linear ANCOVA model was used to test the hypothesis of a spatio-temporal variation in the fish assemblage, with species richness as the response variable, river order as the factor, and temperature and the natural logarithm of number of individuals as covariates. This analysis showed a spatio-temporal variation in agreement with various concepts, e.g., the specie-area relationship and the river continuum,
which have been exhaustively discussed in the literature. When compared to those of the other rivers, data from the Ribeirão Claro river showed a different pattern, probably due to human interference, and exemplifying aquatic habitat fragmentation that might have led to isolation of local fish populations.
Keywords: Paraná river basin, Corumbataí river, fish assemblage, species diversity, habitat fragmentation.
RESUMO
A estrutura das assembléias de peixes da bacia do rio Corumbataí, Estado de São Paulo, Brasil: caracterização e perturbações devido à atividade humana
o processo de fragmentação de hábitats aquáticos que podem ter levado a um isolamento das populações locais de peixes.
Palavras-chave: bacia do rio Paraná, rio Corumbataí, assembléia de peixes, diversidade de espécies,
fragmentação de hábitats.
INTRODUCTION
The study of biological assemblages is important not only for answering questions related to theoretical ecology, but also to identify organisms and/or emergent properties pertinent to environmental quality (Magurran, 1988). Such studies could supply background data for monitoring purposes and environmental conservation programs.
In addition, fish assemblages yield plentiful information about the life cycle of several species, food habit diversity, both alloctonous and autoctonous sources of energy, and to identification of species at the top of the food web (Harris, 1995).
Fish assemblage structures may be affected by zoogeographical patterns, local abiotic phenomena, biological attributes of given species, and biotic interactions among those comprising an assemblage (Matthews, 1998). Assemblages are also controlled by intrinsic factors (biological attributes of each species [Angermeier, 1982; Schlosser, 1987]) or, alternatively, by extrinsic factors, e.g., biotic and
abiotic interactions among ecosystems (Marsh-Matthews & (Marsh-Matthews, 2000).
This work focuses on the effects of extrinsic factors on emergent properties of a fish assemblage, with emphasis on spatio-temporal variation and responses of these assemblages to ongoing urbanization and changing land use in the Corumbatai river basin.
MATERIAL AND METHODS
The ca. 1690 km2 Corumbataí river basin
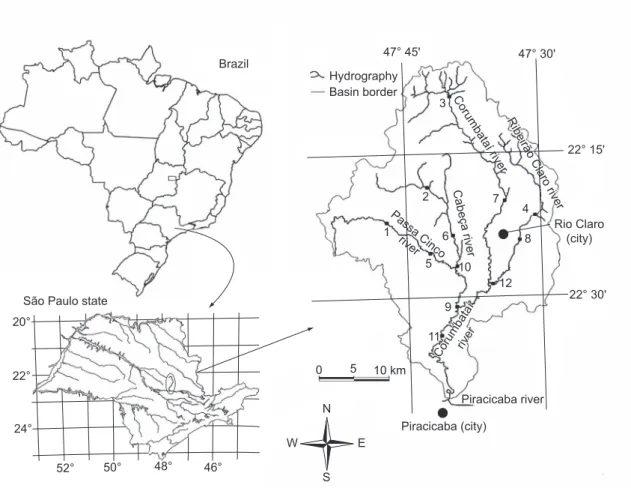
comprises about 13% of the hydrographic basin of the Piracicaba, Jundiaí, and Capivari rivers. The study area is located between 47° 30’ and 47° 50’west and 22° 05’ and 22° 30’ south (Fig. 1).
According to the Köppen classification, regional climate is Cwa, i.e., subtropical, dry in
winter and rainy in summer, with annual mean temperature varying from between 20 and 23.7 °C
in January, and between 14.9 and 17.1 °C in July (ATLAS Ambiental..., 2002). Flow measurements of the basin’s main river the (Corumbataí) reflect this climatic characteristic (Fig. 2).
The study area presents landscape features unusual in the interior of São Paulo, the state having Brazil’s highest industrialization index. In 1996, the basins of the Piracicaba, Jundiaí, and Capivari rivers contributed 18.8% of the gross wealth generated by SP State’s industries. Of the total pollution generated in Corumbataí basin, about 30% derives from industrial activity, while sewage represents ca. 70%. Of the latter, 98% is
collected, of which only 5% is treated.
The water quality of the Piracicaba river basin is presently at a critical state, while those of the Corumbataí river are of good quality. So much so that, despite its location on the margins of the Piracicaba river, the municipality of Piracicaba - through which the high water-volume river runs - obtains 100% of its water supply from the Corumbataí system.
Of the municipalities in the Corumbataí basin, that of Rio Claro - with ca. 163,000 inhabitants,
or 79.5% of the basin’s entire population - is the most important. It was estimated that of total water pollution generated by the municipality, 97% was sanitary sewage, while the remaining 3% was of industrial origin, making Rio Claro the main pollution source in the Corumbataí System (Atlas Ambiental, 2002).
The Ribeirão Claro river presents marked anthropic impacts, e.g., two dams: one - which had
been used in the past for energy generation - in the lower stretch, and the other, in the middle stretch, for water abstraction despite sewage spillage along a roughly 3 km stretch of the river.
By using a map with a scale of 1:50,000, the points were hierarchically classified accordingly to position and order along the channel (see Horton, 1945, and Strahler, 1957, for protocols).
Samplings were carried out with a set of gillnets, with opposite knots and mesh size varying between 3 to 9 cm, and 3 pairs of fish traps. The nets and traps were set by midafternoon (between
São Paulo state 20°
22°
24°
52° 50° 48° 46° Brazil
47° 45' 47° 30'
Rio Claro (city)
Piracicaba river
Piracicaba (city)
Corumbataíriver
Corumbataí river
Cabeça river
Ribeirão Claro river
Hydrography Basin border
Passa Cinco river
3
1
5
9 2
6
10 7
11
4
8
12
22° 30' 22° 15'
0 5 10 km
N
S
W E
Fig. 1 — Geographical location of Corumbataí river basin with 12 sampling units (SUs): 1, 2, 3 (Passa Cinco river); 4, 5, 6
(Cabeça river); 7, 8, 9 (Corumbataí river); 10, 11,12 (Ribeirão Claro river).
0 10 20 30 40 50 60
Jan. Feb. Mar
.
Apr
.
May
.
Jun. Jul. Aug. Sep. Oct. Nov
.
Dec.
Discharge (m
3/s)
15 h and 18 h), and left until the following morning (between 7 h and 9 h). Nets were placed and distributed randomly along the river margins in each sampling point. Pairs of traps were placed in convenient places along the channel.
The physiochemical parameters of the water,
e.g., temperature, turbidity, dissolved oxygen, pH,
and conductivity were measured with a Horiba U-10 water quality checker.
Species were classified according to their food habits, i.e., herbivorous, bentonic,
insectivorous, generalist, omnivorous, piscivorous, and detrictivorous. Species diversity was calculated with the Shannon index (H’ = - Σ pi*lnpi, pi = ni/Σni, i = 1,2,3,…s, where s is the number of species in the sample). The Morisita-Horn similarity coefficient was used to assess the similarity between species composition and between the trophic groups of the basin rivers studied.
The hypothesis of a difference in the spatio-temporal pattern and in the assemblage structure among these rivers was tested by analysis of covariance, in which the dependent variable was the number of species, and factor was the river order with three levels (4, 5, and 6), with temperature and the natural logarithm of number of individuals as covariates.
RESULTS
Along the entire basin of the Corumbataí river, 2474 individuals (with a summed weight approaching 56 kg) belonging to 35 species were caught (Table 2). Twenty-two species (63%) captured were Characiformes and 9 (26%) were Siluriformes. Cyprinodontiformes (2 species, 6%), Perciformes (1 species, 2.5%), and Gymnotiformes (1 species, 2.5%) were also represented. Characidae was the family with the highest number of species (12 species, 34%), followed by Loricariidae
(4 species, 11%), and Anastomidae (3 species, 8.5%).
Bryconamericus stramineus, Astyanax sp., Hypostomus strigaticeps, Astyanax altiparanae, Astyanax fasciatus, Serrapinnus notomelas, Astyanax scabripinnis, and Pimelodella gracilis
represented about 80% of the total number of individuals captured. Eighteen small size (L < 15 cm) species were numerically over-represented in the samplings (ca. 75%). Besides
being rare, Corydoras paleatus, Phalloceros caudimaculatus, Oligosarcus paranensis, and Poecilia vivípara were less than 5 cm.
The highest points at Ribeirão Claro (sampling units 4 and 14) showed highest values, while the lower point (sampling units 11 and 24) showed the lowest Shannon diversity index values (Tables 3 and 4).
The fish assemblage of the Passa Cinco and Cabeça rivers showed the highest similarity in species composition when compared to that found in the Corumbataí and Ribeirão Claro (Table 5). The same pattern was observed for trophic classification, even though the fish assemblage of Ribeirão Claro was dissimilar when compared to that of any other river (Table 6).
The number of species caught increased significantly with river order (n = 24; r2 = 0.208; p = 0.025), water temperature (n = 24; r2 = 0.151; p = 0.061), and natural logarithm of the number of individuals (n = 24; r2 = 0.465; p = 0.0002).
Besides its effect on the fishes’ metabolism, the water temperature had a temporal effect because the temperature decreased significantly as the first twelve samplings were carried out (n = 12; r2 = 0.663; p = 0.001), while during the last twelve samplings, temperature increased significantly (n = 12; r2 = 0.634; p = 0.002).
TABLE 1
Hydrographic characteristics of the 4 main rivers of Corumbataí river basin.
Characteristics River
Corumbataí Passa Cinco Ribeirão Claro Cabeça
Basin area (km2) 1710 525 291 211
River length (km) 110 60 43 28
Headstream altitude (m) 1058 1000 720 740
When the natural logarithm of the number of individuals was plotted against species richness for the basin rivers, the expected pattern was not observed for the Ribeirão Claro river, i.e.,
increasing the sample size would be expected to increase the number of species captured. This
exploratory analysis resulted in removal of those data from the ANCOVA.
About 78% of the variability in number of species in the basin can be explained by variation in space, represented as river order; time and physiology, represented by water temperature; and
TABLE 2
Fish species; number of individuals (N); and total length range (L(cm)).
Species N L(cm)
Bryconamericus stramineus Eigenmann, 1908 484 2.7-6.8
Astyanax sp. 437 3.0-8.8
Hypostomus strigaticeps (Regan, 1908) 350 3.5-31.0
Astyanax altiparanae Garutti & Britski, 2000 291 4.2-14.0
Astyanax fasciatus (Cuvier, 1819) 181 5.2-13.2
Serrapinnus notomelas (Eigenmann, 1915) 142 2.8-6.6
Astyanax scabripinnis (Jenyns, 1842) 103 2.5-8.4
Pimelodella gracilis (Valenciennes, 1836) 76 2.4-13.2
Cyphocharax modestus (Fernández-Yépes, 1948) 46 3.2-13.7
Serrapinnus heterodon (Eigenmann, 1915) 46 4.3-5.7
Cyphocharax nagelii (Steindachner, 1881) 43 9.7-14.6
Rhamdia quelen (Quoy & Gaimard, 1824) 40 4.9-29.9
Hypostomus ancistroides (Ihering, 1911) 39 9.5-19.2
Hoplosternum littorale (Hancock, 1828) 37 10.3-29.5
Hoplias malabaricus (Bloch, 1794) 27 11.4-40.9
Geophagus brasiliensis (Quoy & Gaimard, 1824) 20 5.2-23.8
Leporinus friderici friderici (Bloch, 1794) 16 14.6-32.7
Hyphessobrycon eques (Steindachner, 1882) 16 2.9-3.8
Salminus hilarii Valenciennes, 1850 13 18.3-37.2
Characidium zebra Eigenmann, 1909 13 4.7-8.3
Triportheus angulatus (Spix & Agassiz, 1829) 12 18.8-21.8
Schizodon nasutus Kner, 1858 9 18.9-29.2
Leporinus octofasciatus Steindachner, 1915 7 11.9-22.6
Rineloricaria latirostris (Boulenger, 1900) 6 12.0-19.2
Prochilodus lineatus (Valenciennes, 1836) 5 23.0-36.2
Gymnotus carapo Linnaeus, 1758 3 19.8-29.4
Serrasalmus spilopleura Kner, 1858 2 14.8-15.6
Parodon nasus Kner, 1859 2 12.1-12.3
Apareiodon piracicabae (Eigenmann, 1907) 2 11.3-12.6
Pimelodus maculatus Lacèpede, 1803 1 21.6
Hypostomus regani (Ihering, 1905) 1 16.2
Oligosarcus paranensis Menezes & Géry, 1983 1 4.6
Corydoras paleatus (Jenys, 1842) 1 3.7
Poecilia vivipara Bloch & Schneider, 1801 1 4.7
Phalloceros caudimaculatus (Hensel, 1868) 1 4.5
-TABLE 3
Main characteristics of the sampling units (SU) of the Corumbataí river basin in March-June, 2001. PC: Passa Cinco river;PC: Passa Cinco river; CA: Cabeça river; CO: Corumbataí river; RC: Ribeirão Claro river. S: fish species richness; N: number of fish collected;S: fish species richness; N: number of fish collected;
H’: Shannon diversity index; and DO: dissolved oxygen.
SU
1 2 3 4 5 6 7 8 9 10 11 12
River PC CA CO RC PC CA CO RC CA PC RC CO
Stretch high high high high middle middle middle middle low low low low
River order 5 5 4 4 5 5 5 4 5 6 4 6
Altitude (m) 627 613 636 600 565 563 574 571 537 523 563 466
S 12 5 6 9 8 9 9 7 7 4 6 11
N 385 6 34 39 106 63 33 60 130 6 21 62
H’ 2.19 2.25 1.98 2.87 2.34 2.68 2.79 1.83 1.49 1.92 1.34 2.33
Depth (m) 1.07 1.03 1.07 1.40 0.77 1.35 1.53 1.00 1.25 0.88 2.00 1.15
Width (m) 6.2 4.1 9.0 7.2 11.6 17.0 11.9 6.9 13.3 15.3 15.3 35.0
Water velocity (m.s-1) 0.74 0.93 0.78 0.72 1.00 0.61 0.78 0.22 0.52 1.02 0.15 0.47
Temperature (°C) 24.0 26.4 24.6 24.6 24.8 23.0 23.8 18.3 19.8 18.1 19.9 20.8
DO (mg/L) 7.8 10.3 10.3 10.2 10.4 11.2 10.1 9.3 9.2 9.4 5.2 6.9
TABLE 4
Main characteristics of the sampling units (SU) of the Corumbataí river basin in September-December, 2001. PC: PassaPC: Passa Cinco river; CA: Cabeça river; CO: Corumbataí river; RC: Ribeirão Claro river. S: fish species richness;S: fish species richness;
N: number of fish collected; H’: Shannon diversity index; and DO: dissolved oxygen.
SU
13 14 15 16 17 18 19 20 21 22 23 24
River PC RC RC CO CA PC CA CO CA PC CO RC
Stretch high high middle high high middle middle middle low low low low
S 13 10 6 4 4 12 7 10 13 17 12 5
N 375 32 13 16 53 354 53 247 89 122 105 70
H’ 2.58 3.16 2.35 1.53 0.92 1.28 2.22 1.67 3.19 2.84 2.76 1.13
Depth (m) 0.76 1.17 0.75 0.80 0.87 0.67 0.97 1.53 1.25 0.88 1.28 2.30
Width (m) 8.9 3.0 6.9 5.5 4.1 13.3 17.0 11.6 13.3 35 10.0 17.7
Water velocity (m.s-1) 0.40 0.84 0.27 0.57 0.54 0.85 0.37 0.75 0.39 0.67 0.42 0.32
Temperature (°C) 18.1 20.5 21.7 21.2 24.1 25.2 22.7 22.6 26.2 29.7 26.6 24.4
DO (mg/L) 9.17 8.25 7.67 8.69 7.99 9.85 10.86 8.37 7.74 7.31 7.66 6.27
TABLE 5
Morisita-Horn similarity matrix between fish species composition of the Corumbataí river basin. PC: Passa Cinco river;PC: Passa Cinco river; CO: Corumbataí river; RC: Ribeirão Claro river; and CA: Cabeça river.
PC CO RC CA
PC 1.0000 - -
-CO 0.0103 1.0000 -
-RC - 0.0654 0.1618 1.0000
sample size, represented by natural logarithm of the number of individuals (Table 7 and Fig. 3).
DISCUSSION
The samplings carried out at the Corumbataí system are in agreement with the patterns found for
South American ichtyofauna (Schaefer, 1998) and for the upper basin of the Paraná river (Agostinho & Júlio Jr., 1999; Castro & Menezes, 1998), i.e.,
highest contribution of Characiformes, followed by Siluriformes, and a higher contribution (75%) of small individuals (L < 15 cm) for the total sample (Table 2).
TABLE 6
Morisita-Horn similarity index matrix between fish species composition according to their trophic group in the Corumbataí basin rivers. PC: Passa Cinco river; CO: Corumbataí river; RC: Ribeirão Claro river; CA: Cabeça river.PC: Passa Cinco river; CO: Corumbataí river; RC: Ribeirão Claro river; CA: Cabeça river.
PC CO RC CA
PC 1.0000 - -
-CO 0.0329 1.0000 -
-RC - 0.2782 - 0.0223 1.0000
-CA 0.5517 0.2030 - 0.0167 1.0000
TABLE 7
Analysis of covariance table with richness (S) as response variate. Factor: river order (RO); and covariates: water
temperature (WT) and logarithm of number of individuals (lnN)(n = 18; r2 = 0.772).
Source of variation SS df MS F p
RO 36.849 2 18.425 4.441 0.034
WT 21.267 1 21.267 5.126 0.041
lnN 103.851 1 103.851 25.033 0.000
Error 53.931 13 4.149 -
-Fig. 3 — Adjusted mean number of species (S) according to river order calculated through analysis of covariance.
4 5 6
River order 3.0
5.2 7.4 9.6 11.8 14.0
The Ribeirão Claro river showed the highest dispersion of data related to channel depth, probably because the lower stretch (sampling units 11 and 24) in a reservoir. When compared with the other rivers, the Passa Cinco was characterized by low depth-values, i.e., shallow, and the highest
superficial velocity. Because the Corumbataí is the main and the longest river in the basin, the sampling points were more distant from each other, which could explain the great variability observed in channel width. The Ribeirão Claro river showed the highest dispersion for turbidity values, low values for dissolved oxygen, and high values for conductivity. This pattern can be explained by the difference between the low stretch (sampling units 11 and 24), and that of the other two sampling points. This passage of the municipality of Rio Claro. The Passa Cinco river showed the lowest conductivity values, evidencing limpid waters (Tables 1, 3, and 4).
Increase in number of species as the order of the river increases has been observed for other systems (Angermeier & Schlosser, 1989; Osborne & Wiley, 1992), corroborating two main ecological concepts, i.e., the species-area relationship
(MacArthur & Wilson, 1967), as well as the river continuum concept (Vannote et al., 1980).
The temperature has a pervasive effect on organisms, especially in ectotherms such as fishes, since it regulates metabolic process intensities. An increase in metabolism means an increase in the energy needed, which determines the amount of food necessary for an organism to perform work. By the same token, a fish assemblage is also influenced by variations in the temperature, as shown by Magnuson et al. (1979). Besides
representing the emerging properties of the fish assemblage, the water temperature represented its temporal dynamics.
The logarithm of the number of individuals was the variable that best predicted the number of species. This can be viewed either as a consequence of sample size or the effect of so-called “turnover noise”, where the variation in species richness expected in a constant environment would depend on immigration rates due to great mobility of the fish and/or local extinction (Angermeier & Schlosser, 1989).
The model best explaining spatio-temporal variation in the number of species of the Corumbataí
river basin is that containing information about river order, temperature, and number of individuals, excluding the data for the Ribeirão Claro river for reasons previously mentioned.
River systems have many variables that control fish assemblages and, in the present work, adjusting a simple model allowed a good visualization of the multidimensional structure accounting for the spatio-temporal variation in the fish species richness in the Corumbataí river basin. Without the effect of the rivers the ANCOVA analysis explained about 77% of the variability of the number of species in the basin as a function of spatial variation, represented by river order; time and physiology, represented by water temperature; and sample size, represented by the natural logarithm of number of individuals (Table 7).
The fact that the model of spatio-temporal variation previously presented did not fit the Ribeirão Claro river data might be due to the simplicity of the model itself, which could not incorporate a landscape of the complexity of that through which this river runs. Because this model is compatible with continuum river theory, it cannot incorporate anthropic changes in the natural landscape. But a model must take into account the relationships of a river with its surroundings, i.e., the landscape,
which in the present case is composed of patches connecting by corridors allowing contact among these habitats.
As anthropogenic activity fragments natural habitats, the results may have been, in the case of the Ribeirão Claro river, formation of metapopulations and disappearance of other populations that may subsequently reappear due to immigration from adjacent areas.
(Schlosser, 1995), and fit the concepts of Punsey
et al. (2000). However, it must be remembered that
prior to present sewage treatment many species had already been distributed throughout the basin, which is small and presents low heterogeneity. In addition, micro and mesohabitat factors can affect the primary structure, i.e., species abundance, as
is the case with the Ribeirão Claro river, which presently shows a high relative abundance and diversity (Tables 3 and 4).
The present results, although contributing to what is already known about spatio-temporal variation of the fish assemblage of the basin of the Corumbataí river, also were useful in detecting behavioral differences based on the data of the most impacted river of the basin, the Ribeirão Claro, disturbed as it is by sewage spillovers while crossing the municipality of Rio Claro, and by the degree of ichtyofauna isolation in points above the site at which water is abstracted. Unfortunately, the magnitude of this impact is not yet known, nor is it known for how long the fish assemblage can survive local environmental alterations.
REFERENCESREFERENCES
AGOSTINHO, A. A. & JÚLIO JR, H. F., 1999, Peixes da bacia do alto Paraná. In: R. H. L., McConnell, (ed.). Estudos ecológicos de comunidades de peixes tropicais, Edusp. ANGERMEIER, P. L., 1982, Resource seasonality and fish
diets in an Illinois stream. Environmental Biology of Fishes, 4: 251-264.
ANGERMEIER, P. L. & SCHLOSSER, I. J., 1989, Species-area relationships for stream fishes. Ecology, 70: 1450-1462.
ATLAS AMBIENTAL da bacia do rio Corumbataí, 2002, Available in: <http:// www.rc.unesp.br/igce/ ceapla/atlas> (15 May 2002).
CASTRO, R. M. C & MENEZES, N. A., 1998, Estudo diagnóstico da diversidade de peixes do Estado de São Paulo. In: R. M. C., Castro, (ed.), Biodiversidade do Estado de São Paulo, Brasil: síntese do conhecimento ao final do século XX. 6 Vertebrados. WinnerGraph FAPESP.
HARRIS, J. H., 1995, The use of fish in ecological assessments.
Australian Journal of Ecology, 20: 65-80.
HORTON, R .E., 1945, Erosional development of streams and their drainage basins: hydrophysical approach to quantitative morphology. Bull. Geol. Soc. Am., 56: 275-370.
MAC ARTHUR, R. H. & WILSON, E. O., 1967, The Theory of Island Biogeography. Princeton University Press.
MAGNUSON, J. J., CROWDER, L. B., & MEDVICK, P. A., 1979, Temperature as an ecological resource. American Zoologist, 19: 331-43.
MAGURRAN, A. E., 1988, Ecological diversity and its measurement. Croom Helm.
MARSH-MATTHEWS, E. & MATTHEWS, W. J., 2000, Geographic, terrestrial and aquatic factors: which most influence the structure of stream fish assemblages in the Midwestern United States? Ecology of Freshwater Fish 9: 9-21.
MATTHEWS, W. J., 1998, Patterns in freshwater fish ecology. Chapman & Hall.
OSBORNE, L. L. & WILEY, M. J., 1992, Influence of tributary spatial position on the structure of warmwater fish communities. Canadian Journal of Fisheries and Aquatic Sciences, 49: 671-681.
PUNSEY, B. J., KENNARD, M. J., & ARTHINGTON, A. H., 2000, Discharge variability and the development of predictive models relating stream fish assemblage structure to habitat in northeastern Australia. Ecology of Freshwater Fish, 9: 30-50.
SCHAEFER, S. A., 1998, Conflict and Resolution: Impact of New Taxa on Phylogenetic Studies of the Neotropical Cascudinhos (Siluroidei: Loricariidae). In: L. R., Malabarba, R. E., Reis, R. P., Vari, Z. M. S., Lucena and C. A. S., Lucena, (eds.), Phylogeny and Classification of Neotropical Fishes. EDIPUCRS.
SCHLOSSER, I. J., 1995, Critical landscape attributes that influence fish population dynamics in headwater streams.
Hydrobiologia, 78: 71-81.
SCHLOSSER, I. J., 1987, The role of predation in age- and size-related habitat use by stream fishes. Ecology, 78: 651-659.
STRAHLER, A. N., 1957, Quantitative analysis of watershed geomorphology. Trans. Am. Geophys. Union, 38: 913-920.
VANNOTE, R. L., MINSHALL, G. W., CUMMINS, K. W., SEDELL, J. R., & CUSHING, C. E., 1980, The river continuum concept. Canadian Journal of Fisheries and Aquatic Sciences, 37: 130-137.