I N S T I T U T E
Measuring Political Participation in
Southern Europe:
The Varieties of Democracy Approach
Tiago Fernandes, João Cancela,
Michael Coppedge, Sta
ff
an I. Lindberg
and Allen Hicken
Varieties of Democracy (V-Dem) is a new approach to the conceptualization and measurement of democracy. It is co-hosted by the University of Gothenburg and University of Notre Dame. With a V-Dem Institute at University of Gothenburg that comprises almost ten staff members, and a project team across the world with four Principal Investigators, fifteen Project Managers, 30+ Regional Managers, 170 Country Coordinators, Research Assistants, and 2,500 Country Experts, the V-Dem project is one of the largest-ever social science research-oriented data collection programs.
Please address comments and/or queries for information to:
V-Dem Institute
Department of Political Science
University of Gothenburg
Sprängkullsgatan 19, PO Box 711
SE 40530 Gothenburg
Sweden
E-mail: contact@v-dem.net
V-Dem Working Papers are available in electronic format at www.v-dem.net.
Measuring Political Participation in Southern Europe:
The Varieties of Democracy Approach
∗Tiago Fernandes
Assistant Professor of Political Science Nova University of Lisbon
João Cancela PhD Candidate Nova University of Lisbon
Michael Coppedge Professor of Political Science
University of Notre Dame
Staffan I. Lindberg Professor of Political Science
Director, V-Dem Institute University of Gothenburg
Allen Hicken Associate Professor Department of Political Science
University of Michigan
*
Introduction
Most schools of democratic theory consider political participation to have a positive impact in deepening democracy. Political participation makes democracies more accountable and freer, as well as creating more engaged, civic minded and public spirited citizens.It has been observed that in regimes where citizens lack capacity for self-organization and political engagement this contributes to a lower quality of their democratic regimes and institutions.
Moreover, this connection is even more vital in democratizing settings and new democracies, like the Southern European countries of Portugal, Spain, and Greece. Research has shown that in democracies that emerged after a long experience of authoritarianism there will be a lower capacity for mobilization of citizens. Democratic regimes may became established, with the minimal requirements (freedom of the press, civil and political liberties, a functioning party system, free and fair elections), but they will have a lower quality because there will be very weak attachments of citizens to its institutions. After the euphoria of participation during the transition, desencanto (disenchantment, disappointment) settles in, estranging citizen’s from the democratic process. Contrary to older democracies, where political participation tended to grow steadily after the transition and for decades, in new democracies the high levels of participation of the transition give place to very weak levels of participation. Even more troubling, new democracies are also characterized by strong inequalities in participation, which affect especially popular groups and the poor, but also the middle classes (Fernandes, 2012 and 2014).
Scientific research has already identified variations in levels of political participation between countries. For instance, differences in post-state corporatist democracies (Portugal, Spain) seem to be stark, with the latter having higher levels of associational membership. And as mentioned above, there are also major differences between new and old democracies (Fernandes, 2012, 2013, 2014; Fishman, 2010 and 2011). Still, there isn’t a clear cut scientific measure to compare and evaluate patterns of political participation between countries which is accepted both by the academic and the policy-making communities. Academic studies tend to be focused in comparisons between a small number of countries. And contemporary measures of political participation included in major international indices of democracy or development (Freedom House, UNDP, etc) have two major flaws.
projections of the future, problematic. Long time series are essential for policymakers, since shaping and influencing future events implies also a deep understanding of the past.
Moreover, existing indices are quite “insensitive to important gradations” across countries and over time. For instance, in 2004, Freedom House gave same score on Political Rights to countries Bulgaria, Denmark, Israel, Mauritius, Panama, South Africa, Uruguay, and the United States (Coppedge, Gerring, et. al., 2011, p. 249; Lindberg, Coppedge, Gerring, Teorel, et. al. 2014). It is common for samples of countries that have competitive elections (ex: Sweden, Portugal and Slovakia) to receive similar scores (“democratic”), despite obvious differences in many other respects. And even indices where gradations in quality of elections, civil liberties, and other aspects of political participation (Freedom House, Polity) are taken into account, democratic countries tend to rank very close to each other. This suggests that scales are not as fine grained as they could be.
In this paper we try to move beyond these shortcomings. First, we analyse the strengths and limitations of existing indices where political participation is taken as a significant dimension. Secondly, drawing from the Varieties of Democracy project, we propose a new conceptualization of political participation1. Thirdly, we compare the accuracy and rigour of the new V-Dem Indices with other long-established indices (Freedom House, Polity, Vanhanen’s Democratization Index), by using five Southern European countries (France, Greece, Italy, Portugal, and Spain) as test cases.
1.
Existing indices of Participation
In this section we list and evaluate some of the most relevant tools for the measurement of participation. We start by describing the general features and operationalisation of the instrument, then focus on the specific items regarding participation and summarise their main strengths and weaknesses.
1.1. Freedom in the World (Freedom House)
and the CLI range from 1 (free) to 7 (not free) depending on the aggregation of scores attributed to each of its individual indicators. The average of the two indices returns a freedom rating, and Freedom House subsequently clusters countries within 3 groups: “not free”, “partially free”, and “free”. FITW covers virtually the whole world (both countries and disputed territories). Until recently the reports only provided two aggregated scores (PRI and CLI), but beginning in 2006 Freedom House also began to publicize the scores at the subcategory level (4 for civil liberties and 3 for political rights). The scores for each indicator are coded by country experts. In the 2013 edition there were 60 analysts and around 30 advisers involved.
In the subcategory “Political Pluralism and Participation” of the Political Rights Index countries are awarded from 0 (no) to 4 (yes) in each of the following indicators/questions, leading to a score range in the subsection between 0 and 16 (Freedom House, 2014, p. 8):
1) Do the people have the right to organize in different political parties or other competitive political groupings of their choice, and is the system open to the rise and fall of these competing parties or groupings?
2) Are the people’s political choices free from domination by the military, foreign powers, totalitarian parties, religious hierarchies, economic oligarchies, or any other powerful group?
3) Do cultural, ethnic, religious, or other minority groups have full political rights and electoral opportunities?
4) Is there a significant opposition vote and a realistic opportunity for the opposition to increase its support or gain power through elections?
The subcategory “Electoral process” (Political rights index) is the product of 3 questions, thus ranging from 0 to 12. It is composed of the following questions (Freedom House, 2014, p. 6):
1) Is the head of government or other chief national authority elected through free and fair elections? [0 – 4]
2) Are the national legislative representatives elected through free and fair elections? [0 – 4]
Finally, in the subcategory “Associational and Organizational Rights” (Civil Liberties Index) countries are awarded from 0 (no) to 4 (yes) in each of the following indicators/questions, leading to a score range in the subsection between 0 and 16. The questions are as follows (Freedom House, 2014, p. 12):
1) Is there freedom of assembly, demonstration, and open public discussion?
2) “Are there free trade unions and peasant organizations or equivalents, and is there effective collective bargaining? Are there free professional and other private organizations?”
3) Is there freedom for nongovernmental organizations?
One of the main strengths of the Freedom House measurement tools is that they are well established and widely used, covering virtually the whole world. And since Freedom House now also publishes the scores in each of the sub-dimensions, there is greater potential analytical leverage.
However, there are also some downsides to the index. For one, Freedom House measures the attainment of thresholds of freedom, democracy and liberties. Therefore, this tool does not allow refined analyses of nuances across different types of democratic regimes. The index has been criticized for alleged bias against leftist governments (Mainwaring et al., 2001, 53) and a lack of transparency in its coding procedures. In the final analysis it is more effective at distinguishing between “free countries” and “not free countries” than assessing the differences between democratic countries (Coppedge, 2012, 21; Coppedge et al. 2012, 249).
FH is also biased towards an extreme liberal conception of democracy and participation. This is clear in the subcategory “Associational and Organizational Rights”, where questions are all framed under topic of freedom. This creates a not very rigorous conception of the institutional framework regulating associations. For instance, the questions conflate the existence of government control of associations and organizations (there is always some degree of it, even in democracies) and repression (clearly a non-democratic trait). The question about the degree to which electoral laws and frameworks are fair suffers from the same inadequacy. Any electoral system in a democratic regime involves biases and distortions, since it empowers some groups and parties in relation to others. But this does not make the system undemocratic as such.
political groupings of their choice, and is the system open to the rise and fall of these competing parties or groupings?” conflates very different things. One part of the question is more about the conditions of participation, the other about the actual dynamics of party building and success. In addition, some democratic systems are relatively closed to new entrants, but still keep their democratic traits.
2.2. Polity
The original version of the Polity index dates back to 1975 when Ted R. Gurr and Harry Eckstein produced a database of the durability of regimes. One of the major innovations of Polity was taking an historical approach, providing data since 1800. Since its inception Polity has evolved and expanded its scope, assuming its current form (Polity IV) in 2000. It is an index suited for capturing changes over time in the patterns of authority in any given country, and covers different aspects of political life. Polity IV encompasses three different components: Executive Recruitment; Independence of Executive Authority; Political Competition and Opposition. At the highest level of aggregation, Polity IV scores range from -10 to +10 and are the product of four dimensions: competitiveness of political participation (1‐3); competitiveness of executive recruitment (1‐2), openness of executive recruitment (1); constraints on the chief executive (1‐4).
Regarding the general operationalization of the index, each indicator is coded by an expert. Indicators are not necessarily ordinal (e.g. ranking from “authoritarian” to “democratic”), but are afterwards aggregated into ordinal sub-scores used for the attainment of a score in the “Polity2” (-10 +10) scale. Participation is captured by Polity IV through two variables: 1) the regulation of participation (Marshall, Gurr, & Jaggers, 2014, p. 25) and the 2) competitiveness of participation (Marshall et al., 2014, p. 26). From the interaction of values in these two variables different patterns emerge. Ten potential combinations are a priori conceptually determined, ranging from “repressed competition” to “institutionalized open electoral participation”, covering a high number of possible in-between scenarios.
The Regulation of Participation is coded through a five-category scale (Marshall et al., 2014, p. 26):
2) Multiple Identity: There are relatively stable and enduring political groups which
compete for political influence at the national level–parties, regional groups, or ethnic
groups, no necessarily elected–but there are few, recognized overlapping (common)
interests
3) Sectarian: Political demands are characterized by incompatible interests and
intransigent posturing among multiple identity groups and oscillate more or less
regularly between intense factionalism and government favouritism (...)
4) Restricted: Some organized political participation is permitted without intense
factionalism but significant groups, issues, and/or types of conventional participation
are regularly excluded from the political process
5) Regulated: Relatively stable and enduring political groups regularly compete for
political influence and positions with little use of coercion.
The dimension Competitiveness of Participation refers to the extent to which alternative preferences for policy and leadership can be pursued in the political arena. Political competition implies a
significant degree of civil interaction, so polities coded as “Unregulated (1)” on Regulation of
Participation are simply not coded for competitiveness. Competitiveness of participation is
coded on a five-category scale (Marshall et al., 2014, pp. 26–27):
(1) Repressed: No significant oppositional activity is permitted outside the ranks of the
regime and ruling party. (…)
(2) Suppressed: Some organized, political competition occurs outside government,
without serious factionalism; but the regime systematically and sharply limits its form,
extent, or both in ways that exclude substantial groups (20% or more of the adult
population) from participation. (…)
(3) Factional: Polities with parochial or ethnic-based political factions that regularly
compete for political influence in order to promote particularist agendas and favor
group members to the detriment of common, secular, or cross-cutting agendas.
(4) Transitional: Any transitional arrangement from Restricted, Suppressed, or Factional
patterns to fully competitive patterns, or vice versa. (…) Sectarian and secular interest
groups coexist.
(5) Competitive: There are relatively stable and enduring, secular political groups which
groups seldom involves coercion or disruption. Small parties or political groups may be restricted in the Competitive pattern
The Polity index has a few strengths. It features extensive instructions for coders and several reliability tests are performed; it also features a long and uninterrupted time-series of coded cases, from 1800 onwards. However, there is a narrow focus on the institutional side of participation. There is an absence of behavioural/altitudinal data, and the equality of participation is not an issue taken into account. Critical analyses of this index also point to the fact that “scores are clustered around particular values suggesting that the scale is not as sensitive as it purports to be” (Coppedge et al., 2011, p. 249). Although it covers a very long temporal period, it leaves unaddressed countries with fewer than 500,000 inhabitants.
There is also some fuzziness about what the questions purport to measure specifically. For instance, the dimensions of participation mix aspects of state authority over the territory with issues of participation. The questions seem more suited to grasp the degree to which countries have deep territorial conflicts and security problems. Moreover, they do not allow for subtle differentiations between democratic regimes, as all would fall under the rubric “regulated”.
2.3. Economist Intelligence Unit Democracy Index
The Economist Intelligence Unit has published its “Democracy Index” (EIUDI) since 2006, with the latest version published in 2013. According to its authors, “measures of democracy that reflect the state of political freedoms and civil liberties [such as those provided by Freedom House] are not ‘thick’ enough” (Economist Intelligence Unit, 2013, 26). As such, the EIUDI is designed to achieve more in-depth comparisons of the quality of democracy, as well as more general comparisons. As an input it makes use not only of experts’ views but also of public opinion data and levels of turnout.
The score for any given country is the product of the aggregation of 5 categories, comprising a total of 60 indicators (Economist Intelligence Unit, 2013, pp. 29–39):
Each indicator is either binary (0/1) or ternary (0/0.5/1). The aggregation of each category is not
simply an average of its indicators, as there are some caveats regarding the fulfilment of some
critical indicators – e.g. it is a necessary condition to have free and fair elections.
Regarding the dimension of political participation, its values range from 0 to 10, depending on
values of the following indicators/questions (Economist Intelligence Unit, 2013, p. 33):
1) Voter participation/turn-out for national elections: Average turnout since 2000
converted into a three-level response (0/0.5/1). Countries with compulsory vote are
penalised, as the EIUDI explicitly considers this not to be a positive contribution
towards democracy.
2) Do ethnic, religious and other minorities have a reasonable degree of autonomy and
voice in the political process? Expert assessment. Three levels (0/0.5/1)
3) Extent of political participation. Membership of political parties and political
non-governmental organisations: Three-level response (0/0.5/1). Full score 1 if over 7% of
population for either;
4) Citizens’ engagement with politics: Public opinion, preferably from WVS (World
Values Survey). Three-level response (0/0.5/1). Full score if over 60% are interested in
politics;
5) The preparedness of population to take part in lawful demonstrations: Public
opinion data, preferably from WVS. Three-level response (0/0.5/1). Full score if over
40% are willing to attend demonstration;
6) Adult literacy: Three-level response (0/0.5/1). Full score if over 90%; 6) Extent to
which adult population shows an interest in and follows politics in the news: Public
opinion data, preferably from WVS. Three-level response (0/0.5/1). Full score if over
50% follows politics the news daily;
7) The authorities make a serious effort to promote political participation: Expert
assessment, taking into consideration education and other efforts. Three-level response
(0/0.5/1);
8) Women in parliament: Three-level response (0/0.5/1) (Full score if more than 20%
MPs are female).
The EIUDI exhibits important strengths compared with the FITW by FH and Polity. It
consideration not only experts’ opinions but other sources of data as well, such as electoral
turnout and public opinion data from comparative surveys.
However, the EIUDI is not without its drawbacks. From a data access point of view,
indicator-level data are not publicly available, thus inhibiting our ability to investigate different
dimensions of participation in political process (e.g. turnout, consultation in public policy, civil
society strength). Moreover, it mixes substantively different dimensions of participation. It
bundles in the same variable membership in political parties and in political non-governmental
organisations—dimensions that can be in tension in many polities. Also, it is problematic to
measure citizens’ engagement with politics by a measure of “citizens’ interest in politics”. This is
not so much participation, as (and also disputably) a pre-condition for participation. The same
reasoning applies to questions like “The preparedness of population to take part in lawful
demonstrations”, since willingness to attend demonstrations is obviously not the same thing as
actually doing it. The same could be said of considering “Adult literacy”, “interest in and follows
politics in the news” and “perceptions of democracy.” A case can be made that these are
preconditions for participation but it is hard to sustain the case that these are actual components of
political participation. Finally, the question about the degree to which “authorities make a serious
effort to promote political participation” is unspecific over which arena that effort is directed. Is
it about electoral participation, civil society or political parties? And what does it mean,
specifically? What are those efforts about?
2.4. Democracy Barometer
The Democracy Barometer was launched in 2011 by a consortium between the University of
Zurich and the Social Science Research Center in Berlin (WZB). It differs from previously
mentioned indices as its focus is on “the quality of established democracies” (Bühlmann, Merkel,
Müller, & Weßels, 2008, p. 39). The index has a complex tree-like structure (Merkel et al., 2014,
p. 3): its starts with a base concept (“Quality of democracy”) branching into three principles
(“Freedom”, “Control” and “Equality”). Each of these principles then hierarchically nests
functions, components, sub-components, and indicators. Sub-components are divided into two
conceptual groups: one group deals with “constitutional settings” (rules) while the other deals
with “effective impact” (practice). The authors follow a best-practice/worst-practice approach:
each indicator is standardized, ranging from 0 (worst practice) to 100 (best practice) (Merkel et
The “Equality” principle features among its functions transparency, representation and participation. The codebook provides the sources used for each indicator, which are mostly derived from public opinion data and from other databases. Instead of ranking countries with a value located somewhere amid two fixed poles, each indicator is transformed in order to standardize the distribution between the empirical maximum and minimum. The authors argue that this approach allows them to take into consideration the diversity of empirical forms assumed by democracy and the trade-offs implied by favouring particular functions of democracy over others (Merkel et al., 2014, pp. 6–7).
Equality of participation is measured by the following indicators (Merkel et al., 2014, p. 31): 1) Requirements for and disqualifications of active suffrage (Extracted from Inter Parliamentary Union (various years). Chronicle of parliamentary election)
2) Registered voters as a percentage of voting age population (Extracted from IDEA-Turnout)
3) Representative voter turnout in terms of resources (no participation gap in terms of education and income). Extracted from various continental Barometers, Comparative Study of Electoral Systems, European Election Survey, European Social Survey, International Social Survey, World Values Survey.
4) Representative voter turnout in terms of gender and age (no participation gap). Extracted from various continental Barometers, Comparative Study of Electoral Systems, European Election Survey, European Social Survey, International Social Survey, World Values Survey.
5) Representative alternative participation (signing petitions, attending lawful demonstrations) in terms of resources (no participation gap). Extracted from various continental Barometers, Comparative Study of Electoral Systems, European Election Survey, European Social Survey, International Social Survey, World Values Survey. 6) Representative alternative participation (signing petition and attending lawful demonstrations) in terms of gender and age (no participation gap). Extracted from various continental Barometers, Comparative Study of Electoral Systems, European Election Survey, European Social Survey, International Social Survey, World Values Survey.
1) Facilitation of electoral participation. Extracted from ACE Electoral Knowledge Network; Blais et al. (2007), IDEA-Turnout, Early Voting. Rules facilitating participation have the following categories: 0 = voters can vote at specific polling station only; 1 = voters can vote everywhere in the same district; 2 = voters can vote everywhere in the country; Additional point (+1) if absentee ballot is possible; Additional point (+1) if there are mobile polling stations; Additional point (+1) if there is a possibility to vote in advance
2) Registration: Voter registration is not compulsory. Extracted from ACE Electoral Knowledge Network, CON, Rosenberg/Chen (2009). OSCE
3) Mean participation: Mean participation rate in % of registered electorate in legislative election and/or presidential elections (copied to all years) and/or national referenda (calculated into mean in corresponding year). Extracted from African Elections Database, Australian National University, IDEA-Turnout, International Parliamentary Union, University of California (Irvine): The Election Turnout Database, United States Elections Project.
4) Effective use of direct democratic instruments. Extracted from the Centre for Research on Direct Democracy (see below)
5) Practice of non-institutionalized participation: share of survey respondents who indicate having signed petitions. Extracted from various continental Barometers, Comparative Study of Electoral Systems, European Election Survey, European Social Survey, International Social Survey, World Values Survey
6) Practice of non-institutionalized participation: share of survey respondents who indicate having attended lawful demonstrations. Extracted from various continental Barometers, Comparative Study of Electoral Systems, European Election Survey, European Social Survey, International Social Survey, World Values Survey.
The Democracy Barometer has important advantages over the previous indices. By incorporating public opinion data it allows researchers to weigh in the relevance of inequalities in turnout and protest/civil society participation. Inequality is also measured comprehensively, as it includes several dimensions: gender, age, education and income. It also attempts to harmonize public opinion data from multiple sources.
from 0 (worst practice) to 100 (best practice) might have some unintended consequences, since some indicators, which are institutional preconditions of participation (e.g. freedom of association), could be warranted a more weight (on this point see our discussion below).
2.5.
Bertelsmann Transformation Index (2011)
The Bertelsmann Transformation Index (BTI) focuses on countries in development and transition. Its 2014 edition is comprised of two different indices: the Status Index, which ranks quality of democracy and market economy, and the Management Index, which ranks the countries according to their leadership’s political management performance between January 2011 and January 2013. It covers 129 countries, purposely excluding consolidated democracies, understood as those that were members of OECD by 1989, and countries with less than 2 million inhabitants (with some exceptions, such as Estonia).
It is operationalised as follows: one country expert writes a country report in which (s)he answers 49 questions (Bertelsmann Stiftung, 2014, p. 6), each of which are then summarised into a numerical indicator (1-10). These indicators are later harmonised in regional and interregional calibration processes. Indicators are aggregated into criteria scores (averages), one of them being “political participation”. Political participation is one of three criteria listed under the “Political Transformation” dimension. It is computed from the following indicators, each ranging from 1 to 10 (Bertelsmann Stiftung, 2014, pp. 18–19):
1) To what extent are political representatives determined by general, free and fair elections?
2) To what extent do democratically elected rulers have the effective power to govern? To what extent are there veto powers and political enclaves?
3) To what extent can individuals form and join independent political parties or civic groups? To what extent can these groups associate and assemble freely
4) To what extent can citizens, organizations and the mass media express opinions freely?
into account (Bertelsmann Stiftung, 2014, p. 26): the overall level of socioeconomic
development; the poverty rate; the level of inequality with regard to income and education; the
level of exclusion, based on gender, religion and ethnicity; the scope of subsistence economy.
Another analytical dimension (Political and social integration) assesses whether “stable
patterns of representation exist for mediating between society and the state” and the existence of
“a consolidated civic culture” (Bertelsmann Stiftung, 2014, p. 23). It is the product of the
following indicators, each ranging from 1 to 10 (Bertelsmann Stiftung, 2014, p. 23):
1) To what extent is there a stable, moderate, socially rooted party system able to
articulate and aggregate societal interests? [From 1, lowest score, to 10, highest score,
where “The party system is stable and socially rooted: it is able to articulate and
aggregate societal interest with low fragmentation, low voter volatility and low
polarization”)
2) To what extent is there a network of cooperative associations or interest groups to
mediate between society and the political system? [From 1 (“Interest groups are present
only in isolated social segments, are on the whole poorly balanced and cooperate little.
A large number of social interests remain unrepresented.”) to 10 (“There is a broad
range of interest groups that reflect competing social interests, tend to balance one
another and are cooperative.”)]
3) How strong is the citizens’ approval of democratic norms and procedures.
4) To what extent have social self-organization and the construction of social capital
advanced?
5) To what extent does the political leadership enable the participation of civil society in
the political process? The political leadership obstructs civil society participation. It
suppresses civil society organizations and excludes its representatives from the policy
process”) to 10 (“The political leadership actively enables civil society participation. It
assigns an important role to civil society actors in deliberating and determining
policies.)]. This question captures the link between civil society (understood in a broad
sense, including “civic, economic and professional interest associations, religious,
charity and community-based organizations, intellectuals, scientists and journalists”)
and the various stages of the policy process (agenda setting; policy formulation;
deliberation and decision-making; policy implementation; performance monitoring)
One of the main strengths of the BTI is that it allows researchers to combine the
analysis of participation and equality levels. There is also a high degree of standardization in its
coding procedures. However, the fact that one country expert writes a country report in which
(s)he answers 49 questions poses some risks, since it is arguably difficult to find a country expert
who knows about all aspects of a given polity to the same degree. The use of country/thematic
experts is much more rigorous (ex: an expert on elections in Spain; an expert on civil society in
Italy). This is the practice used in the V-Dem Project, as reported below. Moreover, the BTI
does not cover Western European countries.
Regarding participation, the variables are similar to those employed by Freedom House, that
is, basic thresholds that do not allow for deeply nuanced analyses. Also, welfare regime is only a
proxy for inequalities in political participation. Finally, many questions are posed in an imprecise
way. For example, the question “To what extent are significant parts of the population
fundamentally excluded from society due to poverty and inequality?” does not capture patterns
of participation but just socioeconomic exclusion. The two might be positively related, but they
are totally different things. And in fact, this would not capture situations where the poor and the
excluded actively participate, as is the case in some democracies. Moreover, the BTI links a culture
of high social trust with the density of civil society (Bertelsmann Stiftung, 2014, p. 35). Again,
these may indeed be positively related, but that is not necessarily so. Contexts of active
participation in civil society can generate an anti-democratic political culture and generalized
distrust of competing social categories (e.g.: ethnic conflict). It is also problematic to combine in
the same question the existence of “veto powers and political enclaves”. The former can be
normal democratic institutions like constitutional courts. The later could include separatism and
regional-military bosses with the facto power and thus reflect a non-democratic situation.
Finally, the extent to which “citizens, organizations and the mass media express opinions freely?”
is not a dimension of participation as such, though it can, perhaps, be considered as a causal
previous condition.
2.6.
Civicus - Enabling Environment Index (EEI)
The Enabling Environment Index (EEI) was created by Civicus, a global network of NGOs. An
enabling environment is defined as “a set of conditions that impact on the capacity of citizens (whether
individually or in an organized fashion) to participate and engage in the civil society arena in a sustained and
voluntary manner” (Fioramonti, 2013, p. 3). The index thus measures three different dimensions:
are the product of the aggregation of 71 different sources, ranging from other indices (Freedom
House, UNHDI, BTI), public opinion data (WVS, EVS, World Giving Index) and other
indicators (World Bank Development indicators, Reporters without borders). The EEI thus
combines information from a considerable array of different sources into three middle-level
indices and one at the highest level of aggregation.
Its main strengths are the focus on civil society and the idea that the environment of
participation is a crucial dimension of participation itself. An important limitation is the lack of
transparency of the coding procedures; and although it includes several questions on
participation (% people who would do or have done acts like signing petitions, participate in
boycotts, and attend lawful demonstrations; % of people volunteering; and data on the civil
society infrastructure and density) (Kaufmann, Kraay, & Mastruzzi, 2010, p. 2), the data is not
available at the indicator level.
2.7.
World Bank Governance Indicators
The World Bank Governance Indicators (WBGI) were first collected in 1996 and consist of
aggregate indicators in six key governance areas, one of them being “Voice and Accountability”
(Kaufmann et al., 2010, p. 2). Each indicator results from the aggregation of several different
variables coming from four main types: surveys of households and firms. commercial business
information providers, non-governmental organizations, and public sector organizations
(Kaufmann et al., 2010, p. 5). It relies upon the aggregation of a diversity of indicators (not all
are available for every country) each of them being standardized from 0 to 1. Using an
Unobserved Components Model, the authors of this index then standardize the distribution of
values across indicators into a [–2.5:+2.5] scale.
The Voice and Accountability (VA) dimension intends to capture perceptions about the
extent to which a country's citizens are able to participate in selecting their government, as well
as freedom of expression, freedom of association, and a free media. It has the following
indicators of participation: freedom of association (extracted from Economist Intelligence Unit),
and civil society, electoral process, and political rights (all extracted from Freedom House). Thus,
2.8.
The Comparative Nonprofit Sector Project (CNP, Johns Hopkins
University)
The Comparative Nonprofit Sector Project (CNP) was launched in 1991 by Johns Hopkins
University with the main objective of clarifying “the scope, structure, and financial base of the nonprofit
sector in a cross-section of countries using a coherent, comparative approach” (Salomon and Anheier, 1992, p.
2). One critical aspect of research on the nonprofit sector was the lack of available data – not
only for comparative endeavours but even for analysis at the country level. Therefore the project
was designed from its inception to provide a deep understanding of how and why the nonprofit
sector differs across contexts. In order to improve the conditions of comparability, the project
coordinators established a common definition of the nonprofit sector to be used across
countries (Salamon & Anheier, 1992, p. 10):
“(1) formally constituted; (2) nongovernmental; (3) non-profit-distributing; 4) self-governing; (5) non-partisan; (6)
non-religious organizations, characterized (7) by some degree of voluntary involvement.”
The process of data collection is as follows (Salamon & Sokolowski, 1999, p. 470).
First, an inventory of available statistical data sources for each country is performed in order to
account for national economic census, industrial surveys, special surveys on nonprofit
organizations, official economic statistics, national registers of legal entities, population census,
population surveys, financial budgets, and labour force surveys. Existing data sources are used to
estimate values for the various dimensions under analysis. If available data are insufficient,
targeted surveys are conducted for supplementing the gaps. The key variables under analysis are
(Salamon & Sokolowski, 1999, p. 469):
1) Expenditures: The costs incurred in the general operations of an organization
2) Employment: computed as a share of total nonagricultural employment
3) Volunteers: the number of volunteers working for nonprofit organizations in our
target countries
4) Revenues: inflows of spendable resources received by the organization during the
year
5) Fees and charges: membership dues; service charges paid directly by the client in
exchange for services; investment income; and income from the sale of goods and
services
6) Public sector payments: revenues coming from all branches of government
The critical strength of the CNP is its effort to cross-nationally chart an arena of society for
which comparative data are scarce. A limitation is that more attention is given to the shape of the
nonprofit sector rather than the structure and participatory environment of civil society as such.
Issues crucial in civil society studies like the number of organizations, their dimension and levels
of membership are not considered. It is not possible to know if civil society is constituted by a
set of small associations or large mass associations. It excludes unions, religious organizations,
and political movements. No data on membership levels are provided.
2.9
. Eurobarometer
The Eurobarometer has been carried out by the European Commission since 1973 (European
Commission, 2013, p. 5). It currently involves the 28 member states of the EU plus a varying
number of candidate countries. The core questions of the “Standard Eurobarometer” deal
mostly with attitudes towards the EU and its institutions. However, since 1990, special
Eurobarometers have been conducted on a diverse array of topics, including values, attitudes and
behaviour towards participation and democracy. In addition, flash Eurobarometers can be
requested by the services of the European Commission, and some have dealt specifically with
questions of participation such as Flash EB 373 (“Europeans’ engagement in participatory
democracy”) and Flash EB 375 (“European youth: participation in democratic life”). The
Eurobarometer occasionally features questions about organisational membership in a wide range
of organisations (for instance, see EB 73.4, of May 2010), thus providing good indicators about
the density of membership in civil society organisations and political parties. However, due to
the character of public opinion data in question, the Eurobarometer does not provide any
information about the institutional framework on which respondents operate, be it at the
national, regional or local scale.
2.10. European Values Study
The European Values Study is coordinated by the Tilburg University and has been responsible
for the collection of four rounds of public opinion data, from 1981 to 2008. In its latest round,
the European Values Survey covered six research topics (life, family, work, religion, politics, and
society) and was applied in forty-seven countries. Participation in the political sphere was
covered in this wave by the following questions (EVS, 2011):
which, if any, are you currently doing unpaid voluntary work for? A - Social welfare
services for elderly, handicapped or deprived people; B - Religious or church
organizations; C - Education, arts, music or cultural activities; D - Trade unions; E -
Political parties or groups; F - Local community action on issues like poverty,
employment, housing, racial equality; G - Third world development or human rights; H
- Conservation, the environment, ecology, animal rights; I - Professional associations; J
- Youth work (e.g. scouts, guides, youth clubs etc.); K - Sports or recreation; L -
Women’s groups; M - Peace movement; N - Voluntary organizations concerned with
health; O - Other groups.
2) Forms of political action: I’m going to read out some different forms of political
action that people can take, and I’d like you to tell me, for each one, whether you have
actually done any of these things, whether you might do it or would never, under any
circumstances, do it. A - Signing a petition; B- Joining in boycotts; C- attending lawful
demonstrations, D-joining unofficial strikes, E-occupying buildings or factories
Similarly to the Eurobarometer, it provides a good and reasonably accurate measure of density of
membership of civil society. However it does not offer any information about the institutional
framework of the respondent, be it at the national, regional or local scale.
2.11. World Values Survey
The first wave of the World Values Survey was applied in tandem with the EVS in 1981.
Currently the World Values Survey Association autonomously administers the survey, which has
been conducted over six waves (World Values Survey, 2015). The WVS has a global scope,
having covered over all the waves some 90 countries throughout the world. It features questions
about values and attitudes towards politics, the economy, society and religion, as well as on the
activities developed by respondents within different types or organizations. The latest wave,
which was applied in 55 countries, included the following questions on participation (World
Values Survey, 2014, p. 2):
1) “For each organization, could you tell me whether you are an active member, an
inactive member or not a member of that type of organization?” A - Church or
religious organization; B - Sport or recreational, C- Art, music or educational
organization; D- Labor Union; E-political party, F-environmental organizations,
2) “I’d like you to tell me, for each one, whether you have done any of these things,
whether you might do it or would never under any circumstances do it (read out and
code one answer for each action): A- Signing a petition; B- Joining in boycotts;
C-Attending peaceful demonstrations; D- Joining strikes; E- Any other act of protest. For
those reporting as having done any of those, a further question asks how many times
the respondent engaged in that behavior over the last year.
The strengths and limitations discussed above for the European Values Study apply here too.
2.12. Vanhanen’s Democratization Index
In the 1960s, Tatu Vanhanen started collecting data about the distribution of power in an
increasing scope of societies around the world (Vanhanen, 2014). In a similar way to Robert
Dahl, Vanhanen considers that the degree of democracy can be fundamentally captured by the
interaction of two dimensions central to the electoral realm: competition and participation. The
degree of competition is defined as “the smaller parties' share of the votes cast in parliamentary
or presidential elections, or both” (Vanhanen, 2014, p. 8). Participation is measured by “the
percentage of the population which actually voted in the same elections” (Vanhanen, 2014, p. 8).
The index of democratization is the product of these two by dimensions divided by 100.
An advantage of Vanhanen’s index is its extensive coverage. The dataset encompasses
virtually all independent countries in the world from 1810 to 2012. However, it sticks to a strictly
electoral conception of democracy, not capturing evolutions in other dimensions.
2.13.
General evaluation
Although extant measures are useful for some purposes, applied work and research on the
causes and consequences of democracy are share a few common limitations. First, most indices
are highly aggregated, which means they are helpful for summary judgments but not for a more
nuanced understanding. Even where various components of an index are available these
components still measure quite general concepts. What is more, the degree to which various
components of an index are truly independent of one other is unclear: they may simply reflect a
coder’s overall sense of how democratic a country is. Second, most indices are constructed to
measure only one or two dimensions of democracy – generally, the “liberal” (Madisonian) or
“electoral” (Schumpeterian) dimensions. Third, indices tend to cover a global sample of
opinion data can be revealing about how citizens of each country evaluate their own political
system, their opinions are not intended to compare their country to others, and there is little
reason to believe that they are comparable across countries. Finally, potential problems of
measurement error are left unaddressed, while routine tools such as inter-coder reliability scores
tend to be ignored. The absence of reliability data means that the accuracy of the data is either
unknown or unreported. Indeed, several recent analyses have shown that they cannot make fine
distinctions reliably.
3. Conceptualizing and Measuring Political Participation using
the Varieties of Democracy Approach
Defining a social concept is a necessary step before attempting to measure it (Goertz, 2006;
Sartori, 1970). In the case of political participation, we can think of it as being structured in three
main arenas. The first of them is the electoral arena. In a democratic polity elections are the
critical instrument at the disposal of citizens to determine the choice of their representatives and,
consequently, to influence the policies pursued by those (Verba, Schlozman, & Brady, 1995).
Despite longstanding discussions about the necessary conditions for a regime to be considered
democratic, free and fair elections do constitute a core requirement of virtually all conceptions of
democracy – even minimalist ones (Munck, 2009, p. 17).
The second arena of participation lies within the realm of political parties. These
organizations play a pivotal role in aggregating and expressing political preferences, recruiting
potential members of the political elite and offering alternative political platforms to the
electorate (Schmitter, 2001)
Finally, there is the arena of civil society, which can be synthetically defined as the
“networks of formal and informal associations that mediate between individual actors and the
state” (Bermeo, 2003, p. 7). The conceptual and practical boundaries between political parties
and civil society are not always clear (Katz & Mair, 1995); however, for the purposes of defining
and measuring political participation, subsuming political parties in the sphere of civil society
would carry fewer advantages than granting them an autonomous arena mediating between the
state and society. It has been argued that widespread participation in civil society organizations
yields positive effects at both the societal and individual level (Bernhard, 1993; Bernhard & Kaya,
2012; Putnam, 1993, 2000), although some authors dispute this assertion (Berman, 1997; Jamal,
We try to measure each of these arenas taking into consideration whenever possible indicators from three relevant dimensions. The first is the institutional: the opportunities for participation at the disposal of citizens vary deeply from country to country. These frameworks are shaped by a set of interrelated institutions, which are not neutral in the sense that they constitute “collections of standard operating procedures and structures that define and defend interests” (March & Olsen, 1984, p. 738). The second dimension that we bear in mind is the organizational, or behavioural. This dimension refers to the conversion by citizens of the opportunities laid out by their institutional context. Indeed, most comparative analyses of participation take into consideration its level or volume (e.g. levels of turnout; membership and participation in political parties; membership and participation in civil society organizations). Finally we try to account for the political culture inherent to participation contexts (Almond & Verba, 1965; Sabetti, 2007). By doing so, we try to measure the adhesion of political participation actions to core democratic values.
The combination of these three dimensions implies a sequence of logically nested questions. The institutional context is arguably the most critical for participation to occur: Are citizens offered the opportunities to participate (be it in elections, political parties or civil society organisations)? The organisational and behavioural context refers to the level and variety of ways of participating: Given the opportunity to participate, do citizens embrace it, and how much do they so? Finally, the cultural dimension offers an insight into the contours of political action: How do citizens make use of participation?
The following step is to find relevant indicators for each arena. For this purpose, the V-Dem project seems like the most valuable source of indicators. Once completed, V-V-Dem will arguably provide the most thorough dataset on democracy allowing end-users to make use of its disaggregated indicators in order to build their own indexes. Indeed, the approach outlined in this section would require its own data collection if it were not for the publicly available disaggregated data available in V-Dem, and not in its competitor indices.
Table 3 summarizes the information we are seeking to combine2. Regarding the
electoral arena, this is one of the areas in which V-Dem provides substantial data, of which we start by selecting the degree to which national elections were multiparty, their free and fair character,
2 Given the variety of measurement scales, every variable was be converted into a [0:1] interval using the following
formula:
x' = !"#!!!!"#!(!)
!(!)!!"#!(!)
and the elected (vs. appointed) nature of local government3. The behavioural dimension of electoral participation is captured through turnout in the closest election. Turnout is often subject to various measures that might affect its comparability, so we choose to go for the proportion of voters within the voting age population as provided by the Institute for Democracy and Electoral Assistance and also distributed in the V-Dem dataset. Regarding the cultural dimension of electoral participation , we incorporate the freedom of the media coverage during campaign, which accounts for the extent to which electoral participation is enhanced by a fully democratic campaign environment. An informed electorate with access to a diversity of political views during campaign time is critical for a fully democratic election process.
Table I.A – Variables in the index
Arenas Indicators
Electoral (1st term) Election free and fair (V-Dem: v2elfrfair) Elections multiparty (V-Dem: v2elmulpar) Local government elected (V-Dem: v2ellocelc) Election free campaign media (V-Dem: v2elfrcamp)
Electoral (2nd term) Election Voting Age Population turnout (V-Dem: v2elvaptrn)4
Political parties Party ban (V-Dem: v2psparban)
Opposition parties autonomy (V-Dem: v2psoppaut) Party linkages (V-Dem: v2psprlnks)
Distinct party platforms (V-Dem: v2psplats) Party branches (V-Dem: v2psprbrch)
Civil society CSO entry and exit (V-Dem: v2cseeorgs)
CSO repression (V-Dem: v2csreprss) CSO consultation (V-Dem: v2cscnsult)
CSO participatory environment (V-Dem: v2csprtcpt)
3 Some of these variables refer to specific general elections, while others are coded every year. For the years in which a general election did not occur, the most straightforward solution is the method already employed by the V-Dem of using the values coded for the most recent election, unless there is an interruption of the electoral regime.
V-Dem also offers a comprehensive array of indicators related to the participation in
political parties. Regarding its institutional dimension, we select two variables: the existence of bans
on political parties, and the autonomy of opposition parties. Although V-Dem does not offer
information about the level of adhesion to political parties, there are two meaningful and helpful
organizational indicators: the professionalization of party organizations, their territorial diffusion,
and the existence of party linkages with other organisations. The political culture of parties can
be captured by the degree of dissimilitude between party platforms of different parties.
Finally, we try to capture the institutional context of civil society by incorporating three
variables: the individual freedom to join and exit organizations; the extent to which civil society operates
without restraint; and civil society’s role in public policy consultation. The organisational and cultural
dimensions are captured through a variable measuring the proportion of citizens involved with
organizations.
At this point we have chosen several relevant indicators from the V-Dem database and
converted into a [0:1] scale. The following step has to do with the aggregation of each set of
indicators into a single arena sub-score5. Three principal components analyses were performed
using as a source the V-Dem values of five Southern European countries: France, Greece, Italy,
Portugal and Spain. This implies that the domain of comparison and the range of the variables
were restricted to this subset. If the Principal Component Analyses was to be carried out using
information from the whole globe from 1900 on, as the dataset would have allowed, the
resulting scores would very likely make the Southern European countries have closer values, as
historically extreme cases of low participation would have been taken into account. The
procedure carried out here thus allows for a more detailed comparison between a limited set of
countries in a limited period in time (1970-2012). This statistical procedure implies that different
sets of data generate different weights.
After performing the three PCA, we observe that the only case in which one variable
did not show a satisfactory correlation with the remaining ones was turnout. Given the centrality
of turnout to assess electoral and political participation writ large, we have chosen to make it
interact with the remaining variables through a multiplication. The electoral arena participation
score is thus the product of 1) the aggregation of the four previously mentioned variables into a
single score via PCA, and 2) the level [0:1] of turnout in the latest election. The other two
5 There would be alternatives to this procedure. One of them would be to attribute a priori weights to each of the
indices result from the loadings of the variables that compose each arena according to the scores
obtained in PCA. The PCA results are available as appendixes.
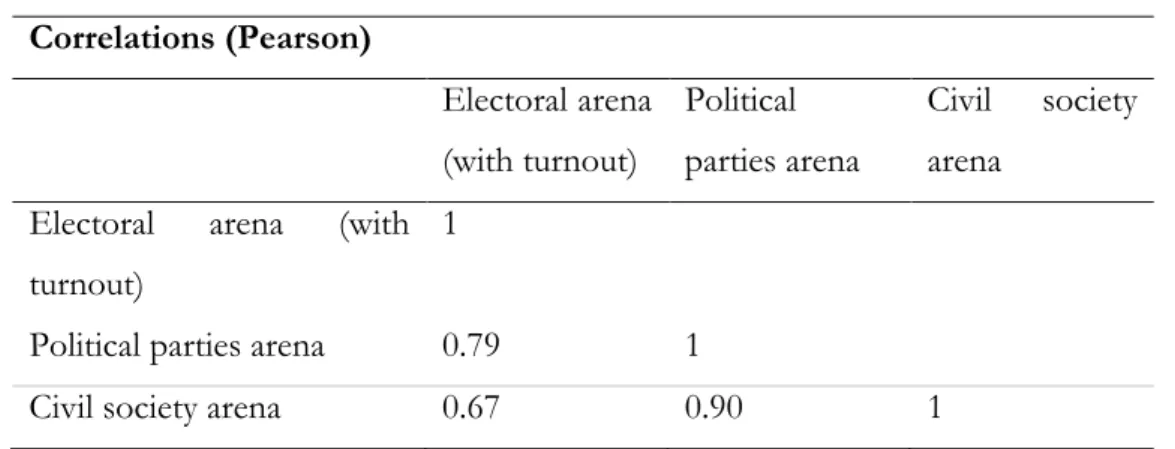
Table 2. Correlation matrix between the three scores
Correlations (Pearson)
Electoral arena
(with turnout)
Political
parties arena
Civil society
arena
Electoral arena (with
turnout)
1
Political parties arena 0.79 1
Civil society arena 0.67 0.90 1
The three resulting arena scores are correlated with each other in different degrees.
Participation in political parties and in civil society are highly correlated (0. 90), whereas the
aggregate score of the electoral arena is relatively less correlated with the latter (0.67).
A final step is thus to aggregate these three scores into a single measurement for every
country-year. As discussed by Munck (2009, pp. 48–49), there are two main decisions when
deciding the method of aggregation to use: 1) should a high score in an indicator be annulled by
a low score in other indicator (interaction) and 2) can a low score in an indicator be attenuated
by a high score in other indicator (compensation).
Since each of the arenas is vital for a vibrant democracy we follow the example of the
Human Development Index of the United Nations (2010, p. 15) and aggregate the final score of
using a geometric mean rather than an arithmetic one. The three sub-scores were rescaled into a
[0:1] interval and subsumed into a general political participation index, with participation for
country i in year t thus being given by:
Participation!!" = Electoral!!"×!Political!parties!!"×!Civil!society!!" !
3.3. Comparison with other indicators
After computing the arena scores and the final index, we compare their performance of with
some of the established indicators reviewed in the second section. We will discuss the evolution
of these indices across the five countries.
Figure 1: Arena Scores
Figure 2: Participation index
0
.5
1
0
.5
1
1970 1980 1990 2000 2010
1970 1980 1990 2000 2010 1970 1980 1990 2000 2010
France Greece Italy
Portugal Spain
Electoral score*turnout Political parties Civil Society
year
Graphs by country name
0
.5
1
0
.5
1
1970 1980 1990 2000 2010
1970 1980 1990 2000 2010 1970 1980 1990 2000 2010
France Greece Italy
Portugal Spain
year
We compare it against the two Freedom House scores (Civil Liberties and Political
Rights), the Polity 2 revised score, and the Vanhanen index. The data on these external indicators
come are obtained via the Quality of Government dataset of Gothenburg University (Teorell et
al. 2015).
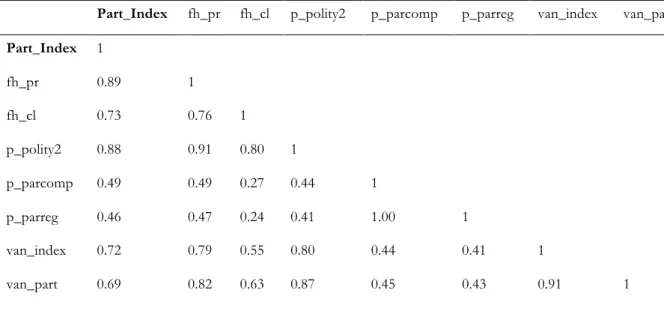
The correlation matrix is presented in table 3. Correlation coefficients with the existing
indices are high. While this is somewhat reassuring in terms of the external validity of our
aggregated index, it also raises the issue of whether it is efficient in adding new information
about the polities. However, visual inspection of the country trends suggests that our
Participation Index might be more sensitive to short term effects.
Table 3. Correlation matrix with other indices (1972-2010)
Part_Index fh_pr fh_cl p_polity2 p_parcomp p_parreg van_index van_part
Part_Index 1
fh_pr 0.89 1
fh_cl 0.73 0.76 1
p_polity2 0.88 0.91 0.80 1
p_parcomp 0.49 0.49 0.27 0.44 1
p_parreg 0.46 0.47 0.24 0.41 1.00 1
van_index 0.72 0.79 0.55 0.80 0.44 0.41 1
van_part 0.69 0.82 0.63 0.87 0.45 0.43 0.91 1
Notes: N = 190.
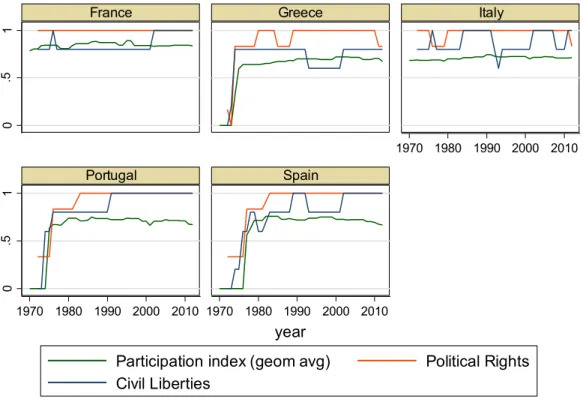
The evolution of our indicators of participation can be compared with the values in
other indices as a way to ensure validity but also to show whether it captures something else. We
pick three indices for comparability purposes: Freedom House, with its two dimensions
(“Political rights” and “Civil liberties”); Polity (revised combined score); and Vanhanen’s index
of democratization. All indices converge in the marked increases that followed the regime
changes in the 1970s in Portugal, Greece, and Spain.
In the five countries under consideration, after the transitions to democracy were
complete, Freedom House’s two indices range between 1 and 3. While in some countries (France
equivalent Freedom House index (the political rights index), shows a similar high ranking and
classification for the case of France comparatively to the other southern European countries.
V-Dem and Freedom House also capture in similar ways the rankings of the three countries that
democratized in the 1970s, all showing a spectacular rise in the political parties indexes from the
mid-1970s to the early 1980s.
But when looking for finer variations between the cases of Greece, Spain, Italy, and
Portugal, the FH index is not enough. All these democracies evidence very similar scores and no
signs of change over time since 1980. By contrast, the V-Dem index is better able to capture
significant political change in the realm of political parties, namely Italy’s slight decline since the
1990s, with the end of the traditional post second world war party system, Spain’s decline since
the early 2000s because of corruption scandals (Gunther and Diamandouros, 2001; Gunther,
Montero, Botella, 2004), and even the slight rise in Portugal since the mid-1980s, when the party
system stabilized after the electoral defeat of political parties sponsored by the President of the
Republic (Jalali, 2007).
Figure 3: Freedom house – Political rights and Civil liberties indices
0
.5
1
0
.5
1
1970 1980 1990 2000 2010
1970 1980 1990 2000 2010 1970 1980 1990 2000 2010
France Greece Italy
Portugal Spain
Participation index (geom avg) Political Rights Civil Liberties
year
Civil society indexes by Freedom House (civil liberties index) and V-Dem are both able
to track some major trends, like the huge rise of civil society during transition and early
consolidation of democratic regimes (mid-1970s to mid-1980s). But V-Dem is able to portray
much more specifically the evolution and different nature of civil society in countries like
Portugal and Spain, where the superior density and political incorporation of Portuguese civil
society demonstrated by V-Dem confirms existing historical and qualitative research (Fishman,
2011; Fernandes, 2014). Portugal ranks always above Spain since the mid-1980s in the V-Dem
index, whereas in the Freedom House civil liberties index both countries have almost similar
scores.
The revised polity score results from the combinations of two other Polity scores,
where the autocracy score is subtracted from the democracy score. The results from each of
these two the indices are calculated on the basis of four dimensions: competitiveness of political
participation, openness of executive recruitment, competitiveness of executive recruitment, and
constraints on the chief executive. Since each of the two previous indices “p_autoc” and
“p_democ” vary from 0 to 10, the revised polity score varies between -10 (autocracy) and 10
(democracy) (Teorell et al. 2015).
The Polity index remains quite insensitive to finer variations as well. Like the previous
indexes, it captures the major regime transitions of the mid-1970s. At the same time it is unable
to capture any variation between countries, since these have a totally equal ranking and
classification, something which is quite implausible. The V-Dem elections index is much better
in this regard. For instance it clearly shows that Italy and France rank higher than any other
Southern European democracy. This finding gives validity to theories that argue that older
democracies tend to have more competitive and free elections and higher turnout, because of the
fact that they started in an pre-television era, when strong mass mobilizing parties where the only
vehicles linking masses to elites (Bartolini & Mair, 2001). But V-Dem also captures variations
between older democracies, showing a decline in the elections index in all countries since the
2000s, with the exception France, a puzzling variation which remains to be explained.
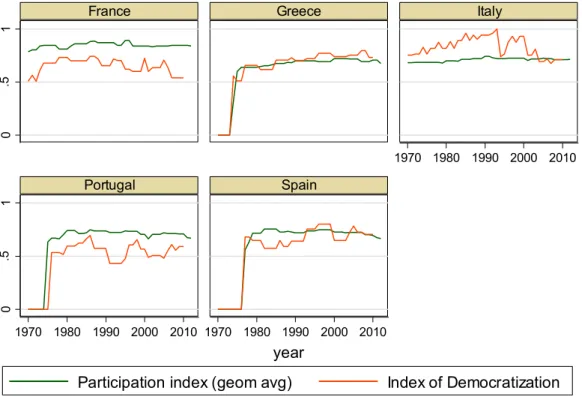
Vanhanen’s index uses a dimension of competition derived from electoral results that is absent
from our index. It provides an interesting comparison as it is the only of the three that takes into
account voter turnout. Indeed, it has a high Pearson coefficient of correlation with our electoral
Figure 4: Revised combined Polity Score
Figure 5: Vanhanen’s Index of Democratization
0
.5
1
0
.5
1
1970 1980 1990 2000 2010
1970 1980 1990 2000 2010 1970 1980 1990 2000 2010
France Greece Italy
Portugal Spain
Participation index (geom avg) Revised Combined Polity Score
year
Graphs by country name
0
.5
1
0
.5
1
1970 1980 1990 2000 2010
1970 1980 1990 2000 2010 1970 1980 1990 2000 2010
France Greece Italy
Portugal Spain
Participation index (geom avg) Index of Democratization year