should the virus be introduced. However, lower indices could promote cases. The situation for dengue is prob-ably similar.
Adult populations of A. aegypti may be indirectly assessed by means of ovitraps. These are jars with a ca-pacity of about 500 ml which are painted on the outside with a glossy black paint. The usual size is 130 mm high with a 75 mm diameter. Clean water is added to a depth of 2-3 cm and a hardboard paddle 13 cm by 2 cm fas-tened to the inside of the jar. The paddles are collected every 5 to 7 days and examined for eggs. Care must be taken in the selection of sites for the traps.
Entomologic surveillance and survey techniques can be adapted for evaluation of either routine operational or emergency control measures. In both cases, the epidem-iologist can use the information to evaluate effectiveness of the control program and should attempt to correlate this information with what is happening within the human population.
PAHO has been involved in determining the efficacy of new insecticides and control technology. At present temephos as a formulation of coated sand granules is ex-tensively used as a larvicide even in potable water. It has produced control for 1-3 months. Consequently, many control programs attempt to follow 8-week treatment cycles. Effective treatment centers on finding and treat-ing all containers holdtreat-ing water and the acceptance of the people to allow the insecticide to remain in the con-tainer. The musty taste of temephos is disagreeable to some, and a certain degree of health education may be necessary.
Recently an insect growth regulator, methoprene, has been used successfully in small trials and may be consid-ered safe as a larvicide for potable water. It has the ad-vantage of being odorless and tasteless but it has a shorter period of activity and costs more than temephos. Source reduction may be implemented as a control mea-sure.
Some programs supplement larviciding with perifocal
7
69
adulticiding. With present costs of insecticide and labor, it has not been determined if perifocal spraying is advan-tageous. Residual spraying of houses, schools, and other public structures is done in routine and emergency situa-tions. It produces a good level of control but is time-consuming, expensive, and is being met increasingly with public opposition. Most insecticides used in malaria con-trol programs, if there is not resistance in the A. aegypti
population, can be used.
Ultra-low volume (ULV) application of technical grade or special formulations of malathion, dibrom, pirimiphos methyl or fenitrothion have been used against Aedes aegypti. Applications can be made with airplanes and helicopters configured with special equipment or with agricultural equipment adapted for public health use. In severe epidemic conditions aerial application should be considered a method of choice. However, many countries have vehicle mounted ULV equipment and thermal fog-gers as well as potable ULV and thermal equipment in their control programs or in use in agriculture that could be used in emergency control operations. ULV and ther-mal equipment are of great value for emergency control as they are aimed at bringing the adult vector population to a level sufficiently low to reduce or halt viral activity in the nonimmunized human population. This approach has been used repeatedly during the recent dengue epidemics. In the event of the danger of urbanization of yellow fever, ULV and thermal space sprays could be used as a stop gap until the human population is immu-nized.
PAHO is preparing manuals for the emergency control of vector-borne diseases and operational control of Aedes aegypti. A guide to producing national contingency plans for vector emergencies by an established national disas-ter and emergency committee will be an important aspect of the manuals.
(Biology and Vector Control Program, PAHO)
Morbidity and mortality data continue to be the best available indicator for evaluating the effectiveness of pro-grams for the control of water-borne diseases, even when the information is not of the best quality and is not re-ceived with the desired uniformity and regularity.
Table 1 shows the number of cases and deaths caused by diarrheal diseases in Panama and the rates per
100,000 inhabitants from 1970 to 1978. As will be noted, the diarrheal disease morbidity rate apparently in-creased, while the mortality rate for diarrheal disease dropped during the period. This may be explained by wider coverage of the health services, which has made it possible to detect morbidity and mortality more pre-cisely, and by better reporting of cases. On the other 7
Diarrheal Diseases in Panama, 1970-1978
-,&<N
Table 1. Number of cases and deaths due to diarrheal diseases in Panama, with rates per 100,000 inhabitants, 1970-1978.
Deaths
With medical
Cases certification Total
Year No. Rate No. Rate No. Rate
1970 ... 344 24.0 673 46.9
1971 ... 271 18.3 574 38.8
1972 ... 255 16.7 512 33.6
1973 ... 284 18.0 530 33.8
1974 31,630 1,951.2 222 13.7 500 30.9
1975 27,442 1,645.5 201 12.0 427 25.6
1976 36,598 2,133.6 327 19.1 511 29.7
1977 33,426 1,896.1 214 12.1 395 22.3
1978 33,198 1,833.6 133 7.3 243 13.3
Sources: Cases-Ministry of Health, Bureau of Epidemiology; deaths-Office of the Comptroller General of Panama (preliminary
data for 1976, 1977, and 1978).
deaths from diarrheal diseases, the factors responsible for the decline would not appear to be limited to medical care alone, but would seem to include others related to the social and economic infrastructure, such as construc-tion of water supply systems, housing, and highways.
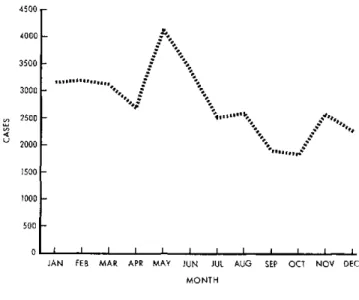
In 1978 there were clear seasonal variations in the monthly regional distribution of cases of diarrhea in the country (Figure 2). The highest incidence occurred in May and June, which are the start of the rainy season. This seems to hold true for most regions of the country. In interpreting the significance of the morbidity and mortality data by region, it is necessary to take into ac-count wide variations in data compilation and reporting.
Figure 2. Cases of diarrheal diseases by month of occur-rence, Panama, 1978.
4500 r
hand, mortality declined also as a result of the better health care made available.
Although the data for 1976, 1977, and 1978 are pre-liminary, the declining trend in mortality rates would seem to be real (Figure 1). Since no significant changes have taken place in the percentage of medically certified
Figure 1. Morbidity and mortality due to diarrheal diseases, Panama, 1960-1978.
3000w
2000
1000
500
4000 -3500
l-3000
l-2500
-2000 - """ ...II.11 4 C
1500
-1000
-500
UL
JAN FEB MAR APR MAY JUN JUL AUG SEP OCT NOV DEC MONTH
DEAT HS
[T '/,
" ' ... ".
CERTIFIED DEATHS ',, w
%"s
%.·P~
I J Jl lI .l l l . 1l ll i l
Table 2. Number of diarrheal disease cases and deaths, with rates per 100,000 inhabitants, by region, Panama, 1970-1978.
Deaths
With medical
Cases certification Total
Region No. Rate No. Rate No. Rate
Metropolitan 7,681 1,228.8 26 4.2 27 -'4.3
Azuero 1,842 1,169.7 2 1.3 6 '3.8
Bocas del Toro 1,772 3,169.9 14 25.0 23 41.1
Coclé 2,964 2,069.9 3 2.2 11 8.2
Colón 1,197 888.2 31 23.0 35 26.0
Chiriquí 10,261 3,611.9 35 12.3 71 25.0
Darien 447 1,746.1 2 7.8 2 7.8
Veraguas 3,232 1,857.9 5 2.9 39 22.4
Rest of country 3,802 1,806.9 15 7.1 29 13.8
Total 33,198 1,833.6 133 7.3 243 13.4
Sources: Cases-Ministry of Health, Bureau of Epidemiology; deaths-Office of the Comptroller General of the Republic (prelimi-nary data).
z
o o
i 1 q 1
.
100
50
1960 1962 1964 1966 1968 1970 1972 1974 1976 1978
YEAR
…''--- DATA NOT AVAILAELE
8
.
U u
I , , , , . ..
Figure 3. Deaths due to diarrheal diseases, by region, Panama, 1970-1978.
80 ...
COLREST OF COUNTRY
60 _\ . .@ \ ._._' -METROPOLITAN AREA
60
40* AZUERO
30
~
BOCAS DEL-2 -'% TORO . --- ' \"
20 _hl
io
1970 1971 1972 1973 1974 1975 1976 1977 1978 1970 1971 1972 1973 1974 1975 1976 1977 1978 1970 1971 1972 1973 1974 19 YEAR
Table 3. Diarrheal disease morbidity and mortality, with rates per 100,000 inhabitants, by region and age group, Panama, 1978.
Age
< 1 year 1-4 years 5-14 years 15-48 years 50 years + Total
Region No. Rate No. Rate No. Rate No. Rate No. Rate No. Rate
Metropoli- Ca 2,542 15,130.0 2,495 4,216.0 720 510.8 1,636 499.8 288 356.2 7,681 1,228.8
tan Db 18 107.13 5 8.45 1 0.71 1 0.29 1 4.42 26 4.16
Azuero C 484 9,998.0 514 2,807.4 273 636.4 434 615.7 137 653.6 1,842 1,169.7
D 1 20.66 - - - 1 4.8 2 1.3
Bocas del C 553 28,968.0 612 7,795.2 151 985.6 425 1,612.4 31 695.0 1,772 3,169.9
Toro D 7 366.7 6 76.42 1 6.53 - - - - 14 25.04
C 795 14,188.8 960 4,698.2 386 923.0 664 1,126.9 159 780.8 2,964 2,069.9
D 2 35.7 1 4.9 - - - 3 2.22
C 239 5,675.6 391 2,492.8 147 429.1 364 604.0 56 275.0 1,197 888.2
D 21 498.70 4 25.5 - 6 29.47 31 23.0
Chiraquí C 2,969 29,068.0 3,010 7,709.4 1,133 1,382.4 2,672 2,179.5 477 1,575.5 10,261 3,611.9
D 20 195.81 12 30.74 3 3.66 - - - - 35 12.32
C 121 11,816.4 176 4,329.6 52 726.6 81 741.4 17 700.2 447 1,746.1
arien D 1 97.66 - - 1 14.0 - - - - 2 7.81
C 767 12,661.0 1,163 4,912.1 415 827.5 679 901.5 208 1,109.0 3,232 1,857.9
Veraguas D 2 33.01 2 8.45 - - - - 1 5.33 5 2.90
Rest of the C 1,244 17,151.5 1,310 4,407.8 423 703.5 700 771.8 125 694.4 3,802 1,806.9
country D 7 96.51 3 10.1 2 3.33 1 1.1 2 8.84 15 7.13
C 9,714 16,773.1 10,631 4,877.4 3,700 719.5 7,655 908.2 1,498 689.9 33,198 1,833.6
D 79 136.41 33 15.14 8 1.70 2 0.24 11 5.07 133 7.35
9
aC = Cases.
bD = Deaths.
For instance, Colón, a region where most of the deaths (88.6 per cent) are medically certified, has one of the highest diarrhea mortality rates in the country; however, the morbidity rate is the lowest, which indicates substan-tial under-reporting of cases (Table 2).
Since diarrheal disease can be easily detected, even by persons with no specialized training, the total number of deaths from diarrhea, both with and without medical certification, may be regarded as the most homogeneous and exact parameter of the extent of the problem in Panama.
In 1978 the regions of Bocas del Toro, Colón, quí, and Veraguas had the highest mortality rates. Chiri-quí and Bocas del Toro had the highest morbidity rate. The lowest mortality rates were reported in Azuero, the Metropolitan Region, Darien, and Coclé.
The evolution of all deaths from diarrheal diseases in each region of the country from 1970 to 1978 is shown in Figure 3. In 1978, the number of deaths declined in all regions of the country except the Metropolitan Area.
The rates shown in Table 3 indicate the age groups at greatest risk of contracting and dying from diarrheal
diseases. The < 1 age group shows the highest morbidity and also mortality rates. The morbidity rate in this group is nine times and the mortality rate 18 times the cor-responding rates for the total population.
Next in point of incidence is the 1-4 year group, but in this case the risk of contracting diarrheal disease is 2.5 times that faced by the total population, while the risk of dying is only twice that of the total population.
The 5-14 and 15-49 year age groups have relatively low morbidity and mortality rates, particularly the 15-49 year group (mortality rate 0.24 per 100,000 inhabi-tants).
The 50 and older group has the lowest morbidity rate but follows the 1-4 year group in terms of mortality. Even so, the risk of dying from diarrheal diseases is lower in this group than for the total population and the deaths are associated with other debilitating factors in this age group.
(Source: Boletín Epidemiológico, Vol. IV (4), 1979, Ministry of Health of Panama.
7970
Meningitis in Brazil, 1976-1978
The number of Brazilian states participating in the meningitis epidemiologic surveillance system has in-creased steadily since 1976. To the 14 states that were participating in the system that year, five were added in 1977 and two more in 1978, raising the total to 21.
The cases were classified into three major groups for study: meningococcal meningitis, meningitis from other known causes, and unspecified meningitis. The three groups taken together were designated as meningitis in general.
From 1976 to 1978, the number of cases of menin-gococcal meningitis declined by nearly 50 percentage points as a percentage of the number of cases of meningi-tis in general (Table 1); however, the proportion of men-ingitis due to other known causes more than doubled. These changes reflect a trend of the disease to regress to the endemic levels prevailing before the latest epidemic. They also indicate a progressive increase in the number of cases in the second group, which in turn suggests a better use of the laboratories for diagnosis.
The high proportion of cases of unspecified meningitis may be a consequence of the inclusion in the system of new reporting areas served by personnel having less
ex-perience with the problem, or of the inability to perform a laboratory test to determine the causative species.
The mortality rates in 1978 were lower than in 1977 but higher than in 1976 (Table 1).
Figure 1 shows the monthly meningitis mortality rates, in terms of number of cases per 100,000 inhabitants reported in Brazil each month during the period under study. Individual rates are shown for each etiologic group. It will be noted that the number of cases of men-ingococcal meningitis increased in the coldest months (from May to August), while the number of'cases due to other known causes tended to increase in the warmest months (from September to January).
According to the data for 1977, of the total of 2,299 cases of meningococcal disease, 1,920 (83.5 per cent) were classified as meningococcal meningitis and 379 (16.5 per cent) as meningococcemia; 498 and 123, respectively, occurred in the municipalities including the state capital; and 1,422 and 256, respectively, in other municipalities of the state (Table 2). The fatality rates for meningococcal disease (18.5 per cent), meningococ-cal meningitis (15 per cent), and meningococcemia (36.1 per cent) were all higher than in 1976. The same holds 10