For instance, Colón, a region where most of the deaths (88.6 per cent) are medically certified, has one of the highest diarrhea mortality rates in the country; however, the morbidity rate is the lowest, which indicates substan-tial under-reporting of cases (Table 2).
Since diarrheal disease can be easily detected, even by persons with no specialized training, the total number of deaths from diarrhea, both with and without medical certification, may be regarded as the most homogeneous and exact parameter of the extent of the problem in Panama.
In 1978 the regions of Bocas del Toro, Colón, quí, and Veraguas had the highest mortality rates. Chiri-quí and Bocas del Toro had the highest morbidity rate. The lowest mortality rates were reported in Azuero, the Metropolitan Region, Darien, and Coclé.
The evolution of all deaths from diarrheal diseases in each region of the country from 1970 to 1978 is shown in Figure 3. In 1978, the number of deaths declined in all regions of the country except the Metropolitan Area.
The rates shown in Table 3 indicate the age groups at greatest risk of contracting and dying from diarrheal
diseases. The < 1 age group shows the highest morbidity and also mortality rates. The morbidity rate in this group is nine times and the mortality rate 18 times the cor-responding rates for the total population.
Next in point of incidence is the 1-4 year group, but in this case the risk of contracting diarrheal disease is 2.5 times that faced by the total population, while the risk of dying is only twice that of the total population.
The 5-14 and 15-49 year age groups have relatively low morbidity and mortality rates, particularly the 15-49 year group (mortality rate 0.24 per 100,000 inhabi-tants).
The 50 and older group has the lowest morbidity rate but follows the 1-4 year group in terms of mortality. Even so, the risk of dying from diarrheal diseases is lower in this group than for the total population and the deaths are associated with other debilitating factors in this age group.
(Source: Boletín Epidemiológico, Vol. IV (4), 1979, Ministry of Health of Panama.
7970
Meningitis in Brazil, 1976-1978
The number of Brazilian states participating in the meningitis epidemiologic surveillance system has in-creased steadily since 1976. To the 14 states that were participating in the system that year, five were added in 1977 and two more in 1978, raising the total to 21.
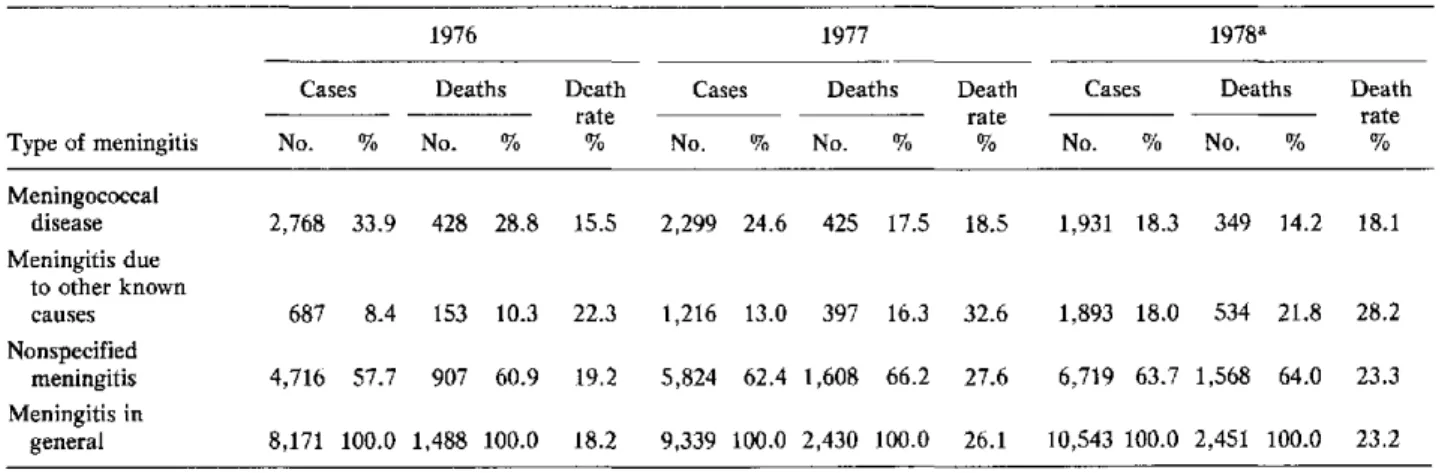
The cases were classified into three major groups for study: meningococcal meningitis, meningitis from other known causes, and unspecified meningitis. The three groups taken together were designated as meningitis in general.
From 1976 to 1978, the number of cases of menin-gococcal meningitis declined by nearly 50 percentage points as a percentage of the number of cases of meningi-tis in general (Table 1); however, the proportion of men-ingitis due to other known causes more than doubled. These changes reflect a trend of the disease to regress to the endemic levels prevailing before the latest epidemic. They also indicate a progressive increase in the number of cases in the second group, which in turn suggests a better use of the laboratories for diagnosis.
The high proportion of cases of unspecified meningitis may be a consequence of the inclusion in the system of new reporting areas served by personnel having less
ex-perience with the problem, or of the inability to perform a laboratory test to determine the causative species.
The mortality rates in 1978 were lower than in 1977 but higher than in 1976 (Table 1).
Figure 1 shows the monthly meningitis mortality rates, in terms of number of cases per 100,000 inhabitants reported in Brazil each month during the period under study. Individual rates are shown for each etiologic group. It will be noted that the number of cases of men-ingococcal meningitis increased in the coldest months (from May to August), while the number of'cases due to other known causes tended to increase in the warmest months (from September to January).
According to the data for 1977, of the total of 2,299 cases of meningococcal disease, 1,920 (83.5 per cent) were classified as meningococcal meningitis and 379 (16.5 per cent) as meningococcemia; 498 and 123, respectively, occurred in the municipalities including the state capital; and 1,422 and 256, respectively, in other municipalities of the state (Table 2). The fatality rates for meningococcal disease (18.5 per cent), meningococ-cal meningitis (15 per cent), and meningococcemia (36.1 per cent) were all higher than in 1976. The same holds 10
.
Table 1. Number of cases, deaths, and death rate, by type of meningitis, Brazil, 1976-1978.
1976 1977 1978a
Cases Deaths Death Cases Deaths Death Cases Deaths Death
rate rate rate
Type of meningitis No. % No. % % No. % No. % % No. % No. % %
Meningococcal
disease 2,768 33.9 428 28.8 15.5 2,299 24.6 425 17.5 18.5 1,931 18.3 349 14.2 18.1
Meningitis due to other known
causes 687 8.4 153 10.3 22.3 1,216 13.0 397 16.3 32.6 1,893 18.0 534 21.8 28.2 Nonspecified
meningitis 4,716 57.7 907 60.9 19.2 5,824 62.4 1,608 66.2 27.6 6,719 63.7 1,568 64.0 23.3 Meningitis in
general 8,171 100.0 1,488 100.0 18.2 9,339 100.0 2,430 100.0 26.1 10,543 100.0 2,451 100.0 23.2
aProvisional data.
Figure 1. Cases per 100,000 population of meningococeal disease, meningitis of other deter-mined etiologies, nonspecified meningitis, and meningitis in general by month, Brazil, 1976-1978.
10.0
6.0 5.0 4.0
3.0
2.0
1.0 bsm~
J FMA M J J A S O N DJ FM 1976
mummmi Meningitis in general
--1,, Nonspecified meningitis
true when the municipalities including the state capital and other municipalities in the states are considered separately.
The distribution of cases of meningococcal disease in 1977 by age group, broken down by incidence in the municipalities including the state capital and other municipalities, is shown in Table 3. Of all the cases, 71.9 per cent occurred in the <15 year group, which was higher than in 1976 (68.6 per cent). In the municipalities including the state capital this proportion was substan-tially the same in each of the two years (76.7 and 76.6 per cent, respectively).
In the < 1 year age group the sharpest difference was observed between the proportion of cases registered in
1977
YEAR
1978
Meningococcal disease
...mui.. Meningitis of other determined etiologies
1977 (18.4 per cent) and in 1976 (13.9 per cent), which probably indicates that the incidence of meningococcal disease was regressing to endemic levels after the epidemic that began in 1971. This difference becomes more apparent when the rates per 100,000 inhabitants, adjusted by age group (Figure 2), are analyzed. It will be seen that for all age groups except the < 1 year group the rates in 1977 were lower than in 1976.
Table 2. Meningococcal disease cases and deaths in municipalities including the state capital and in other municipalities in 1977, and fatality rates in 1977 and 1976, by clinical form, Brazil. a
Capitals Other municipalities Total
Death rate Death rate Death rate
Cases Deaths (%) Cases Deaths (%) Cases Deaths (%)
No. and No. and No. and No. and No. and No. and
Clinical form (%) (%) 1977 1976 (%) (%) 1977 1976 (%) (%) 1977 1976 Meningococcal 498 70 14.1 12.8 1,422 218 15.3 12.9 1,920 288 15.0 12.9
meningitis (80.2) (62.0) (84.7) (69.9) (83.5) (67.8)
Meningococcemia 123 43 34.9 31.4 256 94 36.7 30.9 379 137 36.1 31.1 (19.8) (38.0) (15.3) (30.1) (16.5) (32.2)
Total 621 113 18.2 17.9 1,678 312 18.6 14.7 2,299 425 18.5 15.5
(Meningococcal
disease) (100.0) (100.0) (100.0) (100.0) (100.0) (100.0)
a1976 data for 14 states; 1977 data for 19 states.
Table 3. Incidence of meningococcal disease, by age group, in municipalities including the state capital, in other municipalities, and total for 19 states, Brazil, 1977.
Capitalsa Other municipalities Total
% % %
Age Rate Rate Rate
group No. of Cumu- per No. of Cumu- per No. of Cumu- per
(years) cases Partial lative 100,000 cases Partial lative 100,000 cases Partial lative 100,000
< 1 140 21.0 21.0 27.8 282 17.3 17.3 13.3 422 18.4 18.4 16.1 1- 4 181 27.2 48.2 9.1 305 18.7 36.0 3.6 486 21.1 39.5 4.7 5- 9 120 18.0 66.2 4.9 326 20.0 56.0 3.2 446 19.4 58.9 3.5 10-14 70 10.5 76.7 3.3 230 14.1 70.1 2.5 300 13.0 71.9 2.7 15-19 47 7.1 83.8 2.5 160 9.8 79.9 2.1 207 9.0 80.9 2.2 20-39 78 11.7 95.5 1.8 206 12.6 92.5 1.1 284 12.4 93.3 1.2 40 + 29 4.4 99.9 0.9 90 5.5 98.0 0.7 119 5.2 98.5 0.7 Unknown 1 0.1 100.0 - 34 2.0 100.0 - 35 1.5 100.0
-Total 666 100.0 - 4.3 1,633 100.0 - 2.3 2,299 100.0 - 2.7
aExcept Curitiba, the data for which refer to the entire metropolitan area (+45 cases).
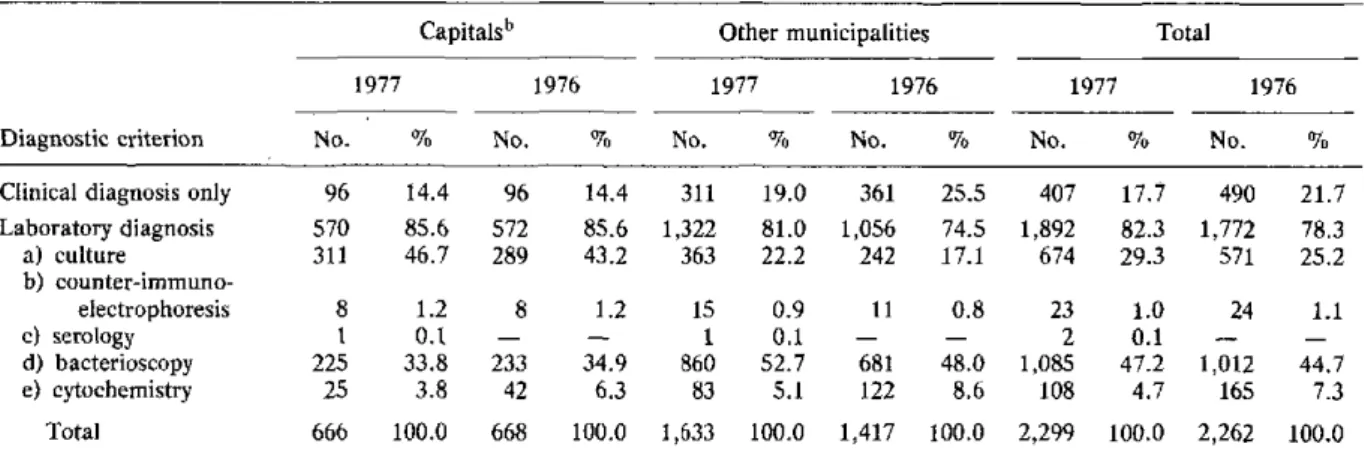
Table 4. Number and percentage of cases of meningococcal diseases in the municipalities including
the state capital and in other municipalities, classified according to diagnosis confirmation criterion, Brazil, 1977 and 1976.a
Capitalsb Other municipalities Total
1977 1976 1977 1976 1977 1976
Diagnostic criterion No. % No. % No. % No. % No. % No. %
Clinical diagnosis only 96 14.4 96 14.4 311 19.0 361 25.5 407 17.7 490 21.7 Laboratory diagnosis 570 85.6 572 85.6 1,322 81.0 1,056 74.5 1,892 82.3 1,772 78.3 a) culture 311 46.7 289 43.2 363 22.2 242 17.1 674 29.3 571 25.2
b)
counter-immuno-electrophoresis 8 1.2 8 1.2 15 0.9 11 0.8 23 1.0 24 1.1
c) serology 1 0.1 - - 1 0.1 - - 2 0.1 -
-d) bacterioscopy 225 33.8 233 34.9 860 52.7 681 48.0 1,085 47.2 1,012 44.7 e) cytochemistry 25 3.8 42 6.3 83 5.1 122 8.6 108 4.7 165 7.3
Total 666 100.0 668 100.0 1,633 100.0 1,417 100.0 2,299 100.0 2,262 100.0 a1976: 14 states; 1977: 19 states.
bExcept Curitiba, the data for which refer to the entire metropolitan area (+45 cases).
.
12
Figure 2. Incidence of meningococcal disease (rates per 100,000) by age-groups, Brazil, 1976 and 1977.
u,
1--fi::
17.0
I16.0
15.0
14.0
13.0
12.0
11.0
10.0
9.0
8.0
7.0
6.0
5.0
4.0
3.0
2.0
1.0
AGE-GROU PS
-- ~- 1976 - 1977
years. In addition, there was an increase in the utiliza-tion of culture tests both in the capitals and in other municipalities, as well as in the use of spinal fluid bacterioscopy in municipalities other than those includ-ing the state capital. This test continued to be the most commonly used laboratory test for the confirmation of cases in 1977.
In 1977 the samples for 447 cases from 10 of the 19 states that supplied information were submitted for a determination of Neisseria meningitidis serogroups. (In 1976, 11 of the 14 states supplied this type of data.) In 322 (72 per cent) of the total number of cases the serogroups were identified, in 120 cases (26.8 per cent) a classification was not possible, and in 5 (1.2 per cent)
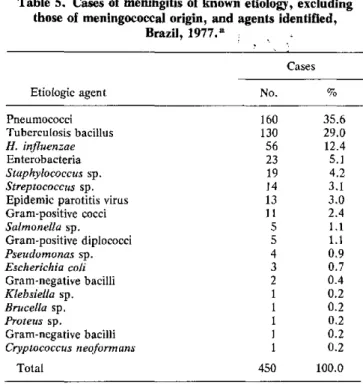
Table 5. Cases of meningitis of known etiology, excluding those of meningococcal origin, and agents identified,
Brazil, 1977.a
Cases Etiologic agent No. % Pneumococci 160 35.6 Tuberculosis bacillus 130 29.0
H. influenzae 56 12.4
Enterobacteria 23 5.1
Staphylococcus sp. 19 4.2
Streptococcus sp. 14 3.1 Epidemic parotitis virus 13 3.0 Gram-positive cocci 11 2.4
Salmonella sp. 5 1.1
Gram-positive diplococci 5 1.1
Pseudomonas sp. 4 0.9
Escherichia coli 3 0.7
Gram-negative bacilli 2 0.4
Klebsiella sp. 1 0.2
Brucella sp. 1 0.2
Proteus sp. 1 0.2
Gram-negative bacilli 1 0.2
Cryptococcus neoformans 1 0.2
Total 450 100.0
aSupplementary information supplied by the departments of health of 14 states.
other serogroups were determined to be the causative agent but were not specifically reported.
Some 65.2 per cent of the cases corresponded to serogroup A, 30.1 per cent to serogroup C, and 4.7 per cent to serogroup B. There was an increase in the propor-tion of serogroup A cases compared to that in 1976, a year in which the percentages registered for the three groups were 58.9, 37.3, and 3.8, respectively.
Of the 1,216 cases of known etiology, excluding me-ningococcal origin, supplementary information was ob-tained in 1977 on the etiologic agent identified in 450 cases from 14 states (Table 5): 64.6 per cent of the cases corresponded to meningitis due to pneumococci and to tuberculosis bacillus (35.6 and 29 per cent, respectively).
(Source: Boletim Epidemiológico, Vol. XI (18 and 20), 1979. Ministry of Health of Brazil.)