Controlled Syringe Combined with UHPLC for
Assessment of Urinary Biomarkers of Oxidatively
Damaged DNA
Berta Mendes1,2, Pedro Silva1,2, Fernando Aveiro3, Jorge Pereira1, Jose´ S. Caˆmara1,2*
1CQM - Centro de Quı´mica da Madeira, Centro de Cieˆncias Exatas e da Engenharia, Universidade da Madeira, Funchal, Portugal,2Centro de Cieˆncias Exatas e da Engenharia, Universidade da Madeira, Funchal, Portugal,3SESARAM, Hospital Dr. Ne´lio Mendonc¸a, Funchal, Portugal
Abstract
The formation of reactive oxygen species (ROS) within cells causes damage to biomolecules, including membrane lipids, DNA, proteins and sugars. An important type of oxidative damage is DNA base hydroxylation which leads to the formation of 8-oxo-7,8-dihydro-29-deoxyguanosine (8-oxodG) and 5-hydroxymethyluracil (5-HMUra). Measurement of these bio-markers in urine is challenging, due to the low levels of the analytes and the matrix complexity. In order to simultaneously quantify 8-oxodG and 5-HMUra in human urine, a new, reliable and powerful strategy was optimised and validated. It is based on a semi-automatic microextraction by packed sorbent (MEPS) technique, using a new digitally controlled syringe (eVolH), to enhance the extraction efficiency of the target metabolites, followed by a fast and sensitive ultrahigh pressure liquid chromatography (UHPLC). The optimal methodological conditions involve loading of 250mL urine sample (1:10
dilution) through a C8 sorbent in a MEPS syringe placed in the semi-automatic eVolHsyringe followed by elution using 90mL of 20% methanol in 0.01% formic acid solution. The obtained extract is directly analysed in the UHPLC system using
a binary mobile phase composed of aqueous 0.1% formic acid and methanol in the isocratic elution mode (3.5 min total analysis time). The method was validated in terms of selectivity, linearity, limit of detection (LOD), limit of quantification (LOQ), extraction yield, accuracy, precision and matrix effect. Satisfactory results were obtained in terms of linearity (r2.
0.991) within the established concentration range. The LOD varied from 0.00005 to 0.04mg mL21and the LOQ from 0.00023
to 0.13mg mL21. The extraction yields were between 80.1 and 82.2 %, while inter-day precision (n =3 days) varied between 4.9 and 7.7 % and intra-day precision between 1.0 and 8.3 %. This approach presents as main advantages the ability to easily collect and store urine samples for further processing and the high sensitivity, reproducibility, and robustness of eVolHMEPS combined with UHPLC analysis, thus retrieving a fast and reliable assessment of oxidatively damaged DNA.
Citation:Mendes B, Silva P, Aveiro F, Pereira J, Caˆmara JS (2013) A Micro-Extraction Technique Using a New Digitally Controlled Syringe Combined with UHPLC for Assessment of Urinary Biomarkers of Oxidatively Damaged DNA. PLoS ONE 8(3): e58366. doi:10.1371/journal.pone.0058366
Editor:Susanne Krauss-Etschmann, Ludwig-Maximilians-University Munich, Germany
ReceivedAugust 24, 2012;AcceptedFebruary 4, 2013;PublishedMarch 6, 2013
Copyright:ß2013 Mendes et al. This is an open-access article distributed under the terms of the Creative Commons Attribution License, which permits unrestricted use, distribution, and reproduction in any medium, provided the original author and source are credited.
Funding:The authors thank the financial support of FEDER (Transnational Cooperation MAC 2007–2013 Program) through VinSaudeMAC project (MAC/1/M105) and Fundac¸a˜o para a Cieˆncia e a Tecnologia (FCT) through the Strategic Plan PEst-OE/QUI/UI0674/2011, and the Portuguese Mass Spectrometry Network - RNEM 2013 (REDE/1508/RNEM/2005). The funders had no role in study design, data collection and analysis, decision to publish, or preparation of the manuscript.
Competing Interests:The authors have declared that no competing interests exist.
* E-mail: jsc@uma.pt
Introduction
Oxidative stress results from an imbalance between the generation of reactive oxygen species (ROS) and antioxidant defences. It occurs when excessive production of ROS overwhelms the antioxidant defence system, when there is any condition affecting the antioxidant defences or a combination of both factors [1,2]. Oxidative stress is known to cause damage to biomolecules, namely membrane lipids, DNA, proteins and sugars, a condition known as oxidative damage. This damage is particularly harmful to DNA when there are mutations in tumour suppressor genes that are not corrected, triggering critical initial events in carcinogenesis [3]. This attack to DNA generates a wide range of base and sugar modification products that include single- or double-stranded DNA breaks, purine, pyrimidine, or deoxyribose modifications, and DNA cross-links (reviewed in [4]). Over one hundred of such oxidatively modified DNA forms have been characterised in vitro
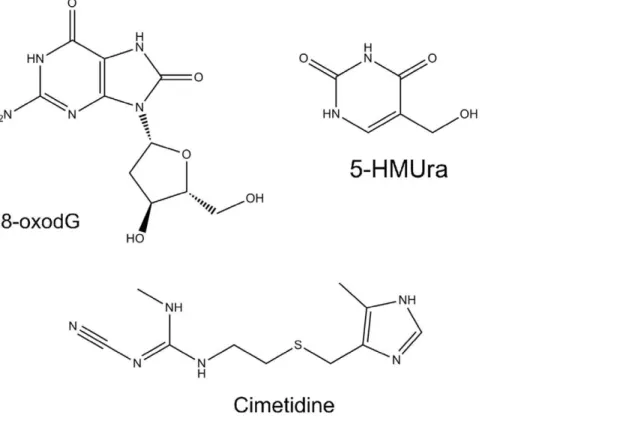
found in mutated oncogenes and tumour suppressor genes [6]. Moreover, elevated levels of oxidative DNA lesions, namely 8-oxodG, have been noted in various tumours, strongly implicating such damage in the etiology of cancer, most probably in the initiation process [11]. Although less studied, 5-HMUra is another important and frequent oxidative DNA lesion and can result from the hydroxylation of thymine, forming the HmU:A mismatched base pair, or hydroxylation followed by deamination of 5-methylcytosine, resulting in HmU:G base pair formation [12,13]. Therefore, 5-HMUra is also used to assess oxidative damage to DNA [14]. In Figure 1 are represented the structures of both biomarkers.
The extraction methods developed for the analysis of bio-markers of oxidatively modified DNA, generally, includes extrac-tions with solvents, clean-up and further fractionation by liquid– liquid extraction (LLE) [15], or solid phase extraction (SPE) [16,17]. However, these procedures are quite time-consuming and need a relatively high volume of solvent/sample, which is impractical for the routine analyses. In clinical laboratories the main requirements for sample preparation are celerity, simplicity and miniaturisation of the experimental procedures, especially when using small sample volumes and organic solvents, while maintaining sufficient selectivity, precision and accuracy [18]. Microextraction by packed sorbent (MEPS), as a miniaturised SPE, was a logical extension of that technique for the sample preparation of biological fluids, presenting several advantages. It can handle both small sample and large volumes (from 10mL up to 1000mL) and is suitable for normal phases, reversed phases, mixed mode and ion exchangers. Therefore, MEPS can substitute most existing methods using SPE just by scaling down the solvents and sample volumes. This approach is much less expensive because the MEPS syringe can be used several times, up to 100
times or more, while conventional SPE columns and cartridges are used only once. Moreover, its utilisation prior to liquid chroma-tography is an excellent tool for screening the presence of drugs and metabolites in blood, plasma and urine samples. It was already used to extract a wide range of analytes of interest in biological matrices, namely antiepileptic [19] and psychotropic drugs, local anaesthetics and their metabolites, anticancer drugs and the neurotransmitters dopamine and serotonin (reviewed in [20]).
Current quantification methods for 8-oxodG analysis are mainly immunological (enzyme-linked immune sorbent (ELISA) assays [21,22]) or chromatographic (HPLC with electrochemical detection (HPLC-ECD) [23], capillary electrophoresis with electrochemical detection (CE-ECD) [24], HPLC coupled to mass spectrometry detection with electrospray ionisation (HPLC-ESI-MS/MS) [25], or gas chromatography coupled with mass spectrometry detection (GC-MS) [24]). In turn, 5-HMUra quantification has been reported only a few times and using a GC-MS approach [13,26,27]. The improvement of HPLC technology leads to UHPLC development that very rapidly became a new standard in separation sciences. Very recently, Lamet al.(2012) presented a methodology to quantify 8-oxodG in several human fluids using UPLC-MS/MS [28].
The present research study reports, for the first time, to the best of our knowledge, the development and validation of an ultrafast, efficient, sensitive, reliable and high throughput MEPS eVolH -based methodology in combination with UHPLC–PDA for the simultaneous determination of two urinary biomarkers of oxida-tively damaged DNA, 5-HMUra and 8-oxodG, in cancer (lung and breast) patients and healthy subjects (control). Chromato-graphic conditions were optimised in order to achieve increased sensitivity and high resolution on the target metabolites while maintaining reduced analysis time (less than 3.50 min). The levels
Figure 1. Chemical structures of 8-hydroxy-29-deoxyguanosine (8-oxodG), 5-hydroxymethyluracil (5-HMUra) and cimetidine (used as internal standard - IS).
of the metabolites are evaluated and compared in order to determine their potential for cancer diagnosis as a first approach. We then compared the alterations in the oxidatively damaged DNA profiles between the cancer patients and the controls using univariate and multivariate analyses.
Materials and Methods
Ethics Statement
All cancer patients and healthy subjects gave their written informed consent for inclusion in the study and the research was approved by the Ethics Committee of the Dr. Ne´lio Mendonc¸a Hospital (Funchal, Portugal), being done in accordance with the Good Clinical Practice guidelines and with the ethical guidelines of the 1975 Declaration of Helsinki. All data were analysed anonymously throughout the study.
Subjects and Sample Collection
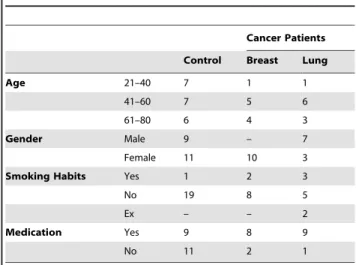
The subjects were divided into healthy subjects (control group) and cancer (breast and lung) patients. The characterisation of the groups is shown in Table 1.
The normal controls (n =20, age = 48.7617.6 y) were selected among the blood donors at the Dr. Ne´lio Mendonc¸a Hospital and had no clinical history of cancer. The patients (breast cancer n =10, age = 57.1 6 11.7 y; lung cancer, n =10, age = 54.8 6 10.8 y) underwent different diagnostic procedures, such as breast physical examination, mammography and ultrasonography, mag-netic resonance imaging and chest X-ray and finally histologically diagnosed with primary cancer by the Haematology–Oncology Unit of the Dr. Ne´lio Mendonc¸a Hospital.
Each individual (either patient or healthy volunteer) provided a sample of morning urine (after overnight fasting) in a 20 mL sterile PVC container. The samples were immediately frozen at
280uC and kept until being processed.
Standard Preparation and Urine Samples
Individual standard solutions of oxidatively damaged DNA biomarkers (1000mg mL21) were prepared in pure water, aliquot in 4 mL vials, and stored at220uC. Under these conditions they were stable for at least 4 months (as assessed by UHPLC). Working standard solutions containing the oxidative stress biomarkers were prepared daily from the individual stock solutions by diluting them
in the synthetic urine (SU, prepared as described by Uppuluriet al. [29]).
The ranges of concentrations (see Table 2) were selected according to the sensitivity of the UHPLC–PDA towards each biomarker (as the physical-chemical characteristics of each compound affect its analytical signal, higher concentrations had to be used for some compounds in order to be possible their detection). In all measurements (standards and samples) cimetidine was used as internal standard (IS). All samples were analysed in triplicate and their pH previously adjusted to 6 with 0.1 M sodium hydroxide or 0.01 % formic acid and filtered through 0.22mm membrane PTFE filters.
MEPS Extraction using eVolH
The MEPS procedure was carried out with an eVolH semi-automatic syringe (SGE Analytical Science, Melbourne, Australia), consisting of a 500mL gas-tight syringe with a removable needle. The syringe was fitted with a BIN containing 4 mg of the sorbent material through which samples and solutions were
Table 1.The characteristics of subjects (Age, Gender, Smoking habits, Medication).
Cancer Patients
Control Breast Lung
Age 21–40 7 1 1
41–60 7 5 6
61–80 6 4 3
Gender Male 9 – 7
Female 11 10 3
Smoking Habits Yes 1 2 3
No 19 8 5
Ex – – 2
Medication Yes 9 8 9
No 11 2 1
doi:10.1371/journal.pone.0058366.t001
Table 2.Figures of merit of the newly developed eVolH -MEPS/UPLC-PDA methodology.
Biomarkers 5-HMUra 8-oxodG
Peak number 1 3
RT (min) 1.05 1.80
lmaxa(nm) 215 295
Analytical performance
Conc. range (mg mL21) 0.0005 – 0.01 0.1–5
Regression equation y= 1277.5x+0.8318 y= 0.0724x+0.0052
br2 0.9906 0.9946
LODc(
mg mL21) 0.00005 0.04
LOQd(
mg mL21) 0.00023 0.13
% Matrix effect 80.1 82.2
Fortification level (mg mL21)eLL 0.0005 0.1
ML 0.0025 1.5
HL 0.01 5.0
Accuracy (%)e LL 91.0 94.7
ML 95.5 96.8
HL 104.7 103.5
Extraction yield (%)e LL 89.4 63.5
ML 98.5 73.7
HL 99.9 101.8
Intra-day (n = 7) RSD(%)e LL 5.7 8.3
ML 4.2 4.8
HL 0.9 2.0
Inter-day (n = 25) RSD(%)e LL 7.7 6.1
ML 7.7 5.8
HL 6.1 4.9
aMaximum absorbance values obtained in the PDA system detection; bCorrelation coefficient, give an estimating how well the experimental points fit
a straight line;
cLimit of detection;
dLimit of quantification. Values obtained from ordinary least-squares regression
data.
eConcentration levels used in eVolHMEPS/UPLC-PDA validation studies: LL-low level; ML- medium level; HL- high level.
discharged. A SU sample spiked with known amounts of oxidative stress biomarkers was used to optimize the MEPS procedure. The flow rate during aspiration was limited to 20mL s21 to prevent cavitation. This also increases analyte/sorbent contact time and extraction efficiency. All optimization procedures were carried out in triplicate. Before each use, the sorbent was conditioned with 100mL of methanol followed by 0.01 % formic acid. This step activates the sorbent and ensures reproducible retention of the analytes between extractions, decreasing memory effects (carry-over) [20].
UHPLC-PDA Analysis and Operating Conditions
The analysis of oxidative stress biomarkers were carried out on a Waters Ultra Performance Liquid Chromatographic Acquity system (UPLC, Acquity H-Class) (Milford, MA, USA) combined with a Waters Acquity quaternary solvent manager (QSM), an Acquity sample manager (SM), a column heater, a PDA detector, and a degassing system. The whole configuration was driven by Empower software v2.0 (Waters Corporation). Optimum separa-tion was achieved with a binary mobile phase which consisted of (A) water at 0.01% formic acid, and (B) methanol, with a constant flow rate of 250mL min21, giving a maximum back pressure of 6.000 psi, which is within the capabilities of the UHPLC. The extracts (2mL) were injected into the UPLC system, equipped with an Acquity UPLCTM strength silica HSS T3 analytical column (1.8mm particle size, 2.16100 mm) protected with an Acquity UPLCTM HSS T3 Van GuardTM Pre-column (Waters, Milford, USA). The column temperature was thermostated at 30uC and the samples were kept at 15uC in the sample manager. The sample analysis was performed with an isocratic flow of 80 % A at 250mL min21 during 3.50 min followed by a re-equilibration time of 3 min. All solvents and samples were filtered through 0.22mm PTFE filters (Millipore, Milford, USA), before use. For quantifi-cation purposes the PDA detection was conducted by using four distinct channels that were set to the maximum absorbance wavelength of each biomarker, as indicated in Table 2. They were identified by comparing the retention time and spectral char-acteristics of their peaks.
Method Validation Design
The eVolHMEPS/UHPLC-PDA newly developed method for determination of urinary biomarkers of oxidatively damaged DNA was fully validated in terms of selectivity, linearity, limits of detection (LOD) and quantification (LOQ), inter- and intra-day precision, accuracy, extraction efficiency and matrix effect (Table 2). The selectivity of the method was assessed by the absence of interfering peaks at the elution times of 5-HMUra and 8-oxodG. Method linearity was evaluated by constructing three calibration curves (the peak areaanalyte/peak areaISratios obtained were plotted against the corresponding standard concentration) for each biomarker using standard solutions prepared in SU from individual stock solutions. It were prepared eight different concentration levels in triplicate for each point (n= 9), including zero point, in order to cover the whole working range (Table 2). The zero point (unspiked SU) enables the verification that none of the compounds showed residual level or background signal. The sensitivity of the method was assessed by determining the LOD (the lowest analyte concentration that produces a response detect-able above the noise level of the system) and LOQ (the lowest level of analyte that can be accurately and precisely measured) for each compound. LOD and LOQ were calculated with the data generated in the linearity studies, being LOD defined as (a+3Sa/
b) and LOQ as (a+10Sa/b), where ‘‘a’’ represents origin ordinate, ‘‘Sa’’ the origin ordinate variance and ‘‘b’’ the slope [30]. These
parameters were calculated for each analyte from the standard solutions used to obtain the corresponding calibration curves, using the developed UHPLC method.
Precision is a function of the concentration and describes the closeness of agreement between series of measurements, facilitat-ing comparisons of variability at different concentrations. Method precision was evaluated by spiking a SU at three different concentration levels, corresponding to the low level (LL), medium level (ML) and highest point (HL) of the calibration curve of each biomarker (Table 2). Six replicates (n= 6) were performed in the same day to obtain repeatability (intra-day precision). For inter-day precision (intermediate precision) evaluation, the same protocol was followed but six replicates of each level were analysed daily through three different days (n =24).
In order to check the accuracy of the proposed method a recovery study was carried out by spiking SU, in triplicate at three concentration levels corresponding to the LL, ML and HL (Table 2), and subjected to the eVolHMEPS procedure above (section 2.4.1). The recovery values were calculated according to the following formula:Accuracy =1006([analyte]after spiking–
[analyte]-before spiking)/[analyte]added; where [analyte]after spikingis the analyte concentration measured in spiked urine; [analyte]before spikingis the analyte concentration measured in unspiked urine, and
[analy-te]addedis the nominal concentration of the analyte added to urine.
Extraction efficiency (EE) was determined by replicate analysis (n =3) of SU spiked with oxidative stress biomarkers at three concentration levels (LL, ML, and HL;seeTable 2) and submitted to eVolHMEPS procedure (CSU_MEPS); a second set of different aliquots of SU was submitted to eVolHMEPS and the extracts spiked with the 5-HMUra and 8-oxodG biomarkers at LL, ML, and HL concentration levels (CSU). The peak area ratio obtained for spiked SU matrix before and after eVolHMEPS was used to calculate the corresponding concentration through regression analysis (interpolation of signals in calibration graphs). The matrix effect was evaluated by the percentage of the quotient between the slopes of the standards in blank matrix (SU) and those obtained by spiking urine (standard addition method).
Statistical Analysis
Significant differences among the three extraction techniques were assessed with a one-way analysis of variance (ANOVA) using a SPSS Program, version 19.0 (SPSS Inc. Headquarters, Chicago IL, USA). Figures and tables were generated using Microsoft Office Excel 2007 (Microsoft Corporation, Redmond, WA, USA).
Results
Optimisation of the MEPS Procedure
The influence of pH on the extraction efficiency was evaluated by assaying samples with pH adjusted to 2, 6 and 8 (using 0.1M sodium hydroxide solution or 0.01% formic acid). The results (Figure 2B) showed that pH 2 enables the best results for 5-HMUra, while pH 6 is slightly better for 8-oxodG. However, the peak resolution for both biomarkers is much better at pH 6 (data not shown) and urine pH usually range between 6 and 7 [31]. Therefore, pH 6 was chosen to perform the analytical extraction of the target biomarkers. The effect of the number of extraction cycles (extract–discard) and sample volume on extraction efficien-cy of the biomarkers was shown in Figure 2C. The best result for 5-HMUra was obtained with five extraction cycles for 50mL or 250mL of sample volume, while for 8-oxodG were five extraction cycles for 50mL and ten extraction cycles for 100 or 250mL of sample volume. As there was no significant improvement in the two biomarkers extraction efficiency by using higher sample volumes, five extraction cycles of 50mL sample volume loading were used. This choice of using low sample volume loads several times (5) has additional advantages of extending the lifetime of the MEPS cartridge and minimisation of possible interferences of other urine compounds in the target biomarkers quantification. The elution conditions were also assayed and, as shown in Figure 2D, the extraction efficiency was not significantly affected by the increase in the number or volume of elutions. Therefore, it was chosen to elute the target analytes with three times 30mL of methanol / 0.01 % formic acid (elution solution).
Method Validation
The method performance parameters were calculated for each biomarker using concentrations usually found in human urine. The validation parameters are shown in Table 2.
The selectivity of the new approach was assessed by the absence of interference in the same chromatographic windows as examined
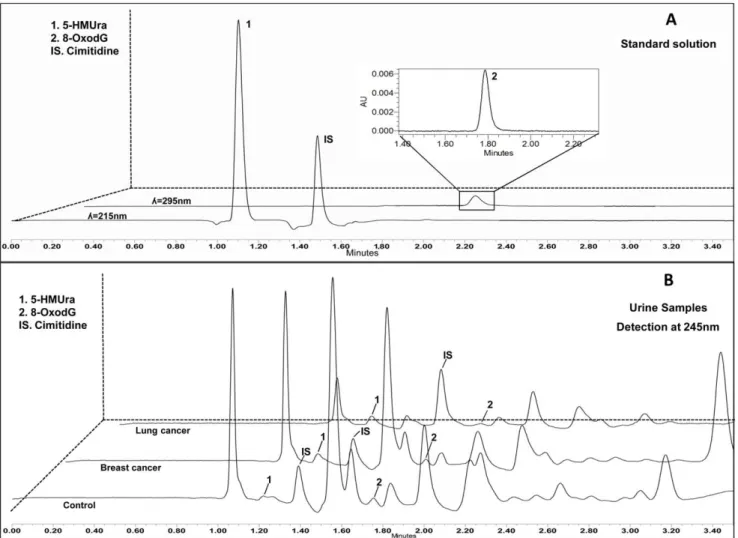
in a solution of standards of both biomarkers and analysis of ‘‘blank matrices’’ (SU). No interfering peaks were observed in the blank chromatograms at the quantification wavelengths (215 and 295 nm for 5-HMUra and 8-oxodG, respectively, see Figure 3).
Linearity of the method was established on spiked urine samples prepared and analysed using the described extraction procedure in the range of 0.005–0.01mg mL21 for 5-HMUra and 0.1–5mg mL21 for 8-oxodG (six calibrators evenly distributed, three replicates). The UHPLC–PDA system gave linear response over the studied range of concentrations and the least-squares linear regression analysis of the data provided excellent correlation coefficient values for 5-HMUra (r2.0.9906) and 8-oxodG (r2.
0.9946). The calibration was performed by using SU spiked with the calibration standards prepared as previously described (Material and Methods). The eVolHMEPS/UHPLC–PDA meth-odology allows very low detection (0.00005mg mL21and 0.04mg mL21) and quantification limits (0.00023 and 0.13mg mL21) for 5-HMUra and 8-oxodG, respectively. This sensitivity is sufficient to quantify the target biomarkers in biological fluids.
The precision values are satisfactory, with relative standard deviation (RSD) values lower than 8.5 % for each measured analyte at all spiking levels (Table 2). The intra-day precision at the three different levels ranged from 1.0 % (5-HMUra at HL concentration) to 8.3 % (8-oxodG at LL concentration), while the inter-day precision varied from 5.0 % (8-oxodG at HL concen-tration) to 7.7 % (5-HMUra at ML concenconcen-tration).
The accuracy of the method was determined according to the equation presented in method validation design section. The mean accuracies obtained for the target biomarkers (n =6) at each fortification level are listed in Table 2. At high concentrations, the results were satisfactory and ranged between 95.5 % and 104.7 %, and at low concentrations the recovery was slightly lower (91.0 %). The results showed that the absolute extraction yield increased
Figure 2. Optimisation results of the eVolHMEPS extraction methodology for quantification of oxidatively damaged DNA biomarkers in urine.(A) Comparison the performance characteristics (relative peak areas - AC/AIS, obtained for each adsorbent) of different MEPS adsorbents for isolation of target DNA damage biomarkers from urine; (B) effect of pH value on the extraction efficiency; (C) influence of number of extraction cycles (extraction-discard) as a function of applied sample volume; (D) effect of elution volume on UHPLC-PDA response. Errors bars show the standard deviation of the mean (n= 3).
slightly from low concentration levels (89.4 % for 5-HMUra, and 63.5 % for 8-oxodG) to medium (98.5 % 5-HMUra, and 73.7 % for 8-oxodG) and high concentration levels (99.9 % for 5-HMUra, and 91.0 % for 8-oxodG). To evaluate the impact of the matrix on the target analytes, the slopes obtained in the calibration with matrix-matched standards were compared with those obtained with solvent-based standards, calculating matrix/solvent slope ratios for each of both metabolites (Table 2). We consider that the matrix effect could be ignored if the matrix/solvent slope ratio values were in the range of 85 % – 110 %, below that limit, a matrix suppression effect is observed and above 110% there is matrix enhancement [32]. Based on the results obtained (80 % and 82 % for 5-HMUra and 8-oxodG, respectively) a moderate matrix effect was observed and, therefore, matrix-matched calibration solutions were used for quantification purposes, in order to compensate the referred errors.
Quantification of 8-oxodG and 5-HMUra by eVolHMEPS / UHPLC-PDA
The assays were carried out using SU as the development method matrix. After method validation, and in order to demonstrate its applicability, a total of forty urine samples (lung and breast cancer patients and healthy subjects) were analysed in triplicate. Both biomarkers were identified by the retention time
and UV spectra obtained at the maximum absorbance wavelength
(lmax =215 nm and 295 nm for 5-HMUra and 8-oxodG,
re-spectively). A typical chromatogram of control, lung and breast cancer patients urine obtained through eVolHMEPS / UHPLC-PDA developed methodology, is shown in Figure 3.
As can be observed, excellent peak shape and resolution were achieved with minimal interference from other components of the urine matrix. Moreover, all urine profiles are quite similar, despite the clinical condition of the donor, except for the concentrations of each biomarker analysed.
With respect to the controls, twenty urine samples (n =20), were analysed, and the mean values obtained of 2.96102463.0 (RSD (%))mg mL21and 1.9610216 4.4 (RSD (%)) mg mL21 for 5-HMUra and 8-oxodG, respectively. Regarding cancer patients, ten lung cancer patients (n =10) and ten breast cancer patients (n =10) were analysed. For lung cancer patients, the mean values obtained were 2.361024 6 3.2 (RSD (%)) mg mL21 and 2.661021 6 3.9 (RSD (%)) mg mL21 for 5-HMUra and 8-oxodG, respectively. With respect to the breast cancer patients, the mean concentrations were 3.16102462.6 (RSD (%))mg mL21 and 4.46102165.2 (RSD (%))mg mL21for 5-HMUra and 8-oxodG, respectively. These results can be more easily compared by viewing Figure 4.
Figure 3. Representative UHPLC-PDA chromatograms of a biomarker standard solution (5-HMUra at 0.0025mg mL21; 8-oxodG at
Discussion
The optimization of MEPS procedure involved several factors and conditions described in the previous section. The best cumulative sorbent for both biomarkers, C8, is in agreement with the fact that C2–C8 phases are more suitable for lipophilic analytes (non-polar) and polymeric phases such as polystyrene– divinylbenzene, while mixed mode phases (anion–cation exchange mode) are more suitable for polar analytes such as acidic and basic compounds [33]. Moreover, C8 sorbents present extra properties, allowing secondary interactions with polar groups from the analyte. However it should be noted that 8-oxodG is much more selective in the interaction with the stationary phases, with C2 and SIL retrieving very low responses when compared with remain sorbents. In turn 5-HMUra interacts more favourably with all sorbents (Figure 2). In MEPS, the retention of the analytes in the sorbent phase is affected by the number of extraction cycles performed and the speed applied. Experimentally, the multiple extraction cycles can be performed using the same aliquot (draw– eject in the same vial) or by drawing up from the aliquot and discarding in waste (extract–discard). This last option was selected in this study. Figure 2C shows that the competition for active adsorption sites of the C8 sorbent increased slightly until five extraction cycles. However, the volume of sample loading is not directly proportional to the increase of relative area.
Regarding the method performance, the results obtained demonstrated a good linearity for both biomarkers investigated, within the tested concentration range for the whole extraction and determination method. In general, acceptable recoveries and precision were obtained for 5-HMUra and 8-oxodG at three different spiked levels. Furthermore, optimised UHPLC-PDA offers good sensibility and selectivity for the target analytes.
The obtained results for the extraction yields showed low extraction efficiency at low concentration level (LL) for 5-HMUra and 8-oxodG, than those obtained with the middle (ML) and high (HL) fortification levels. The reason for this may be due to the fact that the surface chemistry of the sorbent can be altered by interfering compounds from urine and, therefore, sorption properties can change [34]. This effect is more pronounced at low concentrations of the analyte when the analyte/matrix ratio is
very low. The same behaviour was observed for the accuracy measurements. Despite this, the results show that eVolHMEPS/ UHPLC-PDA is a good methodology to quantify 5-HMUra and 8-oxodG in human urine. Unfortunately, there are no reference ranges for 8-oxodG and 5-HMUra in healthy or diseased individuals [35] and we can only compare our results with the ones reported by others using similar methodologies. In this respect, Harriet al.(2007) [15], using HPLC-MS/MS, reported lower values than ours for 8-oxodG (8-oxodG concentrations ranging from 0.16 to 16.48mg L-1, LOD = 0.005mg L21 and LOQ = 0.16mg L21). Regarding 5-HMUra, we only find one study [26] referring to the concentration of 121 pmol mL21for this biomarker, but using HPLC-GC-MS, which makes it very difficult to compare methodologies.
Forty human urine samples (20 normal controls; 10 lung cancer patients and 10 breast cancer patients) were used in the study. As shown in Figure 3, the separation of the standard mixture of the biomarkers of DNA oxidation is very fast, being achieved in less than 3.50 min. The chromatograms present a good peak shape and resolution was achieved for both compounds with no interference from urine matrix (Figure 3). The chromatograms obtained for control individuals and for breast and lung cancer patients showed quite similar profiles (Figure 3), since the concentrations of both biomarkers in the samples are very low to present any significant difference in the overall chromatogram. Accordingly, with these results, the concentration of 5-HMUra does not present significant differences between controls subjects and breast patients showing a slight decrease in lung cancer patients. In turn, 8-oxodG presents more pronounced differences between control, the lowest levels, lung cancer patients, in-termediate levels which are almost twice the control levels, and breast cancer patients, that present values that are three times higher than controls.
There are few studies showing that the levels of urinary 8-oxodG increases in breast and lung cancer patients [36,37,38], but to our knowledge, our study is the first one reporting the simultaneous quantification of 8-oxodG and 5-HMUra, using a MEPS-UHPLC-PDA approach, which is much more reliable than the referred studies using ELISA assays. Overall, the combination of eVolHMEPS together with quick UHPLC-PDA
Figure 4. Total concentration of oxidatively damaged DNA investigated biomarkers in normal controls, and in breast and lung cancer patients.
system, proved to be an improved strategy, with excellent recoveries, sensitivity, and repeatability, making it possible to use, as a rapid approach, to analyse the biomarkers present in human urine. Moreover, the combination of eVolH and MEPS offers improvements in workflow and accuracy of the extraction process, because, unlike conventional SPE columns, the MEPS sorbent bed can be easily integrated into a liquid-handling syringe, as the semiautomatic syringe eVolH, allowing for low void volume sample manipulations and the full automation of the sample processing, extraction and injection steps. Recently, Lam et al. [28] quantified 8-oxodG in several human matrices using a SPE-LC-MS approach. The methodology we are now proposing can be considered an improvement to Lam’s report because the use of MEPS instead of SPE certain would benefit their work. Furthermore, the methodology would be an alternative to assessing oxidative damage to DNA when MS detection is not available, as the MEPS-UHPLC approach presents enough sensitivity and is much less expensive, and is more environment-friendly than the previous one.
In summary, a robust, rapid and fully validated procedure is described for the detection and high-throughput quantification of oxidatively-damaged DNA biomarkers in human (healthy subjects and cancer patients) urine samples, using MEPS/UHPLC-PDA. This method has shown to be linear within the adopted ranges for both biomarkers, and presented adequate accuracy and precision. Furthermore, the procedure can be useful for those laboratories performing routine urine analysis in the field of both clinical and medicinal chemistry.
Author Contributions
Responsible for the sample transport, storage and treatment: BM JP. Helped draft the manuscript: BM JP. Responsible for the selection and patients contact and for the sample collection: FA. Performed the MEPS extractions, UHPLC analysis and participated in the data analysis: BM PS. Performed the coordination of the study: JC. Critically revised the manuscript: JC. Final approval of the version to be published: JC. Worked on the data analysis and interpretation of data: BM JP JC. Conceived and designed the experiments: JC.
References
1. Zhang J, Bowers J, Liu L, Wei S, Gowda GAN, et al. (2012) Esophageal Cancer Metabolite Biomarkers Detected by LC-MS and NMR Methods. PLoS One 7: e30181.
2. Pan X, Matsumura K, Opiekun M, Oka H, Vachani A, et al. (2010) Urinary Volatile Compounds as Biomarkers for Lung Cancer: A Proof of Principle Study Using Odor Signatures in Mouse Models of Lung Cancer. PLoS One 5: e8819. 3. Kang DH (2002) Oxidative stress, DNA damage, and breast cancer. AACN Clin
Issues 13: 540–549.
4. Valko M, Izakovic M, Mazur M, Rhodes CJ, Telser J (2004) Role of oxygen radicals in DNA damage and cancer incidence. Molecular and Cellular Biochemistry 266: 37–56.
5. Dizdaroglu M, Jaruga P, Birincioglu M, Rodriguez H (2002) Free radical-induced damage to DNA: mechanisms and measurement. Free Radical Biology and Medicine 32: 1102–1115.
6. Klaunig JE, Kamendulis LM (2004) The Role Of Oxidative Stress In Carcinogenesis. Annual Review of Pharmacology and Toxicology 44: 239–267. 7. Poulsen HE (2005) Oxidative DNA modifications. Experimental and
Toxico-logic Pathology 57, Supplement 1: 161–169.
8. Davis JD, Lin SY (2011) DNA damage and breast cancer. World J Clin Oncol 2: 329–338.
9. Brody JS, Spira A (2006) State of the art. Chronic obstructive pulmonary disease, inflammation, and lung cancer. Proc Am Thorac Soc 3: 535–537. 10. Cadet J, Loft S, Olinski R, Evans MD, Bialkowski K, et al. (2012) Biologically
relevant oxidants and terminology, classification and nomenclature of oxida-tively generated damage to nucleobases and 2-deoxyribose in nucleic acids. Free Radical Research 46: 367–381.
11. Valko M, Rhodes CJ, Moncol J, Izakovic M, Mazur M (2006) Free radicals, metals and antioxidants in oxidative stress-induced cancer. Chemico-Biological Interactions 160: 1–40.
12. Baker D, Liu P, Burdzy A, Sowers LC (2002) Characterization of the substrate specificity of a human 5-hydroxymethyluracil glycosylase activity. Chemical Research in Toxicology 15: 33–39.
13. Chen HJ, Wu CF, Huang JL (2005) Measurement of urinary excretion of 5-hydroxymethyluracil in human by GC/NICI/MS: correlation with cigarette smoking, urinary TBARS and etheno DNA adduct. Toxicol Lett 155: 403–410. 14. Djuric Z, Depper JB, Uhley V, Smith D, Lababidi S, et al. (1998) Oxidative DNA damage levels in blood from women at high risk for breast cancer are associated with dietary intakes of meats, vegetables, and fruits. J Am Diet Assoc 98: 524–528.
15. Harri M, Kasai H, Mori T, Tornaeus J, Savela K, et al. (2007) Analysis of 8-hydroxy-29-deoxyguanosine in urine using high-performance liquid chromatog-raphy-electrospray tandem mass spectrometry. Journal of Chromatography B 853: 242–246.
16. Chen H-JC, Wu C-F, Huang J-L (2005) Correlation with cigarette smoking, urinary TBARS and etheno DNA adduct. Toxicology Letters 155: 403–410. 17. Inaba Y, Koide S, Yokoyama K, Karube I (2011) Development of Urinary
8-Hydroxy-29-Deoxyguanosine (8-OHdG) Measurement Method Combined with SPE. Journal of chromatographic science 49: 303–309.
18. Vlcˇkova´ H, Rabatinova´ M, Miksˇova´ A, Kolouchova´ G, Micˇuda S, et al. (2012) Determination of pravastatin and pravastatin lactone in rat plasma and urine using UHPLC–MS/MS and microextraction by packed sorbent. Talanta 90: 22–29.
19. Rani S, Malik AK, Singh B (2012) Novel micro-extraction by packed sorbent procedure for the liquid chromatographic analysis of antiepileptic drugs in human plasma and urine. Journal of Separation Science 35: 359–366.
20. Abdel-Rehim M (2010) Recent advances in microextraction by packed sorbent for bioanalysis. Journal of Chromatography A 1217: 2569–2580.
21. Sova H, Jukkola-Vuorinen A, Puistola U, Kauppila S, Karihtala P (2010) 8-Hydroxydeoxyguanosine: a new potential independent prognostic factor in breast cancer. Br J Cancer 102: 1018–1023.
22. Chang D, Sha Q, Zhang X, Liu P, Rong S, et al. (2011) The Evaluation of the Oxidative Stress Parameters in Patients with Primary Angle-Closure Glaucoma. PLoS One 6: e27218.
23. Valavanidis A, Vlachogianni T, Fiotakis C (2009) 8-hydroxy-29-deoxyguanosine (8-OHdG): a critical biomarker of oxidative stress and carcinogenesis. Journal of Environmental Science and Health Part C 27: 120–139.
24. Mei S, Yao Q, Wu C, Xu G (2005) Determination of urinary 8-hydroxy-29 -deoxyguanosine by two approaches–capillary electrophoresis and GC/MS: An assay for in vivo oxidative DNA damage in cancer patients. Journal of Chromatography B 827: 83–87.
25. Hu J, Zhang W, Ma H, Cai Y, Sheng G, et al. (2010) Simultaneous determination of 8-hydroxy-29-deoxyguanosine and 5-methyl-29-deoxycytidine in DNA sample by high performance liquid chromatography/positive electro-spray ionization tandem mass spectrometry. Journal of Chromatography B 878: 2765–2769.
26. Ravanat JL, Guicherd P, Tuce Z, Cadet J (1999) Simultaneous determination of five oxidative DNA lesions in human urine. Chemical Research in Toxicology 12: 802–808.
27. Bianchini F, Hall J, Donato F, Cadet J (1996) Monitoring urinary excretion of 5-hydroxymethyluracil for assessment of oxidative DNA damage and repair. Biomarkers 1: 178–184.
28. Lam PM, Mistry V, Marczylo TH, Konje JC, Evans MD, et al. (2012) Rapid measurement of 8-oxo-7,8-dihydro-29-deoxyguanosine in human biological matrices using ultra-high-performance liquid chromatography-tandem mass spectrometry. Free Radical Biology & Medicine 52: 2057–2063.
29. Uppuluri P, Dinakaran H, Thomas DP, Chaturvedi AK, Lopez-Ribot JL (2009) Characteristics of Candida albicans biofilms grown in a synthetic urine medium. J Clin Microbiol 47: 4078–4083.
30. Gonc¸alves J, Mendes B, Silva CL, Caˆmara JS (2012) Development of a novel microextraction by packed sorbent-based approach followed by ultrahigh pressure liquid chromatography as a powerful technique for quantification phenolic constituents of biological interest in wines. Journal of Chromatography A 1229: 13–23.
31. Botello I, Borrull F, Calull M, Aguilar C, Somsen G, et al. (2012) In-line solid-phase extraction–capillary electrophoresis coupled with mass spectrometry for determination of drugs of abuse in human urine. Analytical and Bioanalytical Chemistry 403: 777–784.
32. Silva CL, Haesen N, Camara JS (2012) A new and improved strategy combining a dispersive-solid phase extraction-based multiclass method with ultra high pressure liquid chromatography for analysis of low molecular weight polyphenols in vegetables. Journal of Chromatography A.
33. Abdel-Rehim M (2011) Microextraction by packed sorbent (MEPS): a tutorial. Analytica Chimica Acta 701: 119–128.
34. Altun Z, Abdel-Rehim M (2008) Study of the factors affecting the performance of microextraction by packed sorbent (MEPS) using liquid scintillation counter and liquid chromatography-tandem mass spectrometry. Anal Chim Acta 630: 116–123.
35. Cooke MS, Olinski R, Loft S (2008) Measurement and meaning of oxidatively modified DNA lesions in urine. Cancer Epidem Biomar 17: 3–14.
patients. Mutation Research/Genetic Toxicology and Environmental Muta-genesis 631: 62–68.
37. Yano T, Shoji F, Baba H, Koga T, Shiraishi T, et al. (2009) Significance of the urinary 8-OHdG level as an oxidative stress marker in lung cancer patients. Lung Cancer 63: 111–114.