53
Appendices
Appendix 1: KLD Dimensions and Indicators
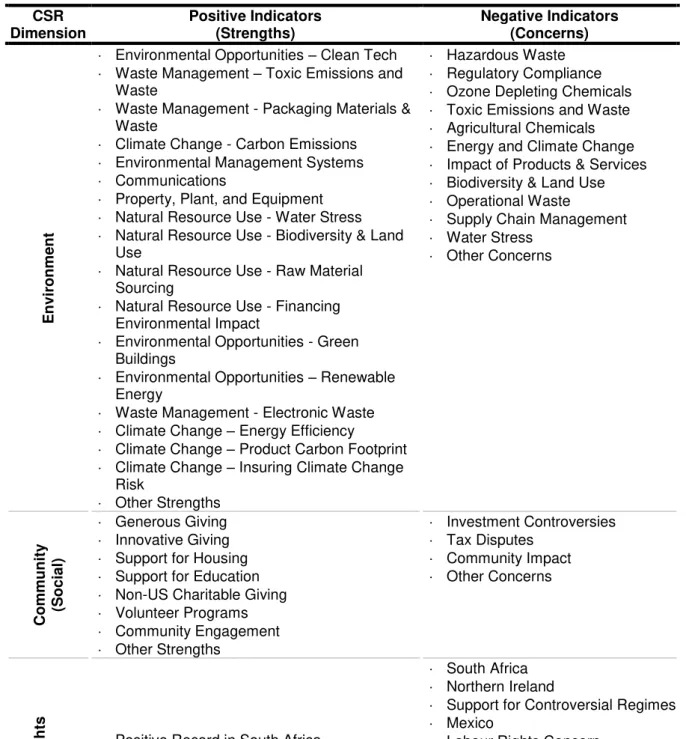
Table 18 – KLD Dimensions and Indicators from 1991 to 2014 CSR
Dimension
Positive Indicators (Strengths)
Negative Indicators (Concerns)
E
n
vir
o
n
m
ent
Environmental Opportunities – Clean Tech
Waste Management – Toxic Emissions and Waste
Waste Management - Packaging Materials & Waste
Climate Change - Carbon Emissions
Environmental Management Systems
Communications
Property, Plant, and Equipment
Natural Resource Use - Water Stress
Natural Resource Use - Biodiversity & Land Use
Natural Resource Use - Raw Material Sourcing
Natural Resource Use - Financing Environmental Impact
Environmental Opportunities - Green Buildings
Environmental Opportunities – Renewable Energy
Waste Management - Electronic Waste
Climate Change – Energy Efficiency
Climate Change – Product Carbon Footprint
Climate Change – Insuring Climate Change Risk
Other Strengths
Hazardous Waste
Regulatory Compliance
Ozone Depleting Chemicals
Toxic Emissions and Waste
Agricultural Chemicals
Energy and Climate Change
Impact of Products & Services
Biodiversity & Land Use
Operational Waste
Supply Chain Management
Water Stress
Other Concerns
Co
mm
u
n
it
y
(S
o
cia
l)
Generous Giving
Innovative Giving
Support for Housing
Support for Education
Non-US Charitable Giving
Volunteer Programs
Community Engagement
Other Strengths
Investment Controversies
Tax Disputes
Community Impact
Other Concerns
Hu
man
Righ
ts
(S
o
cia
l) Positive Record in South Africa Labour Rights Strength
Indigenous Peoples Relations Strength
Human Rights Policies & Initiatives
South Africa
Northern Ireland
Support for Controversial Regimes
Mexico
Labour Rights Concern
Freedom of Expression & Censorship
Human Rights Violations
Indigenous Peoples Relations Concern
Operations in Sudan
54
Source: Based on MSCI (2015)CSR Dimension Positive Indicators (Strengths) Negative Indicators (Concerns) E mp loye e Re latio n s (So ci al)
No-Layoff Policy
Retirement Benefits Strength
Compensation & Benefits
Employee Relations
Professional Development
Human Capital Development
Labour Management
Controversial Sourcing
Union Relations
Cash Profit Sharing
Employee Involvement
Employee Health & Safety
Supply Chain Labour Standards
Other Strengths
Workforce Reductions
Retirement Benefits Concern
Labour-Management Relations
Labour Rights& Supply Chain – Other Concerns
Union Relations Concerns
Health & Safety
Supply Chain
Child Labour
Dive rsity ( S o cia l)
CEO
Representation
Board of Directors - Gender
Work/Life Benefits Women & Minority Contracting
Employment of the Disabled
Gay & Lesbian Policies
Employment of Underrepresented Groups
Other Strengths
Representation
Board of Directors - Gender
Board of Directors - Minorities
Workforce Diversity
Other Concerns
P ro d u ct ( S o cia l)
Product Safety and Quality
R&D/Innovation
Social Opportunities – Access to Healthcare
Social Opportunities - Access to Finance
Social Opportunities - Access to Communications
Social Opportunities - Opportunities in Nutrition and Health
Product Safety - Chemical Safety
Product Safety – Financial Product Safety
Product Safety - Privacy and Data Security
Product Safety - Responsible Investment
Product Safety - Insuring Health and Demographic Risk
Other Strengths
Product Quality & Safety
Marketing & Advertising
Anticompetitive Practices
Customer Relations
Other Concerns
G o ve rn anc e
Limited Compensation
Ownership Strength
Reporting Quality
Political Accountability Strength
Public Policy
Corruption & Political Instability
Financial System Instability
Other Strengths
High Compensation
Ownership Concern
Accounting Concern
Reporting Quality
Political Accountability Concern
Public Policy
Bribery & Fraud
Governance Structures
Controversial Investments
55
Appendix 2: KLD Universe Coverage
Table 19 - KLD Universe Coverage
Data Set Universe
Time Series
Nr. of Companies
Universe A
1991-2014
650
Universe B
2008-2013
1000
Universe C
2001-2013
1100
Universe D
2003-2014
2400
Universe E
2013-2014
2600
Source: MSCI (2015)
Table 20 – Universe Definitions
Data Set Universe
Description
Universe A
MSCI KLD 400 Social Index + MSCI USA
Index
Universe B
Largest 1000 U.S. companies by market
capitalization
Universe C
MSCI KLD 400 Social Index + 1000 Largest
US Companies
Universe D
MSCI USA IMI Index
Universe E
Non-US Universe
56
Appendix 3: Research Constructs and Variables
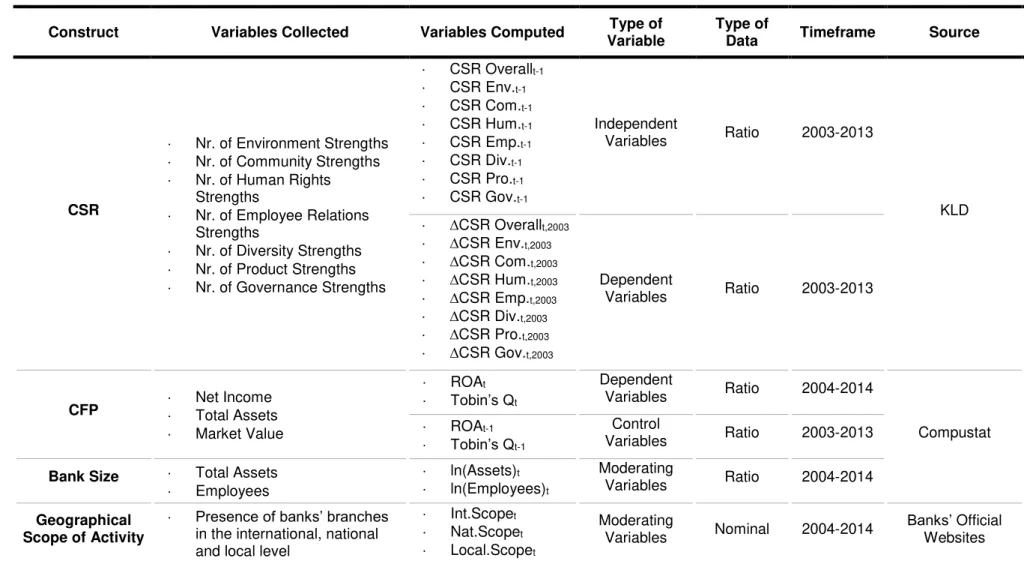
Table 21 – Research Constructs, Variables Collected and Variables Computed
Construct Variables Collected Variables Computed Type of Variable
Type of
Data Timeframe Source
CSR
Nr. of Environment Strengths
Nr. of Community Strengths
Nr. of Human Rights Strengths
Nr. of Employee Relations Strengths
Nr. of Diversity Strengths
Nr. of Product Strengths
Nr. of Governance Strengths
CSR Overallt-1 CSR Env.t-1 CSR Com.t-1 CSR Hum.t-1 CSR Emp.t-1 CSR Div.t-1 CSR Pro.t-1 CSR Gov.t-1
Independent
Variables Ratio 2003-2013
KLD
∆CSR Overallt,2003 ∆CSR Env.t,2003 ∆CSR Com.t,2003 ∆CSR Hum.t,2003 ∆CSR Emp.t,2003 ∆CSR Div.t,2003 ∆CSR Pro.t,2003 ∆CSR Gov.t,2003
Dependent
Variables Ratio 2003-2013
CFP Net Income Total Assets
Market Value
ROAt Tobin’s Qt
Dependent
Variables Ratio 2004-2014
Compustat
ROAt-1 Tobin’s Qt-1
Control
Variables Ratio 2003-2013
Bank Size Total Assets
Employees
ln(Assets)t ln(Employees)t
Moderating
Variables Ratio 2004-2014
Geographical Scope of Activity
Presence of banks’ branches in the international, national and local level
Int.Scopet Nat.Scopet Local.Scopet
Moderating
Variables Nominal 2004-2014
57
Appendix
4
: SIC Code List for Depositary Institutions
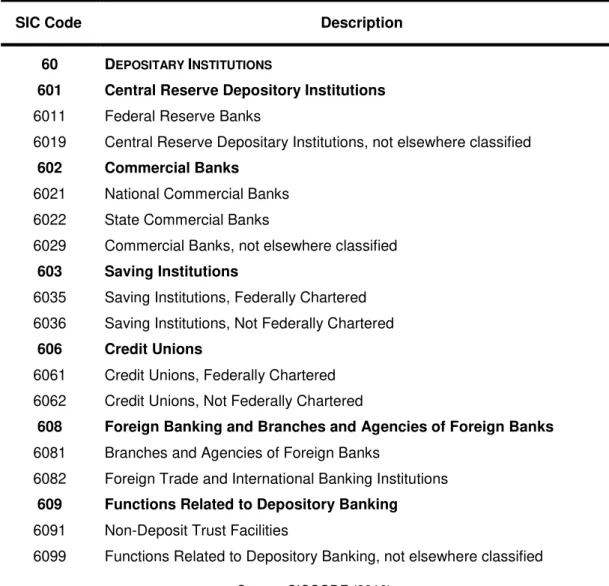
Table 22 – SIC Code List within 60. Depositary Institutions
SIC Code Description
60 DEPOSITARY INSTITUTIONS
601 6011
6019
Central Reserve Depository Institutions Federal Reserve Banks
Central Reserve Depositary Institutions, not elsewhere classified
602 6021
6022
6029
Commercial Banks National Commercial Banks
State Commercial Banks
Commercial Banks, not elsewhere classified
603 6035
6036
Saving Institutions
Saving Institutions, Federally Chartered
Saving Institutions, Not Federally Chartered
606 6061
6062
Credit Unions
Credit Unions, Federally Chartered
Credit Unions, Not Federally Chartered
608 6081
6082
Foreign Banking and Branches and Agencies of Foreign Banks Branches and Agencies of Foreign Banks
Foreign Trade and International Banking Institutions
609 6091
6099
Functions Related to Depository Banking Non-Deposit Trust Facilities
Functions Related to Depository Banking, not elsewhere classified
58
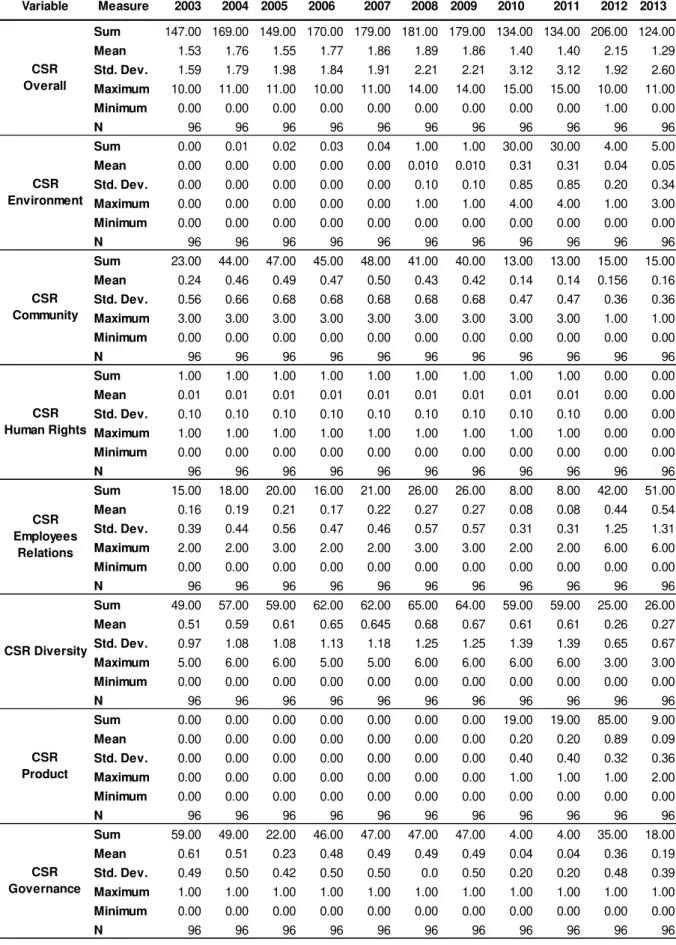
Appendix 5: Descriptive Statistics for CSR
Table 23 – Descriptive Statistics for CSR
Variable Measure 2003 2004 2005 2006 2007 2008 2009 2010 2011 2012 2013
Sum 147.00 169.00 149.00 170.00 179.00 181.00 179.00 134.00 134.00 206.00 124.00
Mean 1.53 1.76 1.55 1.77 1.86 1.89 1.86 1.40 1.40 2.15 1.29
Std. Dev. 1.59 1.79 1.98 1.84 1.91 2.21 2.21 3.12 3.12 1.92 2.60
Maximum 10.00 11.00 11.00 10.00 11.00 14.00 14.00 15.00 15.00 10.00 11.00
Minimum 0.00 0.00 0.00 0.00 0.00 0.00 0.00 0.00 0.00 1.00 0.00
N 96 96 96 96 96 96 96 96 96 96 96
Sum 0.00 0.01 0.02 0.03 0.04 1.00 1.00 30.00 30.00 4.00 5.00
Mean 0.00 0.00 0.00 0.00 0.00 0.010 0.010 0.31 0.31 0.04 0.05
Std. Dev. 0.00 0.00 0.00 0.00 0.00 0.10 0.10 0.85 0.85 0.20 0.34
Maximum 0.00 0.00 0.00 0.00 0.00 1.00 1.00 4.00 4.00 1.00 3.00
Minimum 0.00 0.00 0.00 0.00 0.00 0.00 0.00 0.00 0.00 0.00 0.00
N 96 96 96 96 96 96 96 96 96 96 96
Sum 23.00 44.00 47.00 45.00 48.00 41.00 40.00 13.00 13.00 15.00 15.00
Mean 0.24 0.46 0.49 0.47 0.50 0.43 0.42 0.14 0.14 0.156 0.16
Std. Dev. 0.56 0.66 0.68 0.68 0.68 0.68 0.68 0.47 0.47 0.36 0.36
Maximum 3.00 3.00 3.00 3.00 3.00 3.00 3.00 3.00 3.00 1.00 1.00
Minimum 0.00 0.00 0.00 0.00 0.00 0.00 0.00 0.00 0.00 0.00 0.00
N 96 96 96 96 96 96 96 96 96 96 96
Sum 1.00 1.00 1.00 1.00 1.00 1.00 1.00 1.00 1.00 0.00 0.00
Mean 0.01 0.01 0.01 0.01 0.01 0.01 0.01 0.01 0.01 0.00 0.00
Std. Dev. 0.10 0.10 0.10 0.10 0.10 0.10 0.10 0.10 0.10 0.00 0.00
Maximum 1.00 1.00 1.00 1.00 1.00 1.00 1.00 1.00 1.00 0.00 0.00
Minimum 0.00 0.00 0.00 0.00 0.00 0.00 0.00 0.00 0.00 0.00 0.00
N 96 96 96 96 96 96 96 96 96 96 96
Sum 15.00 18.00 20.00 16.00 21.00 26.00 26.00 8.00 8.00 42.00 51.00
Mean 0.16 0.19 0.21 0.17 0.22 0.27 0.27 0.08 0.08 0.44 0.54
Std. Dev. 0.39 0.44 0.56 0.47 0.46 0.57 0.57 0.31 0.31 1.25 1.31
Maximum 2.00 2.00 3.00 2.00 2.00 3.00 3.00 2.00 2.00 6.00 6.00
Minimum 0.00 0.00 0.00 0.00 0.00 0.00 0.00 0.00 0.00 0.00 0.00
N 96 96 96 96 96 96 96 96 96 96 96
Sum 49.00 57.00 59.00 62.00 62.00 65.00 64.00 59.00 59.00 25.00 26.00
Mean 0.51 0.59 0.61 0.65 0.645 0.68 0.67 0.61 0.61 0.26 0.27
Std. Dev. 0.97 1.08 1.08 1.13 1.18 1.25 1.25 1.39 1.39 0.65 0.67
Maximum 5.00 6.00 6.00 5.00 5.00 6.00 6.00 6.00 6.00 3.00 3.00
Minimum 0.00 0.00 0.00 0.00 0.00 0.00 0.00 0.00 0.00 0.00 0.00
N 96 96 96 96 96 96 96 96 96 96 96
Sum 0.00 0.00 0.00 0.00 0.00 0.00 0.00 19.00 19.00 85.00 9.00
Mean 0.00 0.00 0.00 0.00 0.00 0.00 0.00 0.20 0.20 0.89 0.09
Std. Dev. 0.00 0.00 0.00 0.00 0.00 0.00 0.00 0.40 0.40 0.32 0.36
Maximum 0.00 0.00 0.00 0.00 0.00 0.00 0.00 1.00 1.00 1.00 2.00
Minimum 0.00 0.00 0.00 0.00 0.00 0.00 0.00 0.00 0.00 0.00 0.00
N 96 96 96 96 96 96 96 96 96 96 96
Sum 59.00 49.00 22.00 46.00 47.00 47.00 47.00 4.00 4.00 35.00 18.00
Mean 0.61 0.51 0.23 0.48 0.49 0.49 0.49 0.04 0.04 0.36 0.19
Std. Dev. 0.49 0.50 0.42 0.50 0.50 0.0 0.50 0.20 0.20 0.48 0.39
Maximum 1.00 1.00 1.00 1.00 1.00 1.00 1.00 1.00 1.00 1.00 1.00
Minimum 0.00 0.00 0.00 0.00 0.00 0.00 0.00 0.00 0.00 0.00 0.00
N 96 96 96 96 96 96 96 96 96 96 96
CSR Product
CSR Governance
CSR Overall
CSR Environment
CSR Community
CSR Human Rights
CSR Diversity CSR Employees
59
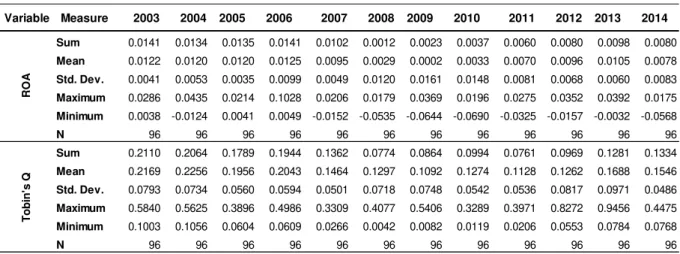
Appendix 6: Descriptive Statistics for CFP
Table 24 – Descriptive Statistics for CFP
Appendix 7: Descriptive Statistics
for Banks’ Size
Table 25 – Descriptive Statistics for Banks’ Size
Appendix 8: Descriptive Statistics for Geographical Scope of Activity
Table 26 – Descriptive Statistics for Banks’ Geographical Scope
Variable Measure 2003 2004 2005 2006 2007 2008 2009 2010 2011 2012 2013 2014
Sum 0.0141 0.0134 0.0135 0.0141 0.0102 0.0012 0.0023 0.0037 0.0060 0.0080 0.0098 0.0080
Mean 0.0122 0.0120 0.0120 0.0125 0.0095 0.0029 0.0002 0.0033 0.0070 0.0096 0.0105 0.0078
Std. Dev. 0.0041 0.0053 0.0035 0.0099 0.0049 0.0120 0.0161 0.0148 0.0081 0.0068 0.0060 0.0083
Maximum 0.0286 0.0435 0.0214 0.1028 0.0206 0.0179 0.0369 0.0196 0.0275 0.0352 0.0392 0.0175
Minimum 0.0038 -0.0124 0.0041 0.0049 -0.0152 -0.0535 -0.0644 -0.0690 -0.0325 -0.0157 -0.0032 -0.0568
N 96 96 96 96 96 96 96 96 96 96 96 96
Sum 0.2110 0.2064 0.1789 0.1944 0.1362 0.0774 0.0864 0.0994 0.0761 0.0969 0.1281 0.1334
Mean 0.2169 0.2256 0.1956 0.2043 0.1464 0.1297 0.1092 0.1274 0.1128 0.1262 0.1688 0.1546
Std. Dev. 0.0793 0.0734 0.0560 0.0594 0.0501 0.0718 0.0748 0.0542 0.0536 0.0817 0.0971 0.0486
Maximum 0.5840 0.5625 0.3896 0.4986 0.3309 0.4077 0.5406 0.3289 0.3971 0.8272 0.9456 0.4475
Minimum 0.1003 0.1056 0.0604 0.0609 0.0266 0.0042 0.0082 0.0119 0.0206 0.0553 0.0784 0.0768
N 96 96 96 96 96 96 96 96 96 96 96 96
T
o
b
in
's
Q
R
O
A
Variable Measure 2004 2005 2006 2007 2008 2009 2010 2011 2012 2013 2014
Sum 3 078 843.96 3 448 928.79 3 766 969.08 4 279 689.32 5 296 675.40 5 640 847.86 5 716 635.75 5 812 757.33 6 076 479.57 6 143 378.48 6 524 550.06
Mean 32 071.29 35 926.34 39 239.26 44 580.10 55 173.70 58 758.83 59 548.29 60 549.56 63 296.66 63 993.53 67 964.06
Std. Dev. 123 123.24 142 208.40 158 445.22 185 859.95 228 670.80 259 454.24 263 962.53 255 635.94 268 358.61 265 505.98 275 943.89
Maximum 1 110 457.00 1 291 803.00 1 459 737.00 1 715 746.00 1 817 943.00 2 223 299.00 2 264 909.00 2 129 046.00 2 209 974.00 2 102 273.00 2 104 534.00
Minimum 1 327.49 1 634.61 1 836.71 1 885.55 2 002.34 1 769.35 1 837.99 1 794.16 1 918.05 2 059.11 2 328.45
N 96 96 96 96 96 96 96 96 96 96 96
Sum 703.11 724.67 776.32 796.80 948.20 969.81 982.86 982.73 975.78 949.74 936.93
Mean 7.324 7.549 8.087 8.300 9.877 10.102 10.238 10.237 10.164 9.893 9.760
Std. Dev. 23.84 24.44 26.84 27.44 38.05 39.86 40.51 39.55 38.85 36.85 35.62
Maximum 175.742 176.638 203.425 209.718 281.000 284.000 288.000 282.000 269.200 264.900 264.500
Minimum 0.131 0.202 0.248 0.243 0.245 0.245 0.266 0.358 0.385 0.378 0.409
N 96 96 96 96 96 96 96 96 96 96 96
A
s
s
e
ts
(M
il
li
o
n
s
o
f
D
o
ll
a
rs
)
Em
p
lo
y
e
e
s
(T
h
o
u
s
a
n
d
s
)
Variable Measure 2004 2005 2006 2007 2008 2009 2010 2011 2012 2013 2014
Local Scope N 64 64 63 63 63 63 63 63 63 63 63
National Scope N 23 23 24 24 24 24 24 24 24 24 24
60
Appendix 9: Sub-questions, Hypotheses and Findings
Table 27 – Research Sub-questions, Hypotheses and Respective Findings
Sub-question Hypothesis Finding
Characterization of CSR performance evolution in the banking sector: How have overall CSR and individual CSR dimensions evolved over time, especially in light of the 2008 financial crisis?
H1.a. Overall CSR performance has increased in the banking industry after the
2008 financial crisis. Not Supported
H1.b. Individual dimensions of CSR performance have increased in the banking
industry after the 2008 financial crisis. Partially Supported
Nature of the Relationship between CSR and CFP in the Banking Industry: To what extent do overall
CSR and individual CSR dimensions impact banks’
financial performance, and how?
H2.a. Overall CSR has a positive impact on CFP in the banking industry. Not Supported H2.b. Individual CSR dimensions have a positive impact on CFP in the banking
industry. Partially Supported
Evolution of the Relationship between CSR and CFP in the Banking Industry: How has this impact changed in the context of the 2008 financial crisis?
H3.a. The impact of overall CSR on CFP has increased in the banking industry
after the 2008 financial crisis. Not Supported
H3.b. The impact of individual CSR dimensions on CFP has increased in the
banking industry after the 2008 financial crisis. Not Supported
Moderators of the Relationship between CSR and CFP in the Banking Industry: To what extent do banks’ size and their geographical scope of activity (international, national or local) moderate the impact
of overall CSR and individual CSR dimensions on
financial performance?
H4.a.i. Banks’ size moderates the impact of overall CSR on CFP, in the sense
that larger banks have higher impacts. Not Supported
H4.a.ii.Banks’ size moderates the impact of overall CSR on CFP, in the sense
that smaller banks have higher impacts. Not Supported
H4.b.i.Banks’ size moderates the impact of individual CSR dimensions on CFP,
in the sense that larger banks have higher impacts. Partially Supported H4.b.ii.Banks’ size moderates the impact of individual CSR dimensions on CFP,
in the sense that smaller banks have higher impacts. Partially Supported H5.a.i.Bank’s geographical scope of activity moderates the impact of overall
CSR on CFP, in the sense that multinational banks have higher impacts. Not Supported H5.a.ii.Bank’s geographical scope of activity moderates the impact of overall
CSR on CFP, in the sense that local banks have higher impacts. Not Supported H5.b.i.Bank’s geographical scope of activity moderates the impact of individual
CSR dimensions on CFP, in the sense that multinational banks have higher impacts.
Not Supported
H5.b.ii.Bank’s geographical scope of activity moderates the impact of individual