THIS REPORT WAS PREPARED BY RITA CASTRO HENRIQUES A MASTERS IN FINANCE STUDENT OF THE NOVA SCHOOL OF BUSINESS AND ECONOMICS, EXCLUSIVELY FOR ACADEMIC PURPOSES.THIS REPORT WAS SUPERVISED BY ROSÁRIO ANDRÉ WHO REVIEWED THE
VALUATION METHODOLOGY AND THE FINANCIAL MODEL. (SEE DISCLOSURES AND DISCLAIMERS AT END OF DOCUMENT)
See more information at WWW.NOVASBE.PT Page 1/38
M
ASTERS IN
F
INANCE
E
QUITY
R
ESEARCH
Our HOLD recommendation lies on an anticipation of a
negative impact on the back of the Spanish regulatory reform, partial normalization in gas supply margins, exposure to volatile oil prices and disruptions from Egyptian gas supplies. We view uncertainty risk for the gas reform.
The FCF story is positive. Gas Natural Fenosa (‘GAS’) is
experiencing a transition from the focus on deleveraging after the Unión Fenosa acquisition to a medium/long term growth story. Balance sheet is healthy. We see the exposure to the LNG markets as a positive differentiating feature. Conservative 62% payout ratio, but all-in-cash dividend.
Downside risks include additional regulatory revisions in
Spain, macro environment in Spain and LatAm, FX, and commodity fluctuations (shrinkage of gas spot price differentials and exposure to oil prices). Moreover, there can be some overhang of shares due to Repsol interest in selling its 30% stake in GAS.
We initiate coverage with a HOLD recommendation, and a price target of EUR 19,63. Our PT implies an upside of 5% to the current share price of 18,71. The target price is based on a sum-of-the-parts valuation, and we use a DCF and multiples analysis for the business units.
Company description
Gas Natural Fenosa is a Spain-based company active in the utility sector. Its operations include Natural Gas Supply (R&D projects, production and transportation); Power Generation under the special and ordinary regimes; Distribution in the electricity and gas sectors; Marketing of gas, electricity and services on the retail market, and other non-core businesses (telecommunication services). After the merger with Unión Fenosa, the company became a leading integrated gas and power utility.
G
AS
N
ATURAL
F
ENOSA
C
OMPANY
R
EPORT
U
TILITIES
06
J
ANUARY2013
R
ITA
C
ASTRO
H
ENRIQUES
[email protected]
LNG in the spotlight
…are current margins sustainable?
Recommendation: HOLD
Vs Previous Recommendation -
Price Target FY14: 19,63 €
Vs Previous Price Target -
Price (as of 3-Jan-2014) 18,71 €
Reuters: GAS.MC, Bloomberg: GAS.SM
52-week range (€) 13.22-18.82
Market Cap (€m) 18.722,90
Outstanding Shares (m) 1.000,69
Free float 31%
Source: Reuters, Bloomberg, Company data
Source: Bloomberg
(EUR millions) 2012 2013E 2014E
Revenues 28.627 28.274 27.612
EBITDA 5.080 5.208 5.244
EBITDA Margin 17,75% 18,42 %
18,99% Net Debt 15.625 14.462 13.513 Net Debt / EBITDA 3,2x 2,9x 2,7x
ROIC 8,07% 8,06% 8,18%
EPS 1,66x 1,68x 1,75x
DPS 1,03x 1,04x 1,09x
EV/EBITDA 7,34x 7,29x 7,14x
ICR 2,90x 3,15x 3,33x
D/E 126% 116% 105%
Source: Company data, Analyst’s estimates 40
60 80 100 120 140 160
03-01-2012 03-07-2012 03-01-2013 03-07-2013
GAS NATURAL FENOSA COMPANY REPORT
PAGE 2/38
Table of Contents
INVESTMENT CASE ... 3
COMPANY OVERVIEW ... 4
BUSINESS DESCRIPTION ... 5
SHAREHOLDER STRUCTURE ... 7
FINANCIAL POSITION ... 8
MACRO ENVIRONMENT ...10
COST OF CAPITAL ... 13
VALUATION METHODOLOGY ...14
ELECTRICITY DISTRIBUTION IN SPAIN ... 15
GAS DISTRIBUTION IN SPAIN... 18
ELECTRICITY GENERATION ... 20
LATAM OPERATIONS ... 24
GAS OPERATIONS ... 27
Demand ... 27
Price differentials ... 29
FINAL REMARKS ...31
APPENDIXES ...33
1) MERIT ORDER CURVE ... 33
3) MARKET BENCHMARKING ... 34
4) SUM-OF-THE PARTS ... 34
5) FINANCIAL STATEMENTS ... 35
6) EV/EBITDA MULTIPLE ANALYSIS FOR ELECTRICITY DISTRIBUTION IN MOLDOVA AND GAS DISTRIBUTION IN ITALY ... 36
7) FINANCIAL RATIOS ... 37
GAS NATURAL FENOSA COMPANY REPORT
PAGE 3/38
Investment Case
Gas Natural Fenosa is a Spanish integrated utility, active in the value chain activities of gas and electricity, and has a vertically integrated organization. GAS is the leader in natural gas sales in Iberia and it is the main gas distributor in LatAm. Moreover, it has a sound position in the LNG market, globally.
Our HOLD recommendation rests on three main reasons:
(1) Exposure to volatile gas supply / LNG trading activities, currently at peak price differentials, in our view. Whereas between 2004 and 2008 the Henry Hub and the NBP diverged, on average by USD 0,3/mmbtu, by the end of 2012 this difference was already at USD 6,6/mmbtu. Even more prominent is the relationship between the Asian spot and the Henry Hub: the average price divergence between 2004 and 2008 was of USD 2,5/mmbtu, while by the end of 2012 this difference ascended to USD 12,7/MMBtu (see Figure 1). These activities are subjected to the risks of a mismatch between the duration of the contracts with suppliers (usually 20 to 25 years and commonly linked to oil spot prices) and the duration of contracts with customers (usually one year, and linked to gas spot prices). The disruptions from the Damietta plant are still negatively impacting Unión Fenosa’s operations and resolution talks with the Egyptian government seem to have no outcome. In fact, the liquefaction output from Damietta decreased by 64% between 2011 and 2012.
(2) On-going regulatory risk, not only in the electricity segment, but also gas. Spanish electrical system has an accumulated deficit of more than EUR 26bn. The still pending details on the regulatory reform deserve caution. Having undertaken electricity reform, the secretary of state for energy has mentioned they will be looking into the gas sector as well. Remuneration is likely to continue to depend on the number of consumers and on volumes, but there is a problem of excess capacity in the face of current demand.
(3) We believe the share price is now closure to its fair value, due to recent appreciation. Moreover, there is a risk of stock overhang, as Repsol is looking to sell out its 30% stake in GAS due to reduced strategic importance after the February sale of its liquefied natural gas business.
GAS has a sound cash flow generation and a healthy balance sheet, having considerably improved its leverage position since the merger with Unión Fenosa. Stock catalysts include improved power prices, maintenance of the price differentials between gas hubs supported by the sustained closure of the Japanese nuclear plants, and a clarification regarding pending details of regulatory revisions in Spain, currently being discussed. We have a HOLD rating, based on a sum-of-the-parts valuation which yielded a YE14 target price of EUR 19,63, implying a 5% upside to the current share price of EUR 18,71.
Figure 1: Price differentials between gas hubs
Source: Bloomberg; Analyst’s estimates
Figure 2: Liquefaction output from the Damietta plant (GWh)
Source: Company data; Analyst’s estimates
Figure 3: Gas tariff deficit (EUR millions)
Source: Company data
Figure 4: Electricity tariff deficit (EUR millions)
GAS NATURAL FENOSA COMPANY REPORT
PAGE 4/38
Company overview
Gas Natural Fenosa is a Spain-based company, active in the utilities sector. Its operations include natural gas supply and transport, power generation, under the special and ordinary regimes, distribution of electricity and gas, marketing and services on the retail market, and other non-core businesses. After the merger with Unión Fenosa in 2009, the company became a leading integrated gas and power utility. The company is listed on Madrid stock exchange, and is part of the primary Spanish stock market index, IBEX 35, with a weight of 2,25% as of December 31, 2012.
Gas Natural opts for a diversification both in terms of geography and operations. 58% of gas activities are regulated1, and by the end of 2012, 31% of GAS sales were generated in LatAm and 56% in Spain. In GAS recent strategic presentation (November 5, 2013) it was emphasised the company’s more recent strengths: the LNG business and its geographical expansion into LatAm countries.
Figure 8: EBITDA Breakdown
Source: Company data, Analyst’s estimates
Figure 9: EBITDA CAGR per BU
1
Includes gas and electricity distribution and infrastructures (underground storage, transport and regasification).
13% 11%
19% 19%
25% 25%
18% 19%
24% 24%
2012 2017E
Electricity distribution EU Gas distribution EU Latin America Electricity Gas Others
17%
0%
9%
4%
20%
6%
1%
5% 4%
9%
Electricity distribution EU
Gas distribution EU Latin America Electricity Gas
CAGR 2009-2012 CAGR 2009-2016
Figure 5: Growth and Profitability
Source: Company data, Analyst’s estimates
Figure 6: Margin Trends
Source: Company data, Analyst’s estimates
Figure 7: Sales Breakdown (2012)
GAS NATURAL FENOSA COMPANY REPORT
PAGE 5/38
Business description
Electricity
Gas Natural is active in all steps of the electricity value chain from generation, to distribution and supply. Its electricity operations are split into two different business units: Distribution, which includes the regulated electricity distribution business and network services for customers, and other business related to third party access to the distribution network (presence in Spain, LatAm and Italy); and
Generation, which includes the electricity production, the supply of electricity to
wholesale markets and the wholesale and retail commercialisation of electricity in the de-regulated Spanish market (presence in Spain, LatAm and Kenya).
The electricity distribution segment (Spain, LatAm and Moldova) represented 20% of GAS’ EBITDA by the end of 2012, and 89% of that EBITDA was generated in Spain. Since 2009, revenues in Spain are the result of a return over the regulatory asset base (“RAB”), but the final RAB settings were only defined in 2010 (we estimated 2012 RAB at EUR 5,46bn). Regulated revenues include also recognized amortisation and costs. The current remuneration rate is based on the yield on 10-year Spanish treasury bond plus a 200bp spread (~6,5% pre-tax)2. After the sale of the Nicaraguan and Guatemalan units, the electricity distribution operations in LatAm, conducted by GAS are concentrated in Colombia and Panama, and regulatory revisions are expected in both countries in 20143. Revenues in these countries are also RAB-based.
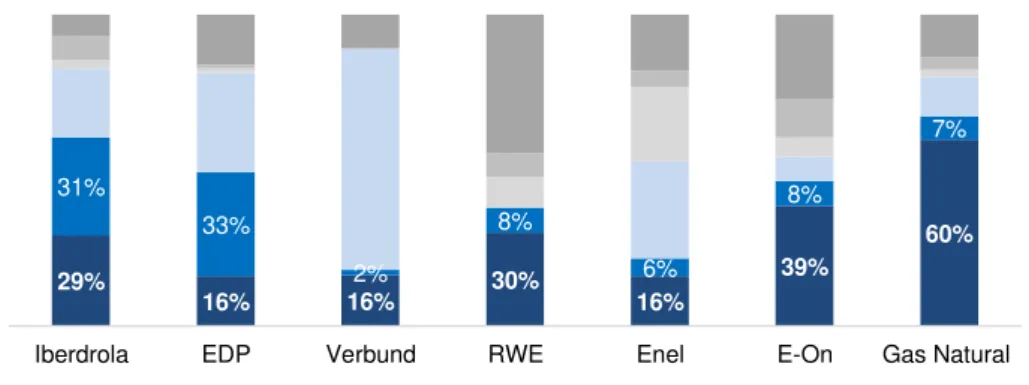
GAS capacity mix is biased to CCGT power generation, representing 65% of the installed capacity of the ordinary regime in Spain (and 60% if we include the international and special regime operations). Most of GAS generation assets are located in Spain (12,8 GW), yet GAS has a coal power plant in Kenya with 100 MW of installed capacity and slightly more than 2,6 GW of installed capacity in Latin America. GAS operates in both the ordinary and the special regimes however, 90% of the Spanish installed capacity is of the ordinary regime4. Considering the deleverage policy followed by GAS in this segment, capex plans for the generation business are mostly maintenance, unless Greenfield projects in LatAm.
2Spain has 4-year regulatory periods (current: 2013-2016)
3 Colombia has 5-year regulatory periods and Panama 4-year regulatory periods. 4
The special regime includes renewables and co-generation, and the idea behind the implementation of the special regime was to incentivize investments and provide a competitive and profitable environment for special regime plants to compete with those of the ordinary regime.
Figure 10: Gas’ generation mix and installed capacity per technology (%)
Source: Company data
Figure 11: Spain versus GAS installed capacity in 2012 (only plants from the ordinary regime in Spain)
Source: Company data; EDP (DPE)
Figure 12: GAS' installed capacity by geography
GAS NATURAL FENOSA COMPANY REPORT
PAGE 6/38
Figure 13: Installed Capacity between Competitors (2012)
Total installed capacity:
44.865 MW 23.381 MW 10.367 MW 51.977 MW 97.839 MW 67,732 MW 15.533 MW
Source: Companies’ Reports
Gas
Gas Natural Fenosa operates in all parts of the gas value chain, having some R&D and exploration activities, and being active in the treatment, storage, transportation, liquefaction, regasification, and distribution channels.
Its operations are split in four different business units:
(1)Distribution, which includes third party access and secondary transportation,
as well as the distribution activities for outside the regulated remuneration in Spain. It also includes operations in Italy and in LatAm. The regulatory methodology for the gas distribution in Spain is not revised since 2002, and revenues are updated by a formula that takes into account the Spanish PPI, CPI, an efficiency factor, the number of connection points and volumes sold.
(2) Infrastructures5, which includes the exploration and production of gas and
the LNG value chain activities, from the exporting countries to the entry points of final markets, including the regasification process. This unit also includes the Maghreb-Europe pipeline operation, contracted in dollars and thus exposed to euro-dollar exchange rate fluctuations.
3) Supply and Commercialisation, which includes the supply and
commercialisation of natural gas to wholesale and retail customers in the deregulated Spanish market, as well as the sales of natural gas to customers outside of Spain.
(4) Unión Fenosa, which includes the liquefaction activities in Egypt, sea
transport, re-gasification in Sagunto (Spain) and supply and commercialisation of
5 Transport, underground storage and regasification are regulated activities.For the revenues estimation we used the same regulatory model as the transmission one.
29%
16% 16% 30% 16%
39%
60%
31%
33%
2%
8%
6%
8%
7%
Iberdrola EDP Verbund RWE Enel E-On Gas Natural
CCGT Renewables Hydro Cogeneration Nuclear Coal
Figure 14: Gas Value Chain
NG: LNG:
Source: Analyst’s research
Figure 15: Gas Supply Breakdown
Source: Company data; Analyst’s estimates
G
a
s
c
o
m
p
re
ss
io
n
p
la
n
GAS NATURAL FENOSA COMPANY REPORT
PAGE 7/38 gas. Gas Natural together with Eni6 (Italian Oil & Gas Company) owns 80% of Unión Fenosa (50% GAS and 50% Eni).
Where GAS has been able to obtain the largest margins is in the gas supply unit, having increased the company’s presence internationally (by engaging into more flexible gas contracts), and taking advantage of hub price differentials. Whether or not this trend is likely to continue is a point of uncertainty: there is little evidence of a short-term price differential reduction between Asian/LatAm, European and American hubs, but it makes little sense to assume the current historically high price differences between world gas markets to continue in the long run7. This topic is further discussed in the subchapter “Price differentials”.
Shareholder structure
Since the capital increase of June 2011 (3,85% shareholding position sold at a price of EUR 13,48 to Sonatrach), Gas Natural Fenosa’s equity is made up of 1.000.689.341 shares with a 1 euro face value each. The shares are floated on the four Spanish stock exchanges through the continuous market. The company has around 80.000 shareholders, with La Caixa and Repsol having the largest stakes (35% and 30%, respectively).
Repsol is sounding out banking advisers about a potential sale of (at least) 25% out of its 30% stake in GAS, because of reduced strategic importance after the February sale of its liquefied natural gas business to Royal Dutch Shell. The sale intentions are suspended as long as Repsol is under no financial pressure. The sale will come down to either an attractive price or an appealing investment project. According to the Financial Times, the management is considering freeing cash for further investment in upstream oil exploration, but no specific investment opportunities are in sight yet.
Temasek (Singapore’s sovereign wealth fund) and Sinopec (Chinese state-controlled refiner) have both approached Repsol over buying its stake in Gas Natural. Repsol views both firms’ interest favourably due to their already existing relationships, meaning that both La Caixa and the Spanish government view them as stable potential shareholders (FT). However, according to an unconfirmed article in Cinco Dias, Sinopec stated that it is no longer interested in acquiring Repsol’s stake in GAS. This represents an additional risk exposure: if Repsol finds an attractive investment opportunity, the more likely scenario is a
6
ENI consolidates Unión Fenosa using the equity method. GAS will have to do the same as IFRS 11 (to be applied from Jan. 2014 onwards) requires using the equity method for joint ventures, which are defined as those with joint control, and where the parties have a right to their net assets. We use the old framework in our estimates.
7 By the end of 2012, the Henry Hub was trading at USD 2,7/MMBtu, the NBP at USD 9,3/MMBtu and the Asian spot at USD 15,4/MMBtu.
Figure 16: ROIC - Gas Activities
Source: Company data; Analyst’s estimates
Figure 17: GAS' shareholder structure
GAS NATURAL FENOSA COMPANY REPORT
PAGE 8/38 sale of Repsol’s stake to more than one investor, and a shares placement. The sale of the shares in the market would create an overhang to the stock.
Repsol chairman said later in November that he is willing to spend as much as 10 billion dollars in acquiring assets in Canada, the U.S. or Northern Europe after selling its stake in Gas Natural. The investment target will have to add value in terms of risk, profitability, technology and portfolio (said the Chairman), emphasising the idea that only at an attractive opportunity will Repsol exit GAS. Moreover, it is of political interest to keep GAS under Spanish hands.
Financial Position
Gas Natural obtained its first rating in 1999. It is currently border-line investment grade, with a BBB+ rating by Fitch and Baa2 by Moody’s. S&P’s rating evolution since 1999 can be seen in Table 1.
On November 28, the S&P improved GAS outlook from negative to stable, on the back of their new rating methodology for entities rated above sovereign. Under S&P’s new methodology a company that is considered to have a high country risk exposure can be rated two notches above a sovereign that is rated B or higher. GAS current rating situation concerns a difficult economic environment in Europe and more particularly, in Spain. Although the sovereign ceiling rule8 no longer applies, there is still a high correlation between corporate’s rating and that of its sovereign. The Spanish government is currently rated BBB- by the S&P. Moody’s improved Spanish rating outlook on December 4, from negative to stable.
In its strategic program of 2008-12, Gas Natural stated its intentions to sustain an A credit rating (as per S&P) but, not long after the merger with Unión Fenosa, the three rating agencies downgraded Gas Natural, in the face of a worse position in terms of financial ratios. GAS consolidates Unión Fenosa since 2009.
Table 3: Leverage ratios
2006 2007 2008 2009 2010 2011 2012 2013E
ND9 /
EBITDA 1,6x 1,7x 2,0x 5,2x 4,1x 3,6x 3,1x 2,8x
ICR10 3,8x 5,3x 4,3x 2,6x 2,5x 2,7x 2,9x 2,9x
D/E11 67% 79% 108% 191% 170% 153% 148% 132%
Source: Company data, Analyst’s estimates
8Defines that no company can have a credit rating that is superior to that of the sovereign rating. 9Net debt defined under GAS’ assumptions (= Short-term and Long-term Borrowings
minus Cash & Cash Equivalents). 10Interest Coverage Ratio (= EBIT / Interest).
11At book values. D is the Interest Bearing Debt only and E is Total equity
Table 1: GAS S&P Credit Rating
Date Long term
15/10/12 BBB 06/10/11 BBB 17/12/10 BBB 05/06/09 BBB+ 20/02/09 BBB+ 22/02/08 A 05/02/07 A+ 06/05/03 A+ 10/03/03 A+ 23/07/01 A+ 10/05/00 AA- 16/02/99 AA-
Source: Bloomberg
Table 2: Spanish-Sovereign S&P Credit Rating
Date Long term
10/10/12 BBB- 24/06/12 BBB+ 13/01/12 A 05/12/11 AA- 13/10/11 AA- 28/04/10 AA 19/01/09 AA+ 12/01/09 AAA 13/12/04 AAA 31/03/99 AA+
GAS NATURAL FENOSA COMPANY REPORT
PAGE 9/38 Immediately after the merger, GAS net debt increased from 5 to 20 billion euros, but by the end of 2012 it was already at EUR 15,6bn. During the strategic presentation, GAS stated that the possibility of having its credit rating improved is now more dependent on the macro environment.
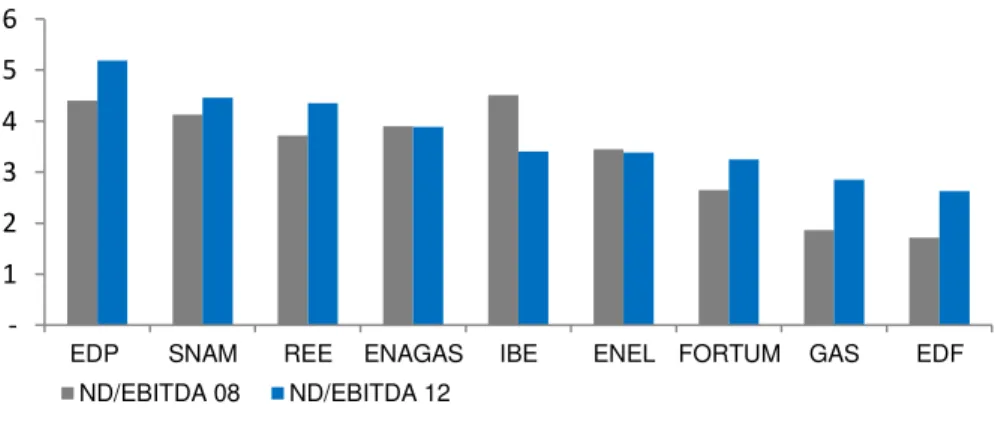
Since 2010, the company has gone into a series of divestments, and the net debt to EBITDA ratio is already around the 3x benchmark defined in the strategic plan of 2008-12. The CEO is comfortable with the current ratio, and accepts a potential decrease to levels of 2,5x. The company is now experiencing a transition from the emphasis on the debt reduction after the Unión Fenosa acquisition, and towards growth under a stable leverage position, both in terms of how it compares to its peers, and in terms of the guidelines defined by the management. GAS’ Net Debt-to-EBITDA for 2012 is below that of its main peers, and particularly of the Iberian peers EDP (5,2x) and Iberdrola (3,4x). However, its long-term rating still concerns us as it is below most of its peers (Table 4).
Figure 20: Net Debt-to-EBITDA Ratio (x)- Competitors
Source: Bloomberg
GAS solvency position has improved from a debt-to-equity ratio (at book values) of 191% in 2009 to 148% in 2012, and this trend is expected to continue. By the end of 2012, GAS’ interest coverage ratio was of 2,9x.
During the strategic presentation, GAS emphasised its main financial goals: i) commitment to cash dividend, ii) flexibility to increase investments when in the presence of growth opportunities (accumulated excess cash of EUR 2,9bn by the end of 2012) and iii) strategic guidelines aligned with financial discipline. GAS argues that it executed a deleveraging plan ahead of its peers, but this is just a reflection of the Unión Fenosa acquisition. GAS target payout ratio of 62% is conservative considering its cash flow generation and we believe GAS has a sufficiently healthy balance sheet to increase this ratio. For our estimates we assume a 62% payout ratio in line with GAS’ guidelines until 2017, and from then
12
With respect to Bloomberg’s assumptions for the calculation of net debt
1 2 3 4 5 6
EDP SNAM REE ENAGAS IBE ENEL FORTUM GAS EDF
ND/EBITDA 08 ND/EBITDA 12
Table 4: Long-term Credit Rating – Competitors
SP& Moody's Fitch
GAS BBB Baa2 BBB+
EDP BB+ Ba1 BBB-
Enel BBB Baa2 BBB+
RWE BBB+ Baa1 BBB+
Eon A- A3 A-
Iberdrola BBB Baa1 BBB+
Enagas BBB Baa3 A-
REE BBB NA A-
EDF A+ Aa3 A+
Snam BBB+ Baa1 NA
Fortum A- A2 A-
Figure 18: Expected Dividend Yield (%) for Different Payout Ratios
Source: Company data; Analyst’s estimates
Figure 19: GAS debt by currency (2012)
GAS NATURAL FENOSA COMPANY REPORT
PAGE 10/38 onwards we assume a 70% payout. Figure 18 shows expected dividend yields for different payout ratios. GAS wants to maintain a certain level of cash to face the potentiality of new investments and to maintain a conservative leverage position.
GAS finances its operations with local currency, so as to be exposed to business risk only. The debt by currency as of 31 December, 2012 can be seen inFigure
19.
Macro Environment
Since the beginning of the year, the consensus target price and the share price have been evolving hand-in-hand. This is mostly a result of better macro variables, and more transparency with respect to the gas supply activities, which resulted in a better market perception. Potential upsides are now priced-in. We identified two main macro risks for the Spanish operations: country risk and the future of the euro zone. With respect to the country risk, the market has come to perceive a smaller risk associated with Spain, as the country is technically out of the recession thanks to the GDP growth experienced in the last two quarters. This goes in line with Moody’s improved outlook to the sovereign from negative to stable as of December 4, 2013. By looking at Figure 22, we clearly see the divergence between yields on the Spanish 10-year sovereign bonds and the German 10-year sovereign bonds, created immediately after the crisis hit. One should only include a penalization for country risk into the discount factor if it is able to estimate the part of that risk that is systematic. We estimated the country beta13 to analyse whether Spain has an increased volatility to the market and reached a value of less than 1,0814. This regression has an implied 73% R-square, suggesting that about 30% of the country risk is diversifiable.
Also common is to estimate the country risk based on default-spreads. Damodaran suggests two ways to estimate the default spread: (1) difference between a long-term local bond’s yield and a US government bond yield of the same maturity (2,05% for Spain); or (2) the difference between the CDS spread for the local economy minus the US CDS spread (3,14% for Spain)15. We do not incorporate any default spread in our cost of capital estimation as this difference
13 Regression between IBEX 35 and MSCI Europe. Despite liquidity concerns regarding the IBEX 35 and lack of uncertain regarding this index as a good proxy for the Spanish economy, we still found deem this analysis.
14Regression parameters: Standard deviation=0,02; standard error=0,01 15
According to Damodaran analysis, the way the default spread is incorporated in the discount rate depends on our assumptions regarding the country risk premium: if we believe all companies are equally exposed to country risk we just add the spread to the total cost of equity calculated based on the CAPM; if we believe the company has a similar exposure to country risk as to market risk we add it to the equity risk premium; and if we want to treat country risk as a separate risk factor we add a new factor to the CAPM.
Figure 21: GAS share price vs target price
Source: Bloomberg
Figure 22: Yield on Spanish and German Treasury Bonds (10-year)
GAS NATURAL FENOSA COMPANY REPORT
PAGE 11/38 would only be a reasonable estimate for country risk premium if GAS’ cash flows moved closely in line with the payments on government bonds16.
The effects of the sovereign debt crisis are still felt in the European macroeconomic scenario. Although the uncertainty of the future of the monetary union prevails, it is on a much smaller scale and we did not find proof to support the development of such a scenario.
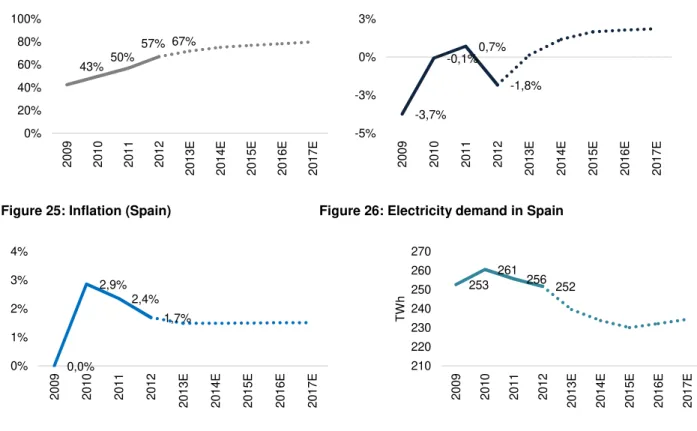
Figure 23: Net debt as a % of GDP (Spain) Figure 24: Real GDP growth (Spain)
Figure 25: Inflation (Spain) Figure 26: Electricity demand in Spain
Source: Company data, IMF, Analyst’s estimates
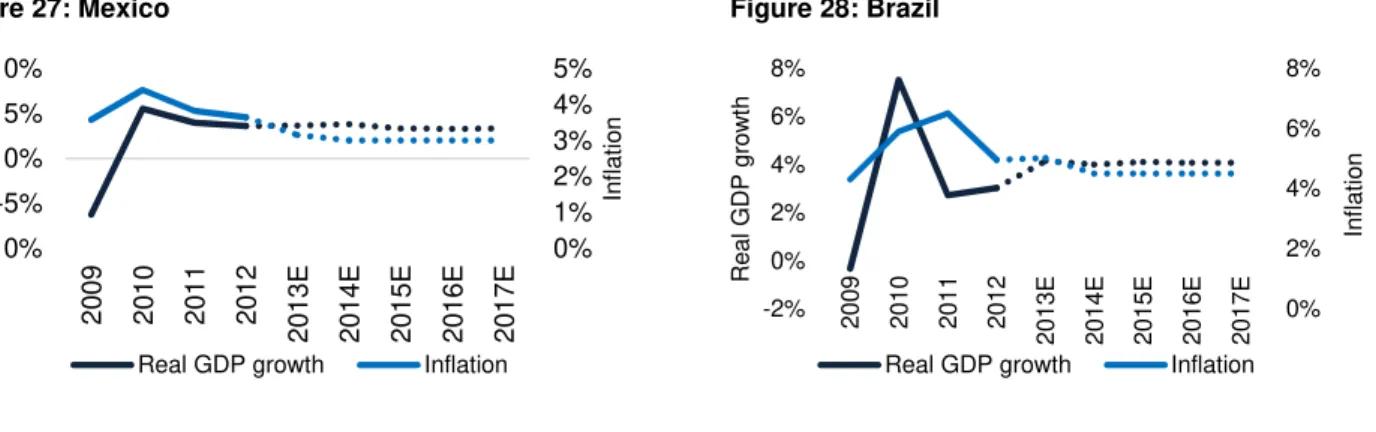
Moving on to Latin America, GAS already has a strong presence in Mexico, Colombia and Brazil, and is looking to strengthen its position and to broaden its presence into other LatAm countries. Brazil and Mexico are seen as the countries with more potential market growth. Until the 90s, LatAm countries lacked transport and distribution infrastructures, had unsound industrial development and were strongly affected by the recession of the 80s, factors that had a strong impact on energy demand and that explain the low level of natural gas use in the past. Since the early 1990s, renewed economic growth, market liberalization and environmental concerns led to an increase in energy demand in LatAm countries17. While Latin America is self-sufficient in natural gas production, the investment in infrastructures was essential to support this increase in demand. The local governments promoted regulatory changes to move from a
16 From the McKinsey Valuation book. 17
GAS started its expansion into Latin America in 1992, first in Argentina, and then in Brazil, Colombia and Mexico.
GAS NATURAL FENOSA COMPANY REPORT
PAGE 12/38 monopolistic model to a competitive one. Although these economies are growing, there are macro risks one should be aware of when valuing local operations. FX movements are a key concern. Even though GAS finances all its operations with local currency, it is still exposed to business risk. In fact, during the strategic update, GAS’ CEO admitted a potential decrease in returns from Brazil due to FX effects.
We conducted a similar analysis to that of Spain. Colombia has a 2% default spread, Mexico 1,5%, and Brazil 1,75%. We estimated the slope between the MSCI LatAm and MSCI World, which yielded a country beta of 1,3318, with a 73% implied R-square, suggesting that only 27% of the LatAm risk is diversifiable19. Reasons for this increased volatility include the dependence of the economies on commodities exports (mostly minerals and agricultural products). According to the World Bank report20 there has been a shift in exports, from advanced to emerging economies whose demand has increased (mostly from Asian markets). Nevertheless, it seems like emerging economies have been cooling down: Mexico is moving away from the extraordinary 7% growth rate (in 2000) to the historical 30-year average of 2,5%, and the same goes for Brazil (historical average of 2,6% versus 2012 GDP growth rate of 3%), and in a smaller scale for Colombia (historical average of 3,5% versus 2012 GDP growth of 4,7%). Yet, these rates are still significantly superior to the ones experienced in Europe (more particularly, in Spain, with an expected GDP growth rate for 2013 of 0,1%21).
LatAm companies have often small gearings, a signal of country risk and higher probability of default.
Figure 27: Mexico Figure 28: Brazil
18 Regression parameters: Standard deviation=0,07; standard error=0,04
19 Since we could not separate the estimation for LatAm operations between countries we simplified the country risk premium analysis to a LatAm-risk only. Nevertheless we find this simplification reasonable because the additional systematic risk for the LatAm economies is likely to be similar, as economies are alike and dependent on natural resources.
20 World Bank report: “Natural Resources in Latin America and the Caribbean: Beyond Booms and Busts?”. This report explains that the applicability of a commodities curse may no longer hold to emerging economies as these are moving from exporters to importers. Nevertheless, we still believe the commodities’ risk deserves caution.
21 IMF estimates 0% 1% 2% 3% 4% 5% -10% -5% 0% 5% 10% 2 0 0 9 2 0 1 0 2 0 1 1 2 0 1 2 2 0 1 3 E 2 0 1 4 E 2 0 1 5 E 2 0 1 6 E 2 0 1 7 E In fl a ti o n R e a l G D P g ro w th
Real GDP growth Inflation
0% 2% 4% 6% 8% -2% 0% 2% 4% 6% 8% 2 0 0 9 2 0 1 0 2 0 1 1 2 0 1 2 2 0 1 3 E 2 0 1 4 E 2 0 1 5 E 2 0 1 6 E 2 0 1 7 E In fl a ti o n R e a l G D P g ro w th
GAS NATURAL FENOSA COMPANY REPORT
PAGE 13/38
Figure 29: Colombia Figure 30: FX – Accumulated % changes
Source: Bloomberg, IMF
Cost of Capital
The estimation of the discount rate is a critical issue, as its impact on the company’s value is remarkable. The discount rate must be consistent with the nature of the cash flows: same currency (euros), in nominal terms and, because we are estimating cash flows to the firm, the appropriate discount rate is the cost of capital. To accurately assess GAS’ operations we estimated a long-term cost of capital for each business unit, taking into consideration comparable companies.
We calculated the cost of equity based on the capital asset pricing model (CAPM), applying a market risk premium of 6%22 and a risk-free rate of 2,06%23, based on the average yield on a 10-year US treasury-bond, converted to euros. We assume that the marginal investor is well-diversified, and the only risk that should be incorporated in the discount rate is the non-diversifiable risk, including the country beta whose estimation was previously described.
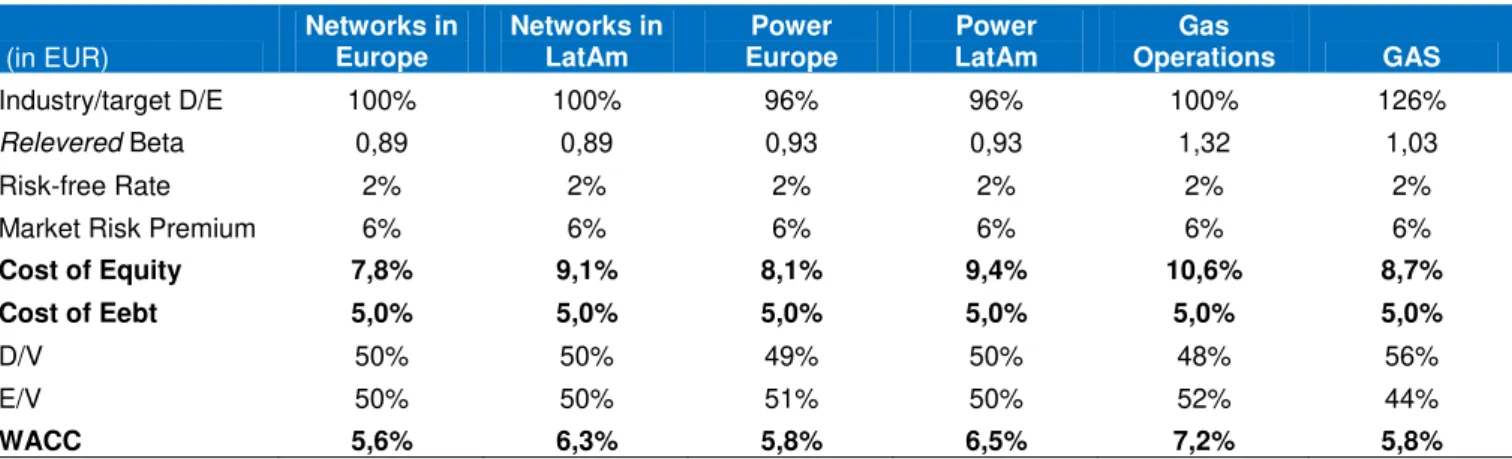
As for the comparable firms, we included companies that operate in the business sector under question and/or geographical location. The computations and results are summarised inTable 5. The idea was to find company betas that are appropriate benchmarks for GAS. To re-lever the asset betas of the comparable firms we assumed a target gearing that was equal to the average of the comparable firms. In the lack of a good estimate of optimal gearing, we assumed that all companies aim at efficiency, and thus, companies aim at an optimal capital structure.
The cost of debt is the result of a weighted average between the recovery rate and 1+yield, weighted by the probability of default. We found suitable the use of a probability of default and recovery rate that were consistent with the utilities
22 Implied market risk premium on January 1, 2012 according to Damodaran. 23
As of December 2013.
0% 1% 2% 3% 4% 0% 2% 4% 6% 8% 2 0 0 9 2 0 1 0 2 0 1 1 2 0 1 2 2 0 1 3 E 2 0 1 4 E 2 0 1 5 E 2 0 1 6 E 2 0 1 7 E In fl a ti o n R e a l G D P g ro w th
Real GDP growth Inflation
-30% -20% -10% 0% 10% 20% 30% 40% 0 2 -0 1 -2 0 1 3 2 3 -0 1 -2 0 1 3 1 3 -0 2 -2 0 1 3 0 6 -0 3 -2 0 1 3 2 7 -0 3 -2 0 1 3 1 7 -0 4 -2 0 1 3 0 8 -0 5 -2 0 1 3 2 9 -0 5 -2 0 1 3 1 9 -0 6 -2 0 1 3 1 0 -0 7 -2 0 1 3 3 1 -0 7 -2 0 1 3 2 1 -0 8 -2 0 1 3 1 1 -0 9 -2 0 1 3 0 2 -1 0 -2 0 1 3 2 3 -1 0 -2 0 1 3 1 3 -1 1 -2 0 1 3
EURBRL Curncy EURCOP Curncy
GAS NATURAL FENOSA COMPANY REPORT
PAGE 14/38 sector: 1,5%24 and 90%25, respectively. For the yield, we looked at GAS traded bonds and used one that matched the currency of the cash flows (euros), with the longer maturity (9 years duration) and sufficiently liquid (issue amount of EUR 750 millions). With the yield of 5,19% we reached a cost of debt of 4,97%. If we had rather applied a probability of default that was consistent with GAS credit rating (4,9%), we would reach a cost of debt of 4,4%, more in line with the cost of debt calculated based on Damodaran’s method. Damodaran suggests adding a spread to the risk free rate that is consistent with the company’s leverage position, based on the interest coverage ratio. GAS’ ICR relates to a “synthetic” rating of BBB and the result is a cost of debt of 4,05%.
Table 5: Weighted Average Cost of Capital
(in EUR)
Networks in Europe
Networks in LatAm
Power Europe
Power LatAm
Gas
Operations GAS
Industry/target D/E 100% 100% 96% 96% 100% 126%
Relevered Beta 0,89 0,89 0,93 0,93 1,32 1,03
Risk-free Rate 2% 2% 2% 2% 2% 2%
Market Risk Premium 6% 6% 6% 6% 6% 6%
Cost of Equity 7,8% 9,1% 8,1% 9,4% 10,6% 8,7%
Cost of Eebt 5,0% 5,0% 5,0% 5,0% 5,0% 5,0%
D/V 50% 50% 49% 50% 48% 56%
E/V 50% 50% 51% 50% 52% 44%
WACC 5,6% 6,3% 5,8% 6,5% 7,2% 5,8%
Source: Bloomberg; Analyst’s estimates
Valuation Methodology
We valued GAS based on a sum-of-the parts approach, and the analysis was divided into the following units:
(1) Electricity distribution in Spain; (2) Gas distribution in Spain;
(3) Electricity generation in Spain and Kenya;
(4) LatAm operations, which includes gas distribution, electricity distribution and generation;
(5) Gas operations, which includes infrastructures, supply & commercialisation and Unión Fenosa Gas.
For (1) to (5) we used a DCF model so as to properly take into account each unit’s value drivers. The explicit period of analysis was set until 2022, and for the
24 From Moody’s investor service 25
GAS NATURAL FENOSA COMPANY REPORT
PAGE 15/38 terminal value we used a perpetual growth formula. All cash flows are expressed in euros26. We reached a price target of EUR 19,63, which implies a potential 5% upside to the current share price of 18,71.
Besides these units, we valued the gas distribution operations in Italy (2% of EBITDA) and the electricity distribution operations in Moldova (1% of EBITDA) using the Enterprise Value to EBITDA multiple approach27.
Figure 31: Sum-of-the-parts (EUR/share)28
Source: Company data; Analyst’s estimates
Electricity Distribution in Spain
The Spanish electricity sector is one in which regulated and de-regulated activities coexist. The main features of the regulatory reform of the industry were the creation of a wholesale electricity market, vertical unbundling of the networks and a gradual liberalisation of the market. The Iberian framework went further than the European Directives by introducing regulated third-party access to the network and vertical unbundling not only of electricity but also of gas networks. GAS’ electricity distribution operations in Spain include the regulated network and distribution services, as well as third-party access to GAS’ networks. By the end of 2012 this unit represented 12% of EBITDA.
It is the regulatory authorities’ role to foment the functioning of the market, allowing for both an economic and financial sustainability of the sector by which all market participants should obey. Nonetheless, in the last decade, the Spanish electrical system has been generating a tariff deficit: between 2004 and 2012 the revenues from the tolls paid by consumers increased by 122%, while the regulated costs increased by 197%. The costs that contributed the most for this discrepancy were the ones from the special regime (+6x) and the annuities from
26
No sufficient data to analyze units in local currencies. 27 Multiples’ results summarized in Appendix 6). 28
Deductions to the Enterprise Value are at 2014E Book Values.
19,6
9
5
4
9
9
3
38
16
2 2 1
Gas Dist. Europe
Electricity Dist. Europe
Power Spain &
Kenya
LatAm Gas Others
and Adj.
GAS NATURAL FENOSA COMPANY REPORT
PAGE 16/38 the accumulated deficits (+9x). According to the CNE29, by May 10, 2013 there was an accumulated debt of 26.062,51 million euros (excluding securitization). The Spanish tariff deficit is mostly the result of: i) energy prices above the tariff’s assumptions, ii) insufficient increase of tariff to cover costs, iii) special regime over-costs, iv) lower demand than the tariff’s assumptions and v) non-mainland costs30. The CNMC31 emits on a regular basis a document on the provisional liquidation of the electric sector. The liquidation of August 2013 reported an accumulated deficit of 4.519,5 million euros between January and August 2013. To correct the mismatches produced by the expansive evolution of the electric costs, there have been several measures adopted in the last few years that affect both the cost and the revenue side. The latest Decree-Law, RDL 9/2013, articulates on an urgent basis, a series of measures designed to ensure the financial stability of the electrical system, the budget economic sustainability and the security of supply.
The current electricity distribution remuneration is thus defined as the sum of the return on investment, plus the reward for operation, maintenance and other costs associated with the assets in service (“ROM&OCD”) and plus a variable for incentives/penalties related to service quality. With regards to the return on investment, this includes the linear depreciation and amortisation of assets and the financial remuneration, which is, the result of the regulated asset base times the allowed rate of return. The current remuneration rate (defined by RDL 9/2013) is dependent on the yield of a 10-year Spanish treasury bond plus a 200bp spread, from 2014 onwards, which yields a 6,5% remuneration rate, almost 1% lower than the previous allowed return. ROM&OCD is calculated based on previous year ROM&OCD and adjusted by the Spanish PPI, CPI and an efficiency factor (≤0,97). Prior to RDL 9/2013, the indexation to inflation was applicable not only to ROM&OCD but also to the depreciation and financial remuneration items. Moreover, the efficiency factor is a new parameter.
GAS has no control over the regulatory impact, and it is seeking to reassess operating expenses and investments so as to be able to sustain decent cash flow generation. We expect capex spending of around 200 million per year.
The main value drivers of this unit include opex/capex efficiencies, evolution of demand in the face of economic recovery in Spain, and regulatory items. For the estimation of the remuneration rate, it was particularly interesting its comparison to our estimation for this unit’s weighted average cost of capital (~5,6%)32. The
29 Comisión Nacional de Energía 30
In the islands fuel-oil is the used technology, which is more expensive. 31 Comisión Nacional de los Mercados e la Competencia
32
The WACC estimation was further developed in the sub-title “Cost of Capital”. Figure 32: Spanish Electric Deficit /
Superavit (EUR million)
Source: CNE (liquidación 14)
Figure 33: Tariff REvenue vs System Costs
GAS NATURAL FENOSA COMPANY REPORT
PAGE 17/38 regulator sets a remuneration rate that shall not exceed the minimum necessary to cover costs, and to be competitive in the market, while enabling a reasonable profitability. The remuneration rate is consistent with a low-risk economic activity, since the network activities are not directly linked to market risk arising from production. This leads us to conclude that, for the long-run, it makes sense to have the remuneration rate (after taxes) in line with the weighted average cost of capital, and the enterprise value of the electricity distribution close to the value of the regulated asset base.
We estimated a EUR 5,3 value per share for the Spanish electricity distribution business, while the estimate RAB for 2022 is EUR 5,77bn.
Figure 34: RRAB, ROIC and WACC Comparison
Source: Company data; Analyst’s estimates
Table 6: FCF Electricity Distribution in Spain (EUR m unless stated otherwise)
2011 2012 2013E 2014E 2015E 2016E 2017E
Regulated Asset Base 5.480 5.462 5.437 5.461 5.490 5.527 5.563
Return on RAB (%) 7,43% 7,43% 6,48% 6,42% 6,42% 6,42% 7,42%
D&A 220 228 197 196 197 198 200
ROM&OCD 242 239 249 245 241 238 234
Penalties/Incentives 53 (21) 52 - - - -
Revenues 922 852 851 792 790 791 847
EBIT 459 386 405 344 346 349 407
Adj. Taxes (138) (116) (122) (103) (104) (105) (122)
NOPLAT 321 270 284 241 242 244 285
D&A 220 228 197 196 197 198 200
Operating CF 541 498 481 436 439 442 485
Net Capex (173) (210) (171) (220) (225) (236) (236)
∆ NWC (5) 4 (0) 6 0 (0) (6)
∆ in other op. A&L 10 (2) (9) 5 1 (1) (1)
Investing CF (167) (208) (181) (208) (224) (237) (243)
Electricity Distribution | Spain FCF 374 290 300 228 215 205 242
Source: Company data; Analyst’s estimates
We anticipated a long-run growth rate for this unit of 0,5% due to the mature nature of the business. This implies a Reinvestment Rate of 7,5%, given our
4,0% 5,0% 6,0% 7,0% 8,0%
2
0
1
0
2
0
1
1
2
0
1
2
2
0
1
3
E
2
0
1
4
E
2
0
1
5
E
2
0
1
6
E
2
0
1
7
E
2
0
1
8
E
2
0
1
9
E
2
0
2
0
E
RRAB RRAB after taxes
GAS NATURAL FENOSA COMPANY REPORT
PAGE 18/38 projected ROIC for 2022 of 6,7%33. A 1% growth rate would imply a 15% Reinvestment Rate.
The problem of the electricity tariff deficit has, however, not been resolved. On the beginning of December, the Senate acknowledged there will be a tariff deficit again for 2013. This increases uncertainty about the final outcome to utilities from the energy reform. The government will no longer disburse a EUR 2,2bn credit line to fund the deficit, nor pay for 50% of the non-mainland costs. The 2013 deficit will be 14% funded by GAS, according to FADE (Fondo de Titulización del Déficit del Sistema Eléctrico)34. The Ministry of Finance has agreed to work with the Ministry of Economy, the Ministry of Industry and with the electricity sector, in order to define possible mechanisms for the securitization of the electricity tariff deficit by the utilities or by FADE. Nevertheless, these are clear negative news for the sector.
Gas Distribution in Spain
The gas distribution operations in Spain include the third-party access to GAS’ distribution networks and regulated distribution activities. By the end of 2012 it represented 18% of total EBITDA.
The remuneration of the gas distribution unit is regulated and it is the result of prior year revenues inflated by a formula that incorporates the Spanish PPI and CPI, an efficiency factor, connection points’ growth, and volume growth. This remuneration scheme is not updated since 2002, year in which GAS’ annualised revenue was set at 809 million euros.
Value drivers include change in connection points and in volume, gas penetration level (currently at 27% in Spain, according to GAS) and opex/capex efficiencies. Adding connection points for low levels of capital expenditure can add value. Being dependent on volumes, the evolution of gas consumption in Spain is also relevant. From 1985 up to the year of the beginning of the financial crisis (2008/09), the consumption of natural gas in Spain grew strongly, with a compounded annual growth rate of 11% between 2002 and 2008. This was motivated by an increased use of gas in industrial processes and the introduction of CCGT power plants in the face of improved performance and reduced CO2
emissions. However, a noticeable drop in the consumption levels was felt immediately after the crisis hit, with a drop from 37,2 to 33,2 bcm between 2008 and 2009. This negative trend endured until 2012 (30 bcm). We expect a
33
If we include goodwill for the ROIC estimation, then ROIC would be equal to 5,4% by the end of 2022, implying a Reinvestment Rate of 9,3%.
34
FADE is a finance vehicle designed to finance the regulatory receivables through capital markets. For further reading on this issue: Informe 10/2011 de la cne sobre la propuesta de modificación del real decreto 437/2010, de 9 de abril, por el que se desarrolla la regulación del proceso de titulización del déficit del sistema eléctrico.
Figure 35: Fixed Assets per Connection Point
Source: Company data; Analyst’s estimates
Figure 36: Gas Consumption in Spain (bcm)
Source: Eurostat
Table 7: Sensitivity Analysis to the WACC (Vertical Axis) and Growth Rate (Horizontal Axis) for the Electricity Distribution unit in Spain
0,0% 0,5% 1,0% 1,5% 2,0%
4,0% 7,0 7,8 8,8 10,2 12,3 4,5% 6,2 6,8 7,5 8,5 9,9 5,0% 5,6 6,1 6,6 7,3 8,3 5,5% 5,1 5,5 5,9 6,4 7,1 5,6% 5,0 5,3 5,7 6,2 6,8 6,0% 4,7 5,0 5,3 5,7 6,2 6,5% 4,4 4,6 4,9 5,2 5,6
GAS NATURAL FENOSA COMPANY REPORT
PAGE 19/38 recovery of demand to be felt in the near future fomented by improved economic outlook, but not yet to the levels of 2008.
Table 8: FCF Gas Distribution in Spain (EUR million)
2011 2012 2013E 2014E 2015E 2016E 2017E
EBIT 612 611 675 671 666 669 674
Adjusted taxes (184) (183) (202) (201) (200) (201) (202)
NOPLAT 428 428 472 470 466 468 472
D&A 284 289 262 265 274 283 291
Operating CF 712 717 734 735 740 751 762
Net Capex (99) (221) (303) (364) (374) (366) (366)
∆ NWC 12 (8) (10) (2) (2) (2) (2)
∆ in other op. A&L 1 1 (2) 1 1 1 1
Investing CF (86) (229) (315) (364) (374) (367) (367)
Gas Distribution |
Spain FCF 626 488 419 371 366 385 396
Source: Company data, analyst estimates
We estimate this unit’s value per share to be equal to EUR 8,6.
The gas sector presents also a tariff deficit. Although not comparable in size to that of the electricity sector (accumulated 300 million euros vs 26 billion euros), we trust that it should not be disregarded.
Having undertaken electricity reform, the Secretary of State for Energy has mentioned that in 2014 they might look into the gas sector as well. The Secretary of State supports that remuneration should continue to depend on the number of consumers and on gas volumes, however there is excess capacity of gas facilities in the face of current demand.
The gas sector is different to the electricity sector in the following points: the penetration level is still low (7,5 million customers for a 47 million Spanish population, while there are 27,7 million electricity customers), and each new connection point is likely to have a positive impact on the tariff deficit and thus investments are encouraged. For this reason, we assume a capex plan for the gas distribution unit in Spain of around 300 million euros per year, in line with GAS’ guidelines.
On top of volume and tariff deficit risks, there are three factors unfavourable ahead of a potential change in regulation: (1) The system is not revised since 2002, which increases the probability of revenue cuts, even if there was no tariff deficit; (2) The electricity reform was harsher than anticipated; and (3) Natural gas prices in Spain have been climbing up to European averages.
Given that the quantifying impact of a new regulation has not been designed yet, we were cautious in its applicability to our current estimates. Having said this, we
Figure 37: Gas Prices for Industrial Consumers (EUR/KWh)
Source: Eurostat
Figure 38: Gas Prices for Domestic Consumers (EUR/KWh)
GAS NATURAL FENOSA COMPANY REPORT
PAGE 20/38 analysed a few hypothesis to try to understand the impact of a potential regulatory change.
A common (and the easiest) approach is to cut revenues by the tariff deficit amount and distribute it in a proportional manner among the participating agents (GAS has a market share of about 60% in terms of supply). We believe this approach is unlikely, as it would not resolve the fact that the remuneration scheme is obsolete and it could produce distortions in the companies’ profitability as it would demand the same cuts to assets with different durations.
Moreover, we do not expect a change of the gas distribution operations to the electricity distribution regulation formats, as the secretary of state has announced that such a remuneration scheme (that is, RAB-based) will not be applied to the gas sector. He stated that the gas tariff deficit, although it appears to be structural35, is smaller than the electricity one, and the gas market is still immature. Nevertheless, we computed such an hypothesis and got a EUR 7,5 value per share (-13%)36.
We anticipated a long-run growth rate for this unit of 0,5% due to the mature nature of the business. This implies a Reinvestment Rate of 4%, given our projected ROIC for 2022 of 13,9%. A 1% growth rate would imply a 7% Reinvestment Rate.
Electricity Generation
The electricity generation business in Spain includes the electricity production, and the supply & commercialisation of energy. We also incorporated the operation of the 100 MW coal power plant in Kenya. By the end of 2012 these two operations represented 18% of EBITDA.
Technologies differ in terms of primary source of energy, flexibility (to meet demand at peak versus base-load hours), and cost structure. There are three methods for contracting for the electricity price: wholesale, bilateral contracts and auctions.
The wholesale market has different moments: a day-ahead market, several intraday markets and the ancillary service market. The day-ahead market works in the following manner: generators offer the minimum price they are willing to receive to generate a certain amount of electricity (marginal cost37) and offers are organized in ascending order, meaning that when demand is high technologies
35 Will not be solved unless tariffs are raised or system costs cut. 36
For this analysis we made simplifying assumptions and applied the exact same methodology as with the current electricity distribution remuneration scheme. We do not incorporate the results in our estimates.
37
The marginal cost of a thermal facility is given by / ∗
& ! .
Figure 39: Prices per Technology (EUR/MWh)
Source: EDP (Assumes 5.000 working hours for CCGT power plants and 7.500 for coal)
Figure 40: Variable versus Fixed Costs per Technology
Source: EDP
Table 9: Sensitivity Analysis to the WACC (Vertical Axis) and Growth Rate (Horizontal Axis) for the Gas Distribution unit in Spain
0,0% 0,5% 1,0% 1,5% 2,0%
4,0% 11,3 12,5 14,2 16,4 19,8
4,5% 10,1 11,0 12,2 13,7 15,9
5,0% 9,1 9,8 10,7 11,8 13,3
5,5% 8,3 8,8 9,5 10,4 11,5
5,6% 8,1 8,6 9,2 10,0 11,0
6,0% 7,6 8,0 8,6 9,2 10,1
6,5% 7,0 7,4 7,8 8,3 9,0
GAS NATURAL FENOSA COMPANY REPORT
PAGE 21/38 with higher marginal costs will be put into operation and vice versa. The convergence between this offer curve (merit order curve) and demand sets the regulated price at which energy is sold to retailers (more detailed explanation in
Appendix 1)). The retailers are able to sell to end-users at unregulated tariffs.
For the forecast of this unit’s revenues we divided the business into two parts, the generation tariff part, which is dependent on the pool price, and the access tariff to cover the generation costs, which includes regulatory items such as capacity payments.
Having said this, we identified for the generation business the following value drivers: i) electricity demand in the face of economic recovery; ii) load factors, spark spreads and pool prices; and iii) regulatory items such as capacity payments. We estimated a value per share of EUR 4,3 for this unit (including the operation of the coal power plant in Kenya).
Table 10: FCF Electricity Generation in Kenya and Spain (EUR million)
2011 2012 2013E 2014E 2015E 2016E 2017E
EBIT 212 279 265 368 418 520 515
Adjusted taxes (64) (84) (80) (111) (125) (156) (154)
NOPLAT 148 195 186 258 293 364 360
D&A 565 599 500 491 489 487 487
Operating CF 713 794 685 748 781 851 847
Net Capex (242) (140) (317) (451) (450) (487) (487)
∆ NWC 96 (109) (50) 69 (0) (23) (5)
∆ in other op. A&L 10 5 (8) 1 2 (0) (1)
Investing CF (136) (244) (375) (382) (448) (509) (493)
Electricity Generation |
Spain FCF 577 550 310 367 333 341 354
Source: Company data, analyst’s estimates
i) Demand: In terms of electricity demand one should not only look at Spain, but also at its trading partners: Portugal, France, Andorra and Morocco. It can be seen in Figure 41 that Portugal is the main importer, while France is the main exporter, relative to Spain. However, Spanish demand is clearly the most important factor, as Spain has one of the lowest levels of interconnection in the EU and efforts to improve cross-border capacity between Portugal and France are of the utmost importance to improve market competitiveness. Nominal short-run marginal costs, nevertheless, are levelled for the three countries.
Red Eléctrica de Espana identifies three explanatory variables for energy consumption: labour, temperature and state of economy. Demand and GDP growth have in fact a close relationship. During the financial crisis, electricity consumption decreased significantly, in line with GDP, and the end-user forcedly
Figure 41: Exports minus Imports to Spain (GWh)
GAS NATURAL FENOSA COMPANY REPORT
PAGE 22/38 became more energy efficient, something that we expect to be sustained even after the economic recovery. This means that energy consumption growth will follow economic growth with a lag, and a slight decouple between GDP growth and consumption growth is expected (Figure 42). Although all consumers were given the option to switch between power utilities in the EU, it has been mainly the medium-to-large size industrial consumers that took advantage of this opportunity to improve margins38. Gross inland consumption of energy to GDP (energy intensity) is lower in Spain than in other European Countries.
If electricity demand was to be flat at 2012 levels, this unit’s value per share would decrease to EUR 3,7 ( -14%).
ii) Load factors39,spark spreads and pool prices: GAS has a capacity mix biased to CCGT power generation and this technology has recently experienced a decrease of average load factors in Iberia.
The decrease in CCGT load factors is explained by recent high hydro levels and the development of renewables, which have dispatch priority. Moreover, the creation of the CO240 market did not have the expected effect.
The spark spread is the gross margin of a gas-fired power plant, calculated using natural gas costs and on-peak power prices. It contrasts with the dark spread, a metric that is used to estimate returns over fuel costs of coal-fired electric generators. IHS CERA expects the recent negative trend in spark spread to continue, at least until 2017, re-enforcing the idea of low CCGT output in the future and increase of renewables supply in detriment of other technologies. This tendency for poor margins in gas-fired power plants is expected to be present in most European countries. The spread analysis is consistent with GAS strategy of reduced investment for the generation segment considering its high installed capacity in CCGTs (capex plans are 100% maintenance, while in the past 25% was allocated to growth).
CCGT power plants emit less CO2 than coal plants, but national coal is
subsidized41, and the position in the merit order curve varies between these two technologies, depending on the fuel and carbon prices magnitude. We do not
38 Unfortunately, we were not able to find data on energy demand for industrial versus domestic consumers, but we would expect that the demand from industrials is more elastic to changes in GDP. Competitive retail prices is crucial as industrials, unlike domestics, may be willing to take their operations abroad so as to improve cost efficiency.
39
Load factor is the ratio of energy demand (electricity generated) to the maximum energy it could have been produced at full capacity.
40
CCGT power plants emit less CO2 than Coal power plants. According to the Kyoto protocol, each participant country was assigned with a respective ceiling for CO2 emissions, which were then converted through the national plans for emission allocation in European Allowance Units (EAU). The licenses could be traded under three market mechanisms: the European Union Emission Trading Scheme; the Clean Development Mechanism; and the Joint Implementation. In practical terms, what the Kyoto protocol created was a new market: the market for carbon, in which market participants could trade according to their emission needs. Thus, the CO2 price is now part of the value chain.
41The subsidies for domestic coal production have been extended until the end of 2018.
Figure 42: Electricity Demand in Spain and Relation with GDP
Source: IMF; REE; Analyst’s estimates
Figure 43: CCGT Load Factors in Iberia
Source: REE
Figure 44: CO2, Coal and Gas Prices
GAS NATURAL FENOSA COMPANY REPORT
PAGE 23/38 expect CCGT load factors to recuperate, in line with the negative IHS CERA estimates for the clean spark spreads. CO2 prices are dependent on political
decisions and thus its estimation is unpredictable (we expect they will stay flat YoY, however, as backloading discussions progress a further rationalization of allowances is a possibility).
Our expectations for the pool prices were the following - for 2013 we assumed the 2013 year-to-date pool price, and for 2014-2016 we relied on the OMIP forward prices. For 2017 we relied on IHS Cera’s estimates, and from then onwards we assume a stabilization of prices and a slight convergence of pool prices between France, Portugal and Spain. Although there were efforts to improve the level of liberalisation on the EU energy market, there are still significant differences in retail prices (by then end of 2012, Cyprus had the highest retail prices for domestic consumers, at 0,241 EUR/KWh and Macedonia the lowest at 0,037 EUR/KWh) and thus, it does only make sense to assume a price convergence between countries with electricity interconnections.
iii) Regulatory items: The capacity payments include two types of services: an incentive to invest in long-term capacity (needed to ensure coverage of the demand in the long-term) and service availability in the medium-term. Prior to RDL 9/2013 capacity payments on investments were set at EUR 23,4k per MW installed per year for the first 10 years of operation. However, in the current context of low demand and reduced risk of capacity deficit, RDL 9/2013 considers the urgent reduction of the payment to EUR 10k/MW/year, but for twice as long as the time remaining until reaching the 10 years of operation. This change in remuneration has an impact of EUR 1 per share on this unit’s value, assuming that for the long-run we are maintaining RDL9/2013’s remuneration format.
Prior to RDL 9/2013 the capacity payments for the availability-of-service was set at EUR 4,7k/MW/year for the conventional plants and EUR 1,2k/MW/year for hydro plants. The recent decree law defined that the payment is now based on the opportunity cost of the most efficient technology (CCGT) and forecasts for capacity backups, while hydro plants will no longer receive payments. We also expect the availability-of-service capacity payments to remain stable throughout the period of analysis.
The generation unit in Spain and Kenya has a value per share of EUR 4,3. During the strategic presentation, GAS admitted a long-run pool price (from 2017 onwards) of EUR 61. We do not found grounds to support such an increase in prices but, if we incorporate this 61 EUR/MWh into our model, the result would be an increase in the unit’s value to EUR 7,2 per share, highlighting this unit’s large
Figure 45 CO2 Price since 2008
Source: Bloomberg
Figure 46: Clean Spark Spread, Clean Dark Spread and Pool Prices in Spain
Source: IHS Cera; Analyst’s estimates
Table 11: Sensitivity Analysis to the WACC (Vertical Axis) and Growth Rate (Horizontal Axis) for the Electricity Generation unit in Spain
4 0,0% 0,5% 1,0% 1,5% 2,0%
4,5% 5,0 5,3 5,8 6,4 7,3 5,0% 4,6 4,8 5,2 5,7 6,3 5,5% 4,2 4,5 4,7 5,1 5,5 5,8% 4,1 4,3 4,5 4,8 5,1 6,0% 4,0 4,1 4,3 4,6 4,9 6,5% 3,7 3,9 4,0 4,2 4,5 7,0% 3,5 3,6 3,8 3,9 4,1