A Work Project, presented as part of the requirements for the Award of a Masters Degree in Management from the NOVA – School of Business and Economics.
L’ORÉAL ACQUISITION POLICY.
THE BODY SHOP CASE STUDY.
FRANCESCA RICCI, #1844
A Project carried out on the Applied Corporate Finance course, under the supervision of: Prof. Paulo Pinho
L’ORÉAL ACQUISITION POLICY.
THE BODY SHOP CASE STUDY.
Abstract
The Work Project I present focuses on the analysis of L’Oréal acquisition policy, trying to outline if the M&A deals it has led over the last 14 years have succeeded in creating value. By replicating the model proposed by Todd Hazelkorn, Marc Zenner and Anil Shivdasani in their paper “Creating Value with Mergers and Acquisitions”, I analyzed the 29 M&A deals that L’Oréal has led worldwide, understanding the common factors able to explain the success of such transactions. Further, I focused on The Body Shop case study, a highly criticized and controversial acquisition that has proved to be profitable and able to create value.
PURPOSEOF THEPROJECT
The following Work Project provides an insight on L’Oréal acquisition policy. Having this company proved to be able to grow over years by implementing a successful acquisition strategy, it is my purpose to understand whether those transactions have enhanced the company’s value and if there is a common path followed among the deals. Understanding the M&A mechanisms, both in general and in the specific case of L’Oréal, can help in this analysis. For this reason, in the first chapter I will focus on the M&A theory, trying to outline the strategic rationale behind such deals, which represent the main factors able to effectively create value. Further, I will provide a more specific analysis on brand value, since I strongly believe that it is fundamental for a deeper understanding of the Body Shop case study, which will follow in the third chapter. In second chapter I will focus on a general analysis of the Cosmetic market, the one in which L’Oréal operates: despite developing in these contemporary years of financial crisis, this market is fast-growing. It is also interesting to have a look on the Natural, Organic, and Ethical Cosmetic market, a niche sector that is rapidly gaining its market share in the cosmetic field.
CHAPTER1–DEALINGWITHANM&APROJECT
1.1 Reasoning and potential benefits behind the transaction
An M&A project is composed by all those activities necessary to conclude a transaction in which two companies merge, or one is acquired. Specifically, a merger is defined as a legal consolidation of two firms into one entity, while an acquisition occurs when one company takes over the other, establishing itself as the owner of the new born entity. Large synergies are by far the most common justification of such deals and they are usually defined in terms of cost reduction and revenues enhancement. Unfortunately, there is no magic formula able to make a deal successful: only well-articulated value creation ideas can lead to satisfactory results. The strategic rationale for a deal that creates value, typically conforms to one of the following five archetypes1:
1. Improve target company’s performance. It is among the most widespread
value-creating acquisition strategies. It consists in buying a firm with the aim of reducing costs to improve margings and cash flows. This is what private-equity firms do.
2. Consolidate to remove excess capacity from industry. As industries mature, they
usually develop excess capacity, which generates higher supply than demand. It is in no individual competitor’s interest to shut a plant and becoming smaller: companies find it easier to shut plants across larger combined entity deriving from an M&A.
3. Accelerate market access for the target’s (or buyer’s) products. It is linked to
the difficulties met by small companies with innovative products in entering markets. Thanks to acquirer’s force, this limit can be overcome. In some cases, also the opposite scenario (the target accelarates acquirer’s revenues growth) is possible.
4. Get skills or technologies faster or at lower cost than they can be built: it means
1
using M&As for closing gaps in technologies and know-how and growing faster.
5. Pick winners early and help them develop their businesses. It consists in making
acquisitions early in the life cycle of a firm. This strategy requires a disciplined approach over three dimensions: first, you must be willing to invest early, under uncertain conditions; second, you need to make multiple bets and be prepared for those that will fail; third, patience and skills are needed for nurturing the new firm. Next to company’s specific strategic objectives, also market analysis can give valuable insights on M&A opportunities: their combination could be a powerful tool for success.
1.2 Brand equity value
Brand equity is defined as the value premium that a firm can realize from a product and which makes it recognizable with respect to its competitors. Nowadays, brand is more than a tagline: it is a set of expectations towards a company or a specific product, able to evoke in consumers’ mind feelings and perceptions. Companies create it by making products memorable, easily recognizable and superior in quality and reliability. A study by EquiTrend2 has shown the strong impact of brand equity on company’s performance: firms experiencing the largest gains in brand equity also register ROI average to 30%. Conversely, firms recording weak brand equity value have average negative ROI. Especially for those companies pursuing an acquisition-based growth strategy, a proper brand equity management, according to the three following guidelines3, is fundamental:
• Conducting a marketing due diligence before starting the deal. This means
answering the following question: what would occur if a substantial fraction of
2
EquiTrend ranks. http://www.harrisinteractive.com/Products/EquiTrend.aspx[Accessed on March 2014] 3
customer would desert the company post-transaction because it does not meet their expectations? Great care should be put on brand management in order preserve its value. Nowadays, ASB in UK, France and Australia, together FASB (rules 141-2) in US, allow recording brand value on balance sheets: just as businesses, brands are valued on the basis of their expected cash flows discounted at a brand risk rate.
• Carefully think about brand strategy in the context of a portfolio. A framework
should be created in order to evaluate target brand’s impact in terms of synergies.
• Establishing brand migration plans in order to maximize the brand value in the
deal: it is done through properly managing the integration of customer touch-points. In order to reach the right brand valuation, three steps have to be followed. First,
Segmentation: since brand value depends on who is buying whom and for what purpose,
it is necessary to consider all candidates for the deal in order to choose the best one. Second, Segment Profitability: it is the financial analysis to forecast business cash flows of each segment. Third, Brand Influence: in this step brand cash flows are separated from business cash flows on the basis of the drivers of customers’ demand. Drivers are then ranked in order of importance to get a weighting. Afterwards, they are multiplied by brand’s influence on each driver, so achieving an overall measure of brand influence on demand. As a result, each segment will yield at a different level of brand influence. Brand cash flows are then obtained by multiplying each business segment’s cash flows by brand influence in each segment. By discounting cash flows at an appropriate brand-related rate (got by benchmarking the firm against competitors), the Economics Brand
CHAPTER2–COSMETICMARKET
2.1 Sector evolution and trends
The cosmetic market is that sector related to all those care products used to enhance human body’s appearance. It can include different types of substances, not only sourced from natural ingredients, but also chemical and synthetic. Further, nowadays with the widespread of the “cult for the aesthetics”, people’s interest towards this sector has significantly increased. That is why this industry has succeeded in being resilient – but not completely immune – to the effect of the recent financial crisis. The economic justification of this strength is known as “Lipstick Effect”4: it is relationship between the cosmetic sector and the global economy, according to which the former tends to rise even if the latter drops. This happens because consumers are not willing to sacrifice on cosmetics, since they are perceived as relatively inexpensive and make people feeling good. Therefore, the general path of the industry has kept its positive trend over years. Indeed, according to recent financial studies, in 2011 the sector was worth $285bn, an increase of 3.9% than 2010. To better understand this booming, I performed an analysis from 2000 to 2013 on the quarterly indexed returns of a sample of 46 companies. In this sample, I only included companies producing skincare, make-up and perfumes products, and not those operating in pharmaceutical, cosmetic surgery and chemical field.
Let RetCom be the dependent variable, representing the indexed returns on the cosmetic
market, and let t be the independent variable, indicating the time interval from 2000 to 2013. I plotted them in order to analyze the overall trend. In Figure 2.1 (Appendix) the path is clearly upward, a part from the two drawdowns at the end of 2008 and 2011. Indeed, the linear tendency line drawn in the graph identifies a positive slope-equation
4
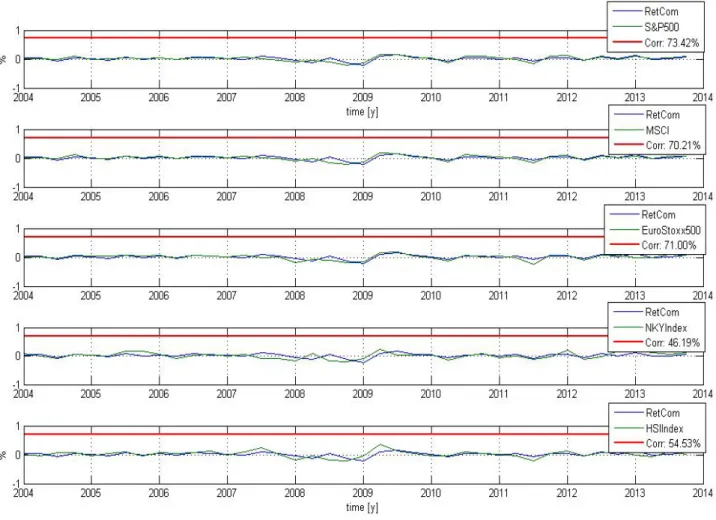
order to study the correlation –indicated as r–, that is the amount of linear association between two variables. Figure 2.2 (Appendix) shows satisfactory results: all the correlation values are quite high. Specifically, the correlation with the S&P500 is the highest, equal to 0.7342, even if the other correlation values are relevant as well. It is another positive result that supports the past upward trend of the cosmetic market and its positive past performance in line with the main global indexes.
2.2 Natural, Organic, and Ethical cosmetic driven by customers’ awareness
In recent years a new sector has rapidly developed within the cosmetic market: the
“Natural, Organic, and Ethical cosmetics”5. It consists of those products ethically
sourced and made from natural ingredients. In the 2000s, this niche sector started to gain popularity, attracting large multinational companies, which entered the market through M&A deals. Nowadays, it has become a second mainstream, mainly thanks to the raising consumers’ awareness towards “green issues”. Indeed, a new generation of consumers has widespread: the “New Affluents”4, who move away from conspicuous consumption, looking for brands that are innovative, high quality, but most of all sustainable. Indeed, according to the Biodiversity Barometer 2012 report (Union for Ethical Bio Trade), 85% of people look for natural ingredients in cosmetics products. The natural cosmetic market has literally performed a climbing to the top: in 2011 sales were equal to $9bn, 3% of the cosmetic market, and they are expected to achieve $14bn by 2015, an increase of 55% than 2011. Let be RetNat be the dependent variable, representing the quarterly indexed returns of the few listed companies belonging this sector, and let t be the independent variable, indicating the time interval from 2002 to 2013. From plotting them, the resulting trend-line equation reported in Figure 2.3
5
(Appendix) has a positive slope (RetNat=0.0014 t−0.0192). This supports evidences in favour of the sector’s past well-performing path, in line with the cosmetic market. However, the R2 value is still too low (0.02822) to support evidences of a future well-performance of the sector. Even if it is higher than the one recorded for the Cosmetic market, it is still not enough to consider the model as a valuable and reliable future-path predictor. To conclude, since the natural cosmetic is a fast-growing sector, M&A waves by large multinational firms are common: L’Oréal’s acquisition of The Body Shop is among them. Even if such contradictory deals raise people’s disappointment, they should be seen as the chance for this market to pursue a more ethical and sustainable growth.
CHAPTER 3 – L’ORÉAL ACQUISITION POLICY
3.1 Companies Overview
L’Oréal S.A. is nowadays one of the largest companies belonging to the cosmetic market6. Operating in 130 countries, the company has been able to record increasing revenues and profits even during the worst years of financial crisis. Indeed, they raised respectively by 10.4% and 17.6% between 2011 and 2012. Born in 1909 from the idea of Eugene Schueller, a French chemist, the company suddenly saw a rapid expansion and built its dominant position in the cosmetic market. Nowadays, the firm is divided into three main business lines: Cosmetics, The Body Shop and Dermatology.
Founded in 1976 by the human right activist Anita Roddick, The Body Shop7 is a UK-based company that has been able to become a leader in the Natural, Organic and Ethical Cosmetic market, mainly thanks to L’Oréal’s acquisition in 2006. The company
6
http://www.loreal.com/default.aspx [Accessed on March 2014] 7
sells a range of cosmetic products, made from natural ingredients, all ethically and worldwide sourced. During the late 1980s and 1990s, the firm enjoyed a dominant position in the market, since it was one of the few suppliers of natural and ethical cosmetics. However, things changed in the early 2000s, as this niche market became popular. Hence, The Body Shop lost its dominant market position, at least until 2006. The company pursues its five core values – Support Community Trade, Defend Human
Rights, Against Animal Testing, Activate Self Esteem, and Protect Our Planet – through
promoting human rights issues and campaigns all over the world (among them, Stop Child Trafficking, Stop Violence in the Home, and Stop HIV). On the basis of these premises, The Body Shop has developed a chain of values, with the aim of creating a
“Force for Good”7. It is a virtuous circle, since “everything they learn at each phase of
the process is re-invested in the development of the next product”2:
The steps are in order: “Research and Development” (Customers want products that make a difference. For this purpose, the right formulations and ingredients have to be
Figure 3.1
chosen); “Sourcing and Production” (Specific sourcing programmes help in reassuring customers about what goes into products); “Distribution and Packaging” (The Body Shop is highly committed in reducing carbon footprint); “Stores, Staff and Franchises” (Stores are the face of The Body Shop; staff are the voice of the brand); “Engaging our
Customers” (The company’s ambition is to look good, feel good and do good).
Given this analysis about The Body Shop values and ambitions, it is clear how they significantly differ from the ones of L’Oreal. However, as already anticipated, in recent years The Body Shop has struggled: many competitors entered the market and chipped away its dominant position. Further, customers’ passion for natural and ethical cosmetics was not enough to avoid its stores to be overstocked and cluttered. Therefore, in 1998 Anita Roddick stepped down as a head of the firm and The Body Shop started a radical makeover of its operations and management structure, trying to cut down costs and fresh its image. The so-called “Masstigel” positioning8 was started: it consisted in developing innovative products at affordable prices. Although this new approach seemed to be a good escape from the negative performance of those years, the proposal of acquisition by L’Oréal in 2006 was seen as the lifeline the company was waiting for.
3.2 L’Oréal growing trend reached through acquisitions
With the aim of pursuing its values6 of “innovation in beauty”, “striving for excellence” and “valuing individual talent”, L’Oréal has led a global expansion strategy over years, incorporating new domestic and foreign brands into its existing portfolio.
The aim of the research that I led was to understand how L’Oréal has decided to make those acquisitions and if there has been any specific factor able to explain whether they ended up in being a success or a failure. Therefore, I analysed the M&A deals led from
8
2000 to 2014. Over this range of time, the company concluded 29 transactions, most of which acquisitions. However, this rapid expansion faced a slower trend during the end of 2008 and 2012, as no deal was completed. Based on the paper by Todd Hazelkorn and Marc Zenner, from City Group, and Anil Shivdasani, from University of North Carolina9, I analysed both the short- and long-term reaction of L’Oréal stock price at the announcement date, trying to understand whether shareholders’ value has been enhanced. Knowing that excess stock returns are the stock’s actual returns adjusted for market movements, I computed them using the MSCI World Index as a proxy for the market return. This choice was led by the fact that L’Oréal’s operations are made worldwide and, in my opinion it was the best index able to represent the global market. According to the paper, the fairly short time intervals surrounding the initial announcement where respectively the five-day window (two days prior and two days after the initial announcement) and the 21-day window (ten days before and ten days after the announcement). However, in M&A deals it is also important to consider the long-run perspective, as post-merger integration and execution are often critical to the success of a transaction. Hence, I based the long-run analysis over a one-year and
two-years window. This time, the index that I chose as a proxy for the cosmetic industry was
the Bloomberg Cosmetic Market Index (BWCOSM Index). Nevertheless, even it is the index providing the largest amount of data, no information is disclosed before 2003. The results I obtained from my analysis are reported in Figure 3.2 (Appendix). Even if the amount of transactions on which I built the sample is relatively small, the histogram shows results highly consistent with the ones described in the paper. Indeed, there is a wide variation in excess returns, with a higher concentration on extreme values (>5%),
9
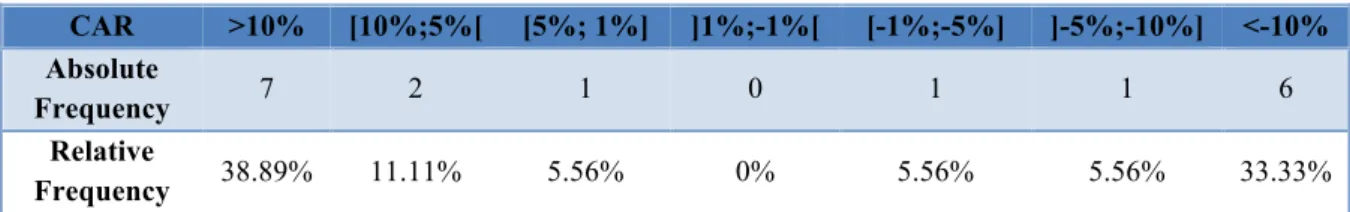
than around 0%. This phenomenon becomes more evident with the longer-term observations, starting from the 21-day window frequency distribution of excess returns, until the 1-year window results, which are repoted in Table 3.2 below:
CAR >10% [10%;5%[ [5%; 1%] ]1%;-1%[ [-1%;-5%] ]-5%;-10%] <-10%
Absolute
Frequency 7 2 1 0 1 1 6
Relative
Frequency 38.89% 11.11% 5.56% 0% 5.56% 5.56% 33.33%
From this analysis it is possible to conclude that, on average, short-term excess returns tend to anticipate and forecast the long-term reaction of the market at the deal announcement. Therefore, looking at the short-horizon results could help in understanding both the present and future market reaction –as the future the reaction will usually have the same sign but larger excess returns– and the deal’s ability to enhance shareholders’ value. However, the model is not limited to the analysis of the excess returns: I also tried to figure out which factors could be the indicators of the M&A success. According to the paper, five indicators have to be taken into account while analysing a deal. I replicated them on L’Oréal’s data and the results I achieved are consistent with the ones described in the paper. Specifically:
• Financing Structure (Cash- vs. Stock-based). The way in which an acquisition is
the subsequent pressures to repay debt provide incentives in realizing synergies and carefully managing the integration process.
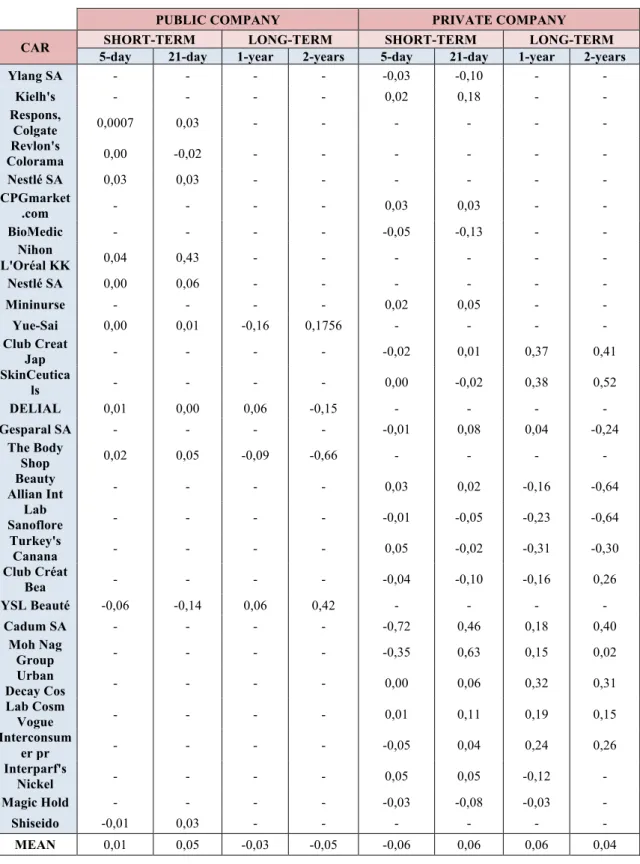
• Target company status (Public vs. Private). Most of L’Oréal’s deals have been
M&A operations towards private companies. Indeed, only 10 out 29 firms were public. Figures 3.1.2 (Appendix) provides evidences of how acquisitions of private firms have been more profitable than the ones of public. There are three possible explanations. First, acquisitions made on public firms are usually broader in scope and more prone to complex integration problems. Second, public firms usually have an already defined public price, which usually includes a sizable premium. Since private companies do not have any established public valuation benchmark, they do not even have a sizable premium. Finally, it is common that private firms are paid in cash, which, as already proved, leads to higher excess returns.
• Earnings growth. This factor shows that excess returns are higher when the target
has low projected earnings-growth rate. Since this analysis can be done only on companies that were listed –only 10 – even if the results I obtained are coherent, due to the low amount of data available I do not think this factor is reliable for this case.
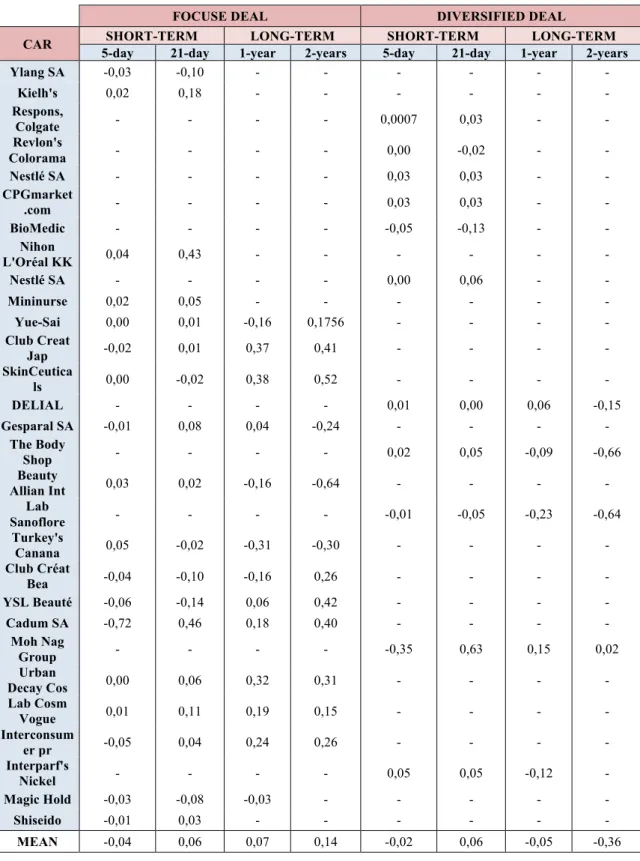
• Focused vs. Diversified deal. Table 3.1.3 (Appendix) provides evidences that
focused transactions outperform diversified ones. A part from the quantitative results, I think that the explanation of this phenomenon is intuitive: focused deals are more successful because it is easier to realize synergies and fixed strategic objectives when buying a firm operating in the same industry.
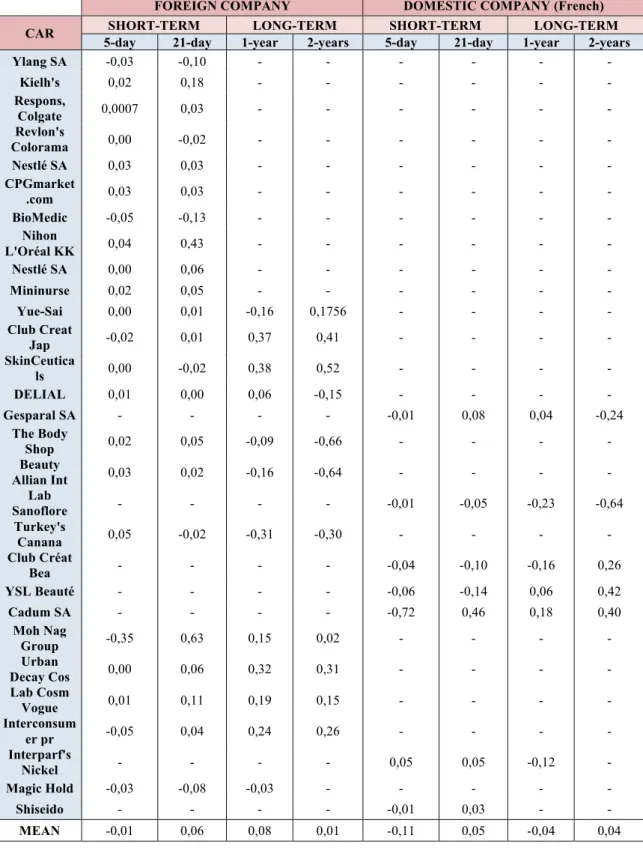
• Foreign vs. Domestic target. Table 3.1.4 (Appendix) explains the last factors
acquisition strategy since it is the faster way for reaching broader geographic markets and accessing local technological expertise. Indeed, looking at the analysis I did, most of transactions are led with American or Asian firms, supporting the thesis that foreign investments open up the doors to a broader range of opportunities.
3.3 The Body Shop acquisition: strategic rationale, leading synergies and the
impact on shareholders
On June 200610, after a negotiation lasted for several months, L’Oréal and The Body Shop concluded an agreement for which the former acquired the latter for USD 1,064 mln (GBP 652,3 mln). It was the case of an M&A deal between two completely different companies, with differing values and products. However, I think that by understanding the strategic rationale, the leading synergies and the impact on both companies’ shareholders, it is possible to get the real reasons behind this deal.
L’Oréal acquired The Body Shop with the aim of increasing its target’s revenues, while adding a complementary brand with a strong identity to its own portfolio. Anyhow, even if most of L’Oréal’s recent growth is not attributable to The Body Shop, the
strategic rationale that have pushed the firm towards this acquisition can be mainly
identified in the target's brand equity value. Indeed, as the founder Anita Roddick commented11, this deal was the chance for The Body Shop to retain its core values, while influencing the new parent company from the inside. Therefore, inspired by The Body Shop’s Community Fair Trade program, in 2010 L’Oréal started many ethical and sustainable campaigns. Hence, the strategic rationale behind the deal can be interpreted as L’Oréal’s response to a shift in public’s perception and values, with increasing consumers’ awareness towards the natural, organic and ethical cosmetics.
10
In turn, also The Body Shop would have benefit from the deal by accessing L’Oréal’s research and development tools, as well as marketing expertise, while keeping its own identity and developing as a stand-alone unit within L’Oréal Group. “A partnership
makes perfect sense”11, said Sir. Lindsay Owen-Jones, L’Oréal CEO, and it is actually
what has been done. However, since the beginning this acquisition received much criticism, due to the huge difference in values between the two firms. Both industry experts and animal rights campaigners saw the deal as controversial, mainly because of L’Oréal’s tests on animals12, highly in contrast with The Body Shop’s philosophy. Further, in the four years following the acquisition The Body Shop’s annual sales felt by 2.5%. However, it has been claimed that this drop has been mainly linked to the high costs associated with the ingredients used, and not to L’Oréal’s unethical practises. Concerning synergies behind the deal, according to the model described in the previous paragraph, The Body Shop, not only showed positive excess returns after the acquisition, but it also belongs to most of the outperforming categories. Indeed, it has been a cash-financed deal, led on a company that was running bad –thus, with low projected earnings growth– and belonging to a foreign country. Anyhow, The Body Shop was a listed company operating in a different business from L’Oréal. Table 3.3 shows positive short-term trends followed by negative long-term paths. If on one hand, the former positive results can be justify in the inital enthusiasm towards the transaction –as already said, The Body Shop saw this deal as its lifeline–, the latter negative ones perfectly reflect the company’s drop in annual sales registered in the four years after the acquisition and the huge critisms and contrasts faced by the new merge entity.
11
Pitman, Simon. 2006. “Body Shop gives nod to L’Oréal takeover”. http://www.cosmeticsdesign.com [Accessed on May 2014]
12
According to what I said until now, the strategic rationale and synergies behind the deal are clear: this acquisition was the chance for L’Oréal to enter a new market, in which The Body Shop was operating since a long time. Further, in my personal opinion, in this particular case the acquisition of a diversified business can be interpreted as a strenght for L’Oréal, since it opened up the door to a new fast-developing area.
In conclusion, it is also important to underline the benefits perceived by The Body Shop’s shareholders. According to Adrian Bellamy11, The Body Shop chairman, the acquisition was highly valuable for shareholders since “L’Oréal offered a significant premium to the share price and provided an opportunity for them to fully realise the
prospects for the group on a stand-alone basis”. Further, “for the other stakeholders,
the combination of the two organisations would provide significant strategic impetus to
The Body Shop’s growth plans for its three retail channels of stores, direct selling and
e-commerce around the world”.
To conclude my research, I decided to look at L’Oréal’s Annual Results 201313. Even if at the end of 2011 The Body Shop has only grown by 4.2%, a very low result if compared to other divisions, financial results from the last year’s annual report show that The Body Shop’s Operating Profit represented the 8.6% of the overall Group results. Even if it is a still low value, I think that in comparison with the initial results it is a positive sign of growth and recovering from the crisis. Moreover, these results are somehow coherent with the ones I obtained from the model. Indeed, even if it forecasts
13
L’Oréal Annual Results 2013. http://www.loreal-finance.com/eng/news-release/annual-results-2013-944.htm [Accessed on May 2014]
CAR SHORT-TERM HORIZON LONG-TERM HORIZON
Five-day window 21-day window 1-year horizon 2-years horizon
The Body Shop (2006) 0,02 0,05 -0,09 -0,66
positive short-term returns while negative long-term ones, the negative values are low enough to leave a margin of recovery and expectation for a positive future performance. Conclusions
Through this work project I tried to underline the strategic rationale behind L’Oréal acquisition strategy. Being a multinational firm that grows and enters new market through exploiting M&A transactions, high carefulness while starting a new deal is absolutely necessary. Cases similar to the one of The Body Shop proves that even highly criticized and controversial situations could end up successfully whether properly managed. Nowadays, M&As play a crucial role in the development of a sustainable competitive advantage. The case study I analysed is just one of the common examples of large companies acquiring small ones with strong Corporate Social Responsibility14. Indeed, CSR has become so important that whether strong and effective, it results in being both the key for entering new ethical and sustainable industries –thus, appealing costumers– and the key-driver in M&A decision-making. References
Ø Goedhart, Marc, Koller, Tim, Wessels, David. 2010. “The five types of successful acquisitions”. McKinsey & Company Insights and Pubblications, McKinsey on Finance, Number 36, Summer 2010.
Ø EquiTrend ranks. www.harrisinteractive.com/Products/EquiTrend.aspx
[Accessed on March 2014]
Ø Kumar, Shailendra, Hansted Blomqvist, Kristiane. 2004. “Mergers and acquisitions: Making brand equity a key factor in M&A decision-making”.
14
STRATEGY & LEADERSHIP, Vol. 32 no. 2, 20-2, Emerald Group Publishing Ltd. Ø Marketline. 2010. “L’Oréal Luxury Brand Case Study. Serving the
post-recessionary affluent market.” 1-22.
Ø Marketline. 2012. “Natural, Organic, and Ethical Cosmetics. L’Oréal’s acquisition of The Body Shop.” 1-19.
Ø www.loreal.com/default.aspx [Accessed on March 2014].
Ø The Body Shop International PLC. 2011. “VALUES REPORT 2011”. www.thebodyshop.com.
Ø The Body Shop International PLC. 2004. “Annual Report of The Body Shop International Plc, in 2004”
Ø Hazelkorn, Todd, Zenner, Marc, Shivdasani, Anil. 2004. “Creating Value with Mergers and Acquisitions”. Journal of Applied Corporate Finance, Volume 16.2-3, 81-90.
Ø www.loreal-‐finance.com/eng/news-‐release/9-‐june-‐2006-‐425.htm [Accessed on April 2014].
Ø Pitman, Simon. 2006. “Body Shop gives nod to L’Oréal takeover”. http://www.cosmeticsdesign.com [Accessed on May 2014].
Ø “L'Oreal's Animal Testing Policy”. oxfordjasmine.blogspot.it [Accessed on May 2014].
Ø L’Oréal Annual Results 2013. www.loreal-finance.com/eng/news-release/annual-results-2013-944.htm [Accessed on May 2014].
Ø www.ethicalconsumer.org/commentanalysis/features/ethicalcompanytakeovers.aspx [Accessed on May 2014].
APPENDIX
Figure 2.1: Cosmetic Market returns and trend line 2000-2013.
Table 2.1: Beta industry of the Cosmetic Market (2000-2013).
Data Cosmetic Sector Beta
2000 0.828
2001 0.956
2002 0.763
2003 0.731
2004 0.672
2005 0.663
2006 0.709
2007 0.724
2008 0.774
2009 0.734
2010 1.028
2011 1.101
y = 0,0004x + 0,019 R² = 0,00633
-‐25,00% -‐15,00% -‐5,00% 5,00% 15,00% 25,00% 35,00%
Q2 2 0 0 0 Q4 2 0 0 0 Q2 2 0 0 1 Q4 2 0 0 1 Q2 2 0 0 2 Q4 2 0 0 2 Q2 2 0 0 3 Q4 2 0 0 3 Q2 2 0 0 4 Q4 2 0 0 4 Q2 2 0 0 5 Q4 2 0 0 5 Q2 2 0 0 6 Q4 2 0 0 6 Q2 2 0 0 7 Q4 2 0 0 7 Q2 2 0 0 8 Q4 2 0 0 8 Q2 2 0 0 9 Q4 2 0 0 9 Q2 2 0 1 0 Q4 2 0 1 0 Q2 2 0 1 1 Q4 2 0 1 1 Q2 2 0 1 2 Q4 2 0 1 2 Q2 2 0 1 3 Q4 2 0 1 3
Cosmetic Market
Cosmetic Market Returns MSCI World Index Returns
2012 1.118
2013 1.013
Figure 2.2 and Table 2.2, Correlation between Cosmetic Market and other Indexes.
Correlation values
S&P 500
EuroStoxx 500
Hang Seng Index
Nikkei Index
MSCI world
Figure 2.3, Natural, Organic and Ethical Cosmetic Market returns and trendline 2003-2013.
Figure 3.2, Frequency distribution of short-term Excess Returns.
y = 0,0014x -‐ 0,0192 R² = 0,02822
-‐25,00% -‐20,00% -‐15,00% -‐10,00% -‐5,00% 0,00% 5,00% 10,00% 15,00% 20,00%
Q3 2 0 0 2 Q1 2 0 0 3 Q3 2 0 0 3 Q1 2 0 0 4 Q3 2 0 0 4 Q1 2 0 0 5 Q3 2 0 0 5 Q1 2 0 0 6 Q3 2 0 0 6 Q1 2 0 0 7 Q3 2 0 0 7 Q1 2 0 0 8 Q3 2 0 0 8 Q1 2 0 0 9 Q3 2 0 0 9 Q1 2 0 1 0 Q3 2 0 1 0 Q1 2 0 1 1 Q3 2 0 1 1 Q1 2 0 1 2 Q3 2 0 1 2 Q1 2 0 1 3 Q3 2 0 1 3
Natural, Organic and Ethical Cosmetic
Market
Quarterly Indexed Returns
Tendency Line (Natural, Organic, Ethical Cosmetic mkt)
0,00% 5,00% 10,00% 15,00% 20,00% 25,00% 30,00% 35,00% 40,00%
> 5% [5%;1%[ [1%;0%[ [0;-‐1%] ]-‐1%;-‐5%] < -‐5%
Frequency distribution of short-term
Excess Returns
Table 3.1.1, Comparison between five-day and 21-day windows of Cash-financed vs. Stock-financed transactions.
CASH-FINANCED DEAL STOCK-FINANCED DEAL
CAR SHORT-TERM LONG-TERM SHORT-TERM LONG-TERM
5-day 21-day 1-year 2-years 5-day 21-day 1-year 2-years
Ylang SA -0,03 -0,10 - - - -
Kielh's 0,02 0,18 - - - -
Respons,
Colgate 0,0007 0,03 - - - -
Revlon's
Colorama 0,00 -0,02 - - - -
Nestlé SA - - - - 0,03 0,03 - -
CPGmarket
.com 0,03 0,03 - - - -
BioMedic -0,05 -0,13 - - - -
Nihon
L'Oréal KK 0,04 0,43 - - - -
Nestlé SA - - - - 0,00 0,06 - -
Mininurse 0,02 0,05 - - - -
Yue-Sai 0,00 0,01 -0,16 0,1756 - - - -
Club Creat
Jap -0,02 0,01 0,37 0,41 - - - -
SkinCeutica
ls 0,00 -0,02 0,38 0,52 - - - -
DELIAL 0,01 0,00 0,06 -0,15 - - - -
Gesparal SA - - - - -0,01 0,08 0,04 -0,24
The Body
Shop 0,02 0,05 -0,09 -0,66 - - - -
Beauty
Allian Int 0,03 0,02 -0,16 -0,64 - - - -
Lab
Sanoflore -0,01 -0,05 -0,23 -0,64 - - - -
Turkey's
Canana 0,05 -0,02 -0,31 -0,30 - - - -
Club Créat
Bea -0,04 -0,10 -0,16 0,26 - - - -
YSL Beauté -0,06 -0,14 0,06 0,42 - - - -
Cadum SA -0,72 0,46 0,18 0,40 - - - -
Moh Nag
Group - - - - -0,35 0,63 0,15 0,02
Urban
Decay Cos 0,00 0,06 0,32 0,31 - - - -
Lab Cosm
Vogue 0,01 0,11 0,19 0,15 - - - -
Interconsum
er pr -0,05 0,04 0,24 0,26 - - - -
Interparf's
Nickel 0,05 0,05 -0,12 - - - - -
Magic Hold -0,03 -0,08 -0,03 - - - - -
Shiseido -0,01 0,03 - - - -
MEAN -0,0296 0,0360 0,0338 0,0368 -0,0825 0,2000 0,0950 -0,1100
Table 3.1.2,Comparison between five-day and 21-day windows of deals made with Public vs. Private companies.
PUBLIC COMPANY PRIVATE COMPANY
CAR SHORT-TERM LONG-TERM SHORT-TERM LONG-TERM
5-day 21-day 1-year 2-years 5-day 21-day 1-year 2-years
Ylang SA - - - - -0,03 -0,10 - -
Kielh's - - - - 0,02 0,18 - -
Respons,
Colgate 0,0007 0,03 - - - -
Revlon's
Colorama 0,00 -0,02 - - - -
Nestlé SA 0,03 0,03 - - - -
CPGmarket
.com - - - - 0,03 0,03 - -
BioMedic - - - - -0,05 -0,13 - -
Nihon
L'Oréal KK 0,04 0,43 - - - -
Nestlé SA 0,00 0,06 - - - -
Mininurse - - - - 0,02 0,05 - -
Yue-Sai 0,00 0,01 -0,16 0,1756 - - - -
Club Creat
Jap - - - - -0,02 0,01 0,37 0,41
SkinCeutica
ls - - - - 0,00 -0,02 0,38 0,52
DELIAL 0,01 0,00 0,06 -0,15 - - - -
Gesparal SA - - - - -0,01 0,08 0,04 -0,24
The Body
Shop 0,02 0,05 -0,09 -0,66 - - - -
Beauty
Allian Int - - - - 0,03 0,02 -0,16 -0,64
Lab
Sanoflore - - - - -0,01 -0,05 -0,23 -0,64
Turkey's
Canana - - - - 0,05 -0,02 -0,31 -0,30
Club Créat
Bea - - - - -0,04 -0,10 -0,16 0,26
YSL Beauté -0,06 -0,14 0,06 0,42 - - - -
Cadum SA - - - - -0,72 0,46 0,18 0,40
Moh Nag
Group - - - - -0,35 0,63 0,15 0,02
Urban
Decay Cos - - - - 0,00 0,06 0,32 0,31
Lab Cosm
Vogue - - - - 0,01 0,11 0,19 0,15
Interconsum
er pr - - - - -0,05 0,04 0,24 0,26
Interparf's
Nickel - - - - 0,05 0,05 -0,12 -
Magic Hold - - - - -0,03 -0,08 -0,03 -
Shiseido -0,01 0,03 - - - -
Table 3.1.3, Comparison between five-day and 21-day windows of deals made with Focused vs. Diversified businesses.
FOCUSE DEAL DIVERSIFIED DEAL
CAR SHORT-TERM LONG-TERM SHORT-TERM LONG-TERM
5-day 21-day 1-year 2-years 5-day 21-day 1-year 2-years
Ylang SA -0,03 -0,10 - - - -
Kielh's 0,02 0,18 - - - -
Respons,
Colgate - - - - 0,0007 0,03 - -
Revlon's
Colorama - - - - 0,00 -0,02 - -
Nestlé SA - - - - 0,03 0,03 - -
CPGmarket
.com - - - - 0,03 0,03 - -
BioMedic - - - - -0,05 -0,13 - -
Nihon
L'Oréal KK 0,04 0,43 - - - -
Nestlé SA - - - - 0,00 0,06 - -
Mininurse 0,02 0,05 - - - -
Yue-Sai 0,00 0,01 -0,16 0,1756 - - - -
Club Creat
Jap -0,02 0,01 0,37 0,41 - - - -
SkinCeutica
ls 0,00 -0,02 0,38 0,52 - - - -
DELIAL - - - - 0,01 0,00 0,06 -0,15
Gesparal SA -0,01 0,08 0,04 -0,24 - - - -
The Body
Shop - - - - 0,02 0,05 -0,09 -0,66
Beauty
Allian Int 0,03 0,02 -0,16 -0,64 - - - -
Lab
Sanoflore - - - - -0,01 -0,05 -0,23 -0,64
Turkey's
Canana 0,05 -0,02 -0,31 -0,30 - - - -
Club Créat
Bea -0,04 -0,10 -0,16 0,26 - - - -
YSL Beauté -0,06 -0,14 0,06 0,42 - - - -
Cadum SA -0,72 0,46 0,18 0,40 - - - -
Moh Nag
Group - - - - -0,35 0,63 0,15 0,02
Urban
Decay Cos 0,00 0,06 0,32 0,31 - - - -
Lab Cosm
Vogue 0,01 0,11 0,19 0,15 - - - -
Interconsum
er pr -0,05 0,04 0,24 0,26 - - - -
Interparf's
Nickel - - - - 0,05 0,05 -0,12 -
Magic Hold -0,03 -0,08 -0,03 - - - - -
Shiseido -0,01 0,03 - - - -
Table 3.1.4,Comparison between five-day and 21-day windows of deals made with Foreign vs. Domestic companies.
FOREIGN COMPANY DOMESTIC COMPANY (French)
CAR SHORT-TERM LONG-TERM SHORT-TERM LONG-TERM
5-day 21-day 1-year 2-years 5-day 21-day 1-year 2-years
Ylang SA -0,03 -0,10 - - - -
Kielh's 0,02 0,18 - - - -
Respons,
Colgate 0,0007 0,03 - - - -
Revlon's
Colorama 0,00 -0,02 - - - -
Nestlé SA 0,03 0,03 - - - -
CPGmarket
.com 0,03 0,03 - - - -
BioMedic -0,05 -0,13 - - - -
Nihon
L'Oréal KK 0,04 0,43 - - - -
Nestlé SA 0,00 0,06 - - - -
Mininurse 0,02 0,05 - - - -
Yue-Sai 0,00 0,01 -0,16 0,1756 - - - -
Club Creat
Jap -0,02 0,01 0,37 0,41 - - - -
SkinCeutica
ls 0,00 -0,02 0,38 0,52 - - - -
DELIAL 0,01 0,00 0,06 -0,15 - - - -
Gesparal SA - - - - -0,01 0,08 0,04 -0,24
The Body
Shop 0,02 0,05 -0,09 -0,66 - - - -
Beauty
Allian Int 0,03 0,02 -0,16 -0,64 - - - -
Lab
Sanoflore - - - - -0,01 -0,05 -0,23 -0,64
Turkey's
Canana 0,05 -0,02 -0,31 -0,30 - - - -
Club Créat
Bea - - - - -0,04 -0,10 -0,16 0,26
YSL Beauté - - - - -0,06 -0,14 0,06 0,42
Cadum SA - - - - -0,72 0,46 0,18 0,40
Moh Nag
Group -0,35 0,63 0,15 0,02 - - - -
Urban
Decay Cos 0,00 0,06 0,32 0,31 - - - -
Lab Cosm
Vogue 0,01 0,11 0,19 0,15 - - - -
Interconsum
er pr -0,05 0,04 0,24 0,26 - - - -
Interparf's
Nickel - - - - 0,05 0,05 -0,12 -
Magic Hold -0,03 -0,08 -0,03 - - - - -
Shiseido - - - - -0,01 0,03 - -