A Work Project, presented as part of the requirements for the Award of a Masters Degree in Finance from the NOVA – School of Business and Economics
Effect of European Sovereign Debt Crisis on Banks’
Stock Market
Performances
Application to Portuguese Data
Artur Jorge Gonçalves Mendes #314
A Project carried out on the Finance course, under supervision of:
Professor Paulo Soares de Pinho
Abstract
This paper studies the impact of the European sovereign debt crisis on Portuguese banks’
share prices. I employ an event study methodology to assess the behavior of banks’ share prices
before, and after a credit rating announcement in relation to both the sovereign and the banks
individually. I find that sovereign credit ratings have a significant impact on banks’ stock market
returns while individual bank credit ratings seem to have little influence. This is probably due to the fact that banks’ credit ratings have been reflecting changes in sovereign ratings rather than any
idiosyncratic factors of banks’ solvency. Among the rating agencies studied the most predominant is
Standard & Poor’s. Furthermore, I find that the behavior of banks’ stock returns exhibit a certain
degree of market inefficiency and anticipation.
1. Introduction
Financial stability risks have increased1 substantially over the past two years due to the burst
of the so-called European sovereign-debt crisis. It all began when doubts about the Greek
government ability to honor their debts maturing in 2010 made credit rating agencies review the
rating notation of several countries pressuring government bonds’ yields to increase drastically.
Ever since some European countries with special focus on those known as peripheral countries –
Ireland, Portugal, Spain, and Italy – were thrown to the spotlight of the protracted crisis, which began
with the late 2000s financial crisis.
In the aftermath of this first stage of the crisis – predominantly financial - and with the
economies slowing as a result of tightened credit and decreasing international trade, governments all
over the world were forced to take on unprecedented fiscal stimulus, expansionary monetary policy and tremendous institutional bailouts for those considered “too big to fail”.
Among the main recipients of those spectacular rescue packages were banks, which were
re-capitalized at a global scale so as to stave off the banking crisis instigated by the international
financial crisis started in 2007. It worked but only to postpone it as most of the money banks
received from governments was without delay to the safest place banks could find in the
pandemonium of the financial crisis – the so-thought haven of government debt.
As a consequence of the spectacular fiscal efforts, bailouts, and subsequent recession public
finances across advanced economies suffered a sharp deterioration, raising concerns regarding the
sovereign risk for those who already had weak debt positions. On top of that, the impossibility of
euro area countries to use monetary policy engenders amplified difficulties for such countries.
Acknowledging the weak fiscal position of some euro area countries credit rating agencies started
reviewing the sovereign credit ratings, especially that of peripheral countries. As a result of the
concerns/downgrades, the financing costs for countries with poor fiscal balances rose immensely
leaving Greece (May 2010), Ireland (November 2010), and Portugal (May 2011) no choice but
default or ask for external help in order to meet their financing needs at a reasonable and viable cost.
In sum, banks are now very much in the same position they were back in 2007/8 only now
the toxic assets are government bonds instead of mortgage-back securities – nobody really knows
how much they are worth. With banks facing such difficulties hovers in the air the possibility of a
credit shrinkage, which would probably trap the forsaken real economy in a downward spiral as
argued in several studies2.
Given that this is an issue of utmost importance it is imperative to study the impacts that a
sovereign debt crisis can have first on banks, and consequently on the general economy. In the scope
of this paper I study solely the impact on banks but the contagion to the main street is certainly a
problem worthy of further research. Also, because government debt crisis are not common in
developed countries, the literature studying the importance of credit rating agencies announcements
on the latter countries is limited, which makes studies on this subject even more significant. This
paper tries to provide a better understanding on how has the sovereign-debt crisis affected banks, in
particular Portuguese banks listed on the main Portuguese stock index – PSI20.
The remainder of this paper is organized as follows: section two presents the methodology
used in this paper as well as the data used and respective sources. Section three starts the empirical
analysis using a rather more descriptive approach. Sections four and five continue the empirical
study using a more analytical and sophisticated approach – event study. The relevant results are
offered in the final of each section. Finally, section six encloses the main conclusions.
2 Notably, Bernanke (1983) in one of his famous studies about the Great Depression argues that the credit squeeze helped
2. Methodology
With this paper I aspire to assess how banks’ performances are affected by credit rating
announcements both at a country and bank level. This is an issue that has been affecting the life of all
European citizens, especially those of the most affected countries such as Portugal and thus I believe
it is important to study its consequences to the financial industry as it then distresses the non-financial
ones. Furthermore, while there are several publications studying the impacts of credit rating
announcements on government bonds’ spreads the literature regarding its impact on banks is limited,
which makes it an important topic to analyze, especially in the world we live today.
Beginning with what I call preliminary analysis, I compare the performance of banks with the
performance of the other industries on the whole. This approach allows for a better understanding on
how banks have performed in the past few years in comparison with the non-financial part of the
economy. In addition I study the correlations between sovereign and banks’ credit default swaps.
Secondly, and in a more technical note I make use of the event study methodology in order to assess
and quantify those impacts. Also, by employing this workhorse of empirical finance I pretend to
assess the existence of market efficiency regarding credit rating types of announcements.
Notwithstanding the helpfulness of the event study tool, it is important to be aware that the use
of such statistical instrument carries with it a few shortcomings, namely due to the fact that apart from the period leading to the first downgrade studied, it’s difficult to find a clean estimation
window. Nonetheless, I try to make the necessary adjustments to mitigate problems that may arise
from the likely hindrances.
The exact detail on how I employed the event study tool is described in its corresponding
2.1 Data & Sources
The data used so as to perform this study was collected on Datastream and Bloomberg. From
the first I obtained all the price series of banks, and other indexes used, as well as time-series of credit
default swaps for both banks and the Portuguese Republic. Then I ought to calculate the return of
banks’ shares in order to carry out the analysis. From Bloomberg I obtained all the information
regarding rating news over the period under analysis –from Jan ’09 to Jan’12. I focus on the
long-term ratings denominated in foreign-currency because these debt issues have extensive rating
information and tend to be more liquid.
In total, considering all rating agencies that issue rating opinions3 on the analyzed institution
(The Big Three 4and Dominion Bond Rating Service) there were 79 announcements (51
downgrades and 28 outlook revisions). Detailed information on the nature of such announcements
can be found in Appendix 1. Additional details on the data used will be provided alongside with the
extensive explanation of the methods used in their respective sections.
3. Preliminary Analysis
To begin the analysis on how sovereign ratings have affected banks I compare the
performance of the banking industry with that of the non-banking industry from a few months
before the beginning of the sovereign-debt crisis up until March 2012. For this purpose I consider
that the crisis started in January 2009 when the sovereign credit rating for Portugal was first
downgraded. Not by chance, the period leading up to the first downgrade was one of tremendous
turmoil. That fact might distort what I am trying to assess – that the sovereign debt crisis,
notwithstanding affecting the economy on the whole affects banks more severely.
3
The credit ratings assigned by the several agencies are opinions on the ability of an entity or of a security issue to meet financial commitments, such as interest or repayment of principal, on a timely basis.
To do this comparison between banks’ and the rest of the economy I used two series of daily
data from Datastream – one that aggregates the entire Portuguese banking system (Portugal – DS
Banks) and other, which encompasses all other industries except banks (Portugal – DS
Non-Financial). Moreover, I compare individually the performance of the four publicly traded Portuguese
banks against the same non-financial index (henceforth NFI).
In order to carry out this approach I compute the ratio5 between each bank share value to the
NFI value and set the value for September, 2008 equal to 100%. Despite the simplicity of this
approach, it is useful to grasp the relative performance of banks relatively to other industries. More
sophisticated approaches will be developed later on.
Results (Graph 1) demonstrate clearly that, Portuguese banks’ share prices have
underperformed greatly the NFI. For instance, the banking industry on the whole presents a ratio of
25% in March 2012. Individually the best performer during the scrutinized period was Banco
Espírito Santo (BES) but its ratio against the NFI went from 100% in the beginning of September
2008 to 33% as of the beginning of March 2012. On the other hand, Banco Comercial Português
(BCP) was the one having the worst performance – as of March 2012 the ratio was of 16,2%. These
figures indeed suggest that the sovereign debt crisis has been having a tremendous impact on the banks’ share prices in relation to the other industries. BPI and Banif exhibit a ratio of 30% and 22%
respectively.
Moreover, one can observe from Graph 1 that following the natural distress caused by the
failure of Lehman Brothers in the end of 2008 banks recover modestly until concerns about the
creditworthiness of sovereigns started increasing (second half of ’09). Lately, since late 2011/early
2012, banks started recovering relatively to the non-financial part of the market, which signals that
investors are easing the pressure on Portuguese banks (government bonds’ yields) as the so-called “programa de ajustamento” seems to be producing good enough results.
Graph 1 ratio of the banks’ shares prices to the NFI. Daily data; 1 September 2008 = 100.
Sources: Datastream, author calculations
Secondly, I study the correlations between the sovereign and banks’ credit default swaps
(CDS) with the purpose of seeing if the perceived creditworthiness of banks moves together with
that of the sovereign. The banks analyzed are BES, BCP, and Caixa Geral de Depósitos. Due to lack
of information BPI and Banif are not examined.
In order to carry out this analysis I use the 5-year senior CDS as they are the most liquid
instrument among all the maturities available and therefore represent more accurately the true relationship between sovereign and banks’ CDSs.
Regarding the analyzed time-span it corresponds to the previous 5 years. The study was made
by exploiting daily data collected from Datastream. So as to have a reliable continuous series I had to
combine the CMA Datavision CDS series with Thomson Reuters CDS series as the first ends in
2010 and the latter begins in 2009.
As one can observe from the Graph 2, banks’ and sovereign’s credit default swaps have been
moving quite closely, which indicates a strong relationship between the creditworthiness of the
sovereign and that of banks. Moreover, it is observable that CDSs started increasing more
dramatically on the end of 2009, when the sovereign debt crisis was first identified. 0%
50% 100% 150%
2008 2009 2010 2011
Graph 2 – 5 year credit default spreads from the Republic of Portugal and Portuguese banks. Source: Datastream
Calculations on the correlations between sovereign and banks’ CDSs and among banks are
presented below in Table 1. The computations show correlations really close to 1. In relation to the
sovereign, CDS correlations range from 0,94 of BES to 0,97 of CGD. Inter banks CDS correlations
range from 0,95 (BPI with BES and CGD) to 0,98 between BES and CGD.
Again, correlation coefficients show evidence of a very strong relationship between the
creditworthiness of the sovereign and that of banks.
Table 1 –Correlation between sovereign and banks’ CDSs
Portugal BES BCP BPI Caixa GD
Portugal 1
BES 0,94 1
BCP 0,95 0,97 1
BPI 0,90 0,95 0,96 1
Caixa GD 0,97 0,98 0,97 0,95 1
Sources: Author calculations based on Datastream.
4. Event Study
4.1 Introduction
In this section an event study on the effect of sovereign-debt crisis on banks’ performances is
carried out. In order to do so I study the impact of announcements by credit rating agencies on the
return of banks’ shares. This study considers all credit rating agencies that issue rating opinions on 0 €
500 € 1.000 € 1.500 € 2.000 € 2.500 €
2008 2009 2010 2011
any of the considered institutions – Standard & Poor’s, Moody’s, Fitch and DBRS. Furthermore I
analyze the impact of both outlook revisions and downgrades separately.
The implementation of the event study has the advantage of using available financial market
data. Furthermore, its usefulness lies on the fact that, given rationality in the market place, the effect
of an event will impact the securities’ prices without delay, which makes the use of event studies an
important tool in capital market research as a way of testing market efficiency.
The event study framework has several applications for various fields but especially in the
world of finance. The most notable are related to announcements of: mergers and acquisitions,
earnings, issues of new debt or equity or the release of macroeconomic related figures, accounting
rule changes, or changes in the severity of regulation.
In this paper I conduct an event study in which the event studied is rather than a corporate
level announcement, a supra company announcement where all companies are affected at the same
type –announcements by credit rating agencies. Studying an event that impacts all companies
simultaneously carries with it some statistical problems that will be addressed later on. Hereafter
follows a brief literature review on event studies.
4.1.1 Literature Review
“There was little evidence on the central issues of corporate finance. Now we are
overwhelmed with results, mostly from event studies” (Fama, 1991, p.1600)
The sentence above illustrates well the importance that event study has had in understanding
the corporate world. Moreover, and even though, event studies have been introduced several
decades ago, Harrington and Shrider (2007) point out that “over 35 years following its introduction
Although it is still a prevalent instrument, the concept of such an important tool in finance is
quite old and can be traced back to the early 1930s but it was not until the late 1960s that the event
study methodology would see its biggest breakthrough .Firstly, Ray Ball and Philip Brown (1968)
considered the information content of earnings. Secondly, and most importantly Fama, Fisher,
Jensen, and Roll (1969) study the effect of stock splits after removing the effects of simultaneous
dividend increases.
The academic developments from 1969 onwards are very much related with the
methodology used by Fama et al. (1969) mainly because the subsequent research basically tried to
overcome some shortcoming of this early study. The list of issues comprises the following statistical
shortcomings: often abnormal returns estimators 1) are cross-sectionally correlated, 2) have different
variances across firms, 3) are not independent across time for a given firm or 4) have greater
variance during the event period than in surrounding periods.
Notwithstanding the large list of statistical drawbacks, contributions from several authors
namely Jaffe and Mandelker (1974), Patell (1976), Beaver (1968); Mikkleson and Partch (1988),
Mais et al. (1989), Cowan (1991), Karafiath and Spencer (1991), Sweeney (1991), and Salinger
(1992) have helped circumventing the problems.
4.2 “Traditional” Event Study Methodology
After having briefly reviewed the academic developments of the last few decades and the
several hypotheses one has when performing an event study, I now present the methodology used in
this study. While the approach followed is closely related to what Fama et al. (1969) suggested, it
has some modifications with the purpose of correcting statistical problems arising from the fact that
the event of interest is the same for all analyzed securities. I focus primarily in A. Craig MacKinley
4.2.1 General Steps
Even if there is no strict methodology to conduct an event study, there is a widely accepted
flow of analysis. After defining the events of interest, which on the ambit of this paper are the
announcements by credit rating agencies, one has to decide upon the period over which security
prices of relevant firms will be examined – this period is known as the event window.
For the sake of this paper and as stated previously the relevant firms are the Portuguese banks,
explicitly those listed on the PSI 20. Moreover, the analysis uses a 5-day event window.
The event window is larger than the event of interest so as to permit the examination of
periods surrounding the event. For instance, by considering an event window greater than solely the
day in which the announcement is made, it is possible to study for market efficiency and
anticipation, as it will be discussed below.
4.2.2 The Concept of Abnormal Return and Normal Return Models
The appraisal of the event’s impact entails a measure of the abnormal return. Just like in Fama
et al. (1969) the abnormal return is defined as the actual ex post difference between the realized return of the firm and the “normal return” during the event window.
The normal return is defined as the expected return without conditioning on the event taking
place. The abnormal return for firm i and event date t is specified as follows:
, (1)
where , , and are the abnormal, realized, and normal returns respectively while
is the conditioning information for the normal return model.
A variety of normal return models have been proposed. The importance of such model lies on
the fact that with greater r-squared the greater is the variance reduction and therefore the prediction
r-squared while being at the same time parsimonious. The most purposeful models suggested in
previous literature are: 1) mean-adjusted returns, (2) market model, (3) deviation from the Capital
Asset Pricing Model (CAPM), or (4) deviations from the Arbitrage Pricing Theory (APT).
In this paper I use the so-called market model due to its simplicity, parsimoniously and the
fact that gains arriving from employing multifactor models for event studies are limited (MacKinlay,
1997). Moreover, the implementation of statistical models such as the market model require the
assumption that asset returns are independent and identically distributed through time, which while
being strong assumptions, are empirically reasonable and inference using normal return models tend
to be robust to deviations from assumptions.
4.2.3 Market Model
The market model is a statistical model in which the return of any given security is linked to
that of a broad market portfolio. As refereed above, the statistical specification of the model is build
upon the assumption of joint normality of assets returns and is as follows:
(2)
and , (3) & (4)
where and represent the period-t return of bank i and of the market respectively, and is
the zero mean disturbance error term. , are the parameters of the model.
4.2.4 Estimation
Regarding the length of the estimation window, it is usually set to encompass the 120 daily
observations prior to the event window. The event window is not included in the estimation window
to avert the event from influencing the normal performance model parameter estimates.
I use robust methods to estimate the parameters so as to accommodate for the possibility of
4.2.5 Distribution of Abnormal Returns
Given the model parameters one has then to measure and analyze the abnormal returns. The
sample of daily abnormal returns is generated as follows:
, (5)
where represent the abnormal returns estimated by using the market model. Under the null
hypothesis, conditional on the event window market returns, the abnormal returns will be jointly
normally distributed with a zero conditional mean and conditional variance as presented
below:
, (6)
where is the average return of the market during the estimation period, and the variance of
returns during the same period. The second component is due to sampling error and leads to serial
correlation of abnormal returns. This problem is solved easily as in practice the length of the
estimation window can be chosen to be large enough so that the second component of the right-hand
side of (6) goes to zero. In fact, by using an estimation window as explained above its secure to
ignore it - the variance of the abnormal returns will be solely . After having estimated the
abnormal returns and in order to assess the significance of the event it is paramount to make use of
the distribution of abnormal returns, which under the null hypothesis - that the event has no impact
on the behavior of returns - is:
. (7)
4.2.6 Aggregation of Abnormal Returns
Furthermore and in order to accommodate for multiple period event window one has to
same used by Fama et al. (1969) - the cumulative abnormal return (CAR). For an event window
going from to the sample cumulative abnormal return is the sum of included abnormal returns:
. (8)
Moreover, and as in the variance of abnormal return in (6), asymptotically (with large enough
estimation window) the variance of is defined as:
. (9)
The distribution of the cumulative abnormal return under the null hypothesis is then:
. (10)
4.2.7 Estimation of the Variance and t-test
In practice, because is unknown, one must estimate the variance of the abnormal returns.
The sample variance measure of from the estimation window is a suitable choice. Given the
distribution of (cumulative) abnormal returns under the null hypothesis, tests on the veracity of the
latter can be conducted using the following t-ratio:
. (11)
The test above allows for studying the effect of the event of interest at an individual basis. In
order to study the impact at an aggregate level (i.e. banking industry on the whole) banks’ abnormal
returns must be aggregated cross-sectionally; however, this is not possible as the assumption that the
abnormal returns are independent across securities does not hold, due to the overlap of event
windows. With the overlap the implicit assumption that covariances among securities are zero does
4.2.8 Inferences with Clustering
There are two ways of handling the overlapping of the event window. One is to use a
portfolio approach, case in which the security level analysis can be applied directly to the portfolio.
The other is to analyze the impact at a security level. This second approach is most commonly used
when there is total clustering and in spite of having little power and poor finite sample properties
relatively to the first, has the advantage of accommodating for situations where some firms exhibit
positive abnormal returns and some other negative abnormal returns.
In the scope of this work I perform both analyses. For that I use the same banking industry
portfolio as in the preliminary analysis (Portugal – DS Banks).
4.2.9 Results
Applying the methodology explained above I study the significance of all announcements
made by the pertinent rating agencies. Firstly, I estimate the 5-day CARs starting on the day of the
announcement (8). Secondly, I ought to estimate the variance of the CARs, which is done using (9)
after estimating the variance of the abnormal returns. Finally, with the 5-day CAR and respective
standard deviation I apply the t-test (11). The appraisal of the t-test is standard.
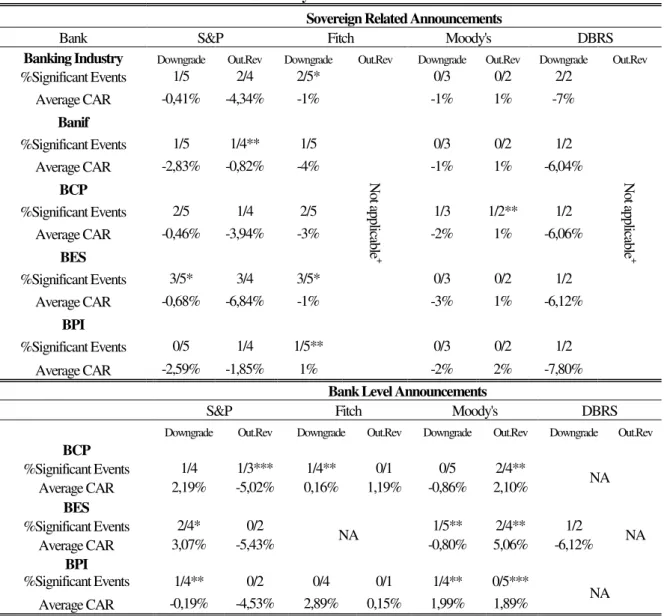
Table 1 below presents a brief summary of the results obtained by employing this so-called “traditional” event study methodology. The events are treated individually, and divided into two
groups - downgrades and outlook revisions – so as to grasp the impact of each set of events6. The
upper part of the table sums up the impacts of sovereign related announcements whereas the inferior
summarizes the effect of bank related announcements. I present the average CAR across all events
as well as the percentage of significant events of each set of announcements (e.g. 1/5 means that 1
out of 5 was significant). For a more comprehensive understanding please refer to Appendix 2
where the results are presented in an extensive manner, event by event.
Table 2 - Summary of Announcements' Effects
Sovereign Related Announcements
Bank S&P Fitch Moody's DBRS
Banking Industry Downgrade Out.Rev Downgrade Out.Rev Downgrade Out.Rev Downgrade Out.Rev
%Significant Events 1/5 2/4 2/5*
N ot ap pli ca ble +
0/3 0/2 2/2
N ot ap pli ca ble +
Average CAR -0,41% -4,34% -1% -1% 1% -7%
Banif
%Significant Events 1/5 1/4** 1/5 0/3 0/2 1/2
Average CAR -2,83% -0,82% -4% -1% 1% -6,04%
BCP
%Significant Events 2/5 1/4 2/5 1/3 1/2** 1/2
Average CAR -0,46% -3,94% -3% -2% 1% -6,06%
BES
%Significant Events 3/5* 3/4 3/5* 0/3 0/2 1/2
Average CAR -0,68% -6,84% -1% -3% 1% -6,12%
BPI
%Significant Events 0/5 1/4 1/5** 0/3 0/2 1/2
Average CAR -2,59% -1,85% 1% -2% 2% -7,80%
Bank Level Announcements
S&P Fitch Moody's DBRS
Downgrade Out.Rev Downgrade Out.Rev Downgrade Out.Rev Downgrade Out.Rev BCP
%Significant Events 1/4 1/3*** 1/4** 0/1 0/5 2/4**
NA Average CAR 2,19% -5,02% 0,16% 1,19% -0,86% 2,10%
BES
%Significant Events 2/4* 0/2
NA 1/5** 2/4** 1/2 NA
Average CAR 3,07% -5,43% -0,80% 5,06% -6,12%
BPI
%Significant Events 1/4** 0/2 0/4 0/1 1/4** 0/5***
NA Average CAR -0,19% -4,53% 2,89% 0,15% 1,99% 1,89%
The threshold for an event to be considered significant is a p-value<10%; *This percentage include cases where the CAR are significantly positive; **Significant events arising from this set of events are only positive;*** one of this outlook revision is a positive one; 1/5 (#significant Events)/ (#Total Events).
Source: Author Calculations
From the results presented in table 1 it is observable that sovereign related announcements
engendered, in general, negative CARs. Particularly, announcements from S&P and DBRS caused
negative average CARs across all the analyzed securities.
Also, Fitch’s announcements produced negative average CARs to all securities with the
exception of BPI. In relation to Moody’s, the results point out a clear division between downgrades
and outlook revisions with the first producing negative average CARs across the board whereas the
Breaking the analysis into downgrades and outlook revisions from S&P one observes that
with exception of Banif and BPI, outlook revisions have had more impact than downgrades
themselves. In fact, sovereign outlook revisions by S&P are the set of events producing the most
significant average CARs.
For instance, the Portuguese banking industry on the whole underperformed the broad
market, on average, by 4,34% in the 5-days following a sovereign outlook revision against the
0,41% correspondent to the parallel underperformance after a downgrade. Individually, the most
affected banks by sovereign outlook revision are BES and BCP, which exhibit an average CAR of
-6,84% and -3,94% respectively, which again implies a huge difference from the CARs produced by
downgrades (-0,68% and -0,46%).
On the other hand, for Banif and BPI, downgrades caused more impact than outlook
revisions; however, the difference between the verified average CARs is not as significant as for the
cases of BES and BCP.
Nevertheless the diverse effects experienced by each bank, the above observations seem to
entail that outlook revision by S&P are taken by the market as truly new information and that
somehow, markets participants anticipate the downgrade with the outlook revision. In fact, by looking at Appendix 1 (chronology of downgrades/outlook revisions since January ’09) it is
observable that S&P is sort of the leading rating agency in the sense it anticipates the other agencies
(announcements by other rating agencies come consistently after the analogous one from S&P).
As a result of the previous and the fact that rating opinions are almost perfectly substitutes it is
normal that announcements made by S&P create more significant CARs in relation to other rating
agencies. This is also supported by the portion of significant events engendered by the various rating
coming from the newly appointed7 DBRS are significant across the board and produced
considerable negative average CAR, ranging from -6,04% for Banif to -7,80% to BPI. However, as
the sample of DBRS announcement is really limited (four downgrades/two dates), it is difficult and
imprudent to draw meaningful conclusions.
Furthermore, taking into consideration individual announcements it is again detected that
outlook revisions from S&P caused considerable negative average CARs. However, and because
usually rating agencies review their rating opinions for all the institutions around the same date
(Portugal included) it is difficult if not impossible to assess the relative contribution of
individual/sovereign outlook revision to the negative CARs observed. Regarding individual rating announcements from Fitch and Moody’s there is no evidence of them generating systematic
negative CARs. In relation to the significance of individual announcements I find it to be very low
and more surprisingly, to cause at times positive and significant CARs. This last observation may be
due to the market having worst expectations regarding the awaited announcements in comparison to
what actually happened. (e.g. agency issues an outlook revision when a downgrade was expected)
From these results there is evidence that markets value more sovereign than individual
ratings, meaning that market participants seem to acknowledge, at the time of a sovereign related
announcement, that sooner or later banks will receive the same treatment. This finding may be associated with the fact that banks’ credit rating reviews have been reflecting changes in sovereign
ratings rather than any idiosyncratic factors regarding banks’ solvency.
Moreover, I find evidence that S&P is the predominant agency in the sense its
announcements generate in general, more significant and negative CARs. Particularly, outlook
revisions from S&P, probably as a result of being fresh information coming to the markets, generate
the most remarkable negative average CARs.
Furthermore, it seems that, analogously to the relation between sovereign and individual
ratings, market participants expect other rating agencies to announce something similar to that S&P
has already announced. This seems to render announcements from rating agencies other than S&P
rather “useless”.
4.3 Regression Based Event Study
Additionally to the traditional event study methodology I also use regression based event
study methodology to evaluate the impact of credit rating agencies’ announcements on the return of banks’ shares. In order to do so, I employ once again the market model to eliminate the effects of
wide economic factors leaving the portion of return that is due to firm/country specific information.
Then, by using a set of dummy variables that assume a value of 1 on the day of the downgrade it is
possible to evaluate the impact of such an event in banks’ performances as measured by their share
prices movements. To complete the analysis I also include four lags of the dummy variable. The use
of the five dummy variables is in a sense, the equivalent to have a 5-day event window and permits
to study for market efficiency. This approach considers the significance of abnormal returns day-by-day, conversely to the “traditional” event study that solely studies the significance of the cumulative
returns over the length of the event window. The regression estimated by using this approach is as
follows:
, (12)
where are dummy variables assuming value one on and zero otherwise (e.g.
assumes value on the day of the announcement, on the day after the announcement etc.) and
are the correspondent coefficients. All the remaining variables and parameters remain unaltered
precisely to the abnormal returns verified in that day. The regression is estimated by using the entire
sample, from February ‘07 to January ’12.
4.3.1 Testing for anticipation
The analysis carried out so far aims at analyzing the reaction of banks’ share prices after a
credit rating announcement is made.
Analogously, it is unquestionably interesting to assess if the information contained in the
announcements is somehow observed by the market even before the announcements are made. To
test for this hypothesis I use the very same framework as above only with a simple adaptation - the
inclusion of dummy variables that assume value one in the days preceding the announcement.
For this purpose I use five new dummy variables, one for each of the five days preceding the
event. These five days are a very small period of time to make such analysis as if the fundamentals
of a country/bank were to induce a downgrade, they would most likely be noticeable more than five
days before the actual announcement. However, due to the high frequency of downgrades during the
period analyzed, using a larger window so as to study for a possible anticipation phenomenon will
most likely violate the independence required for conducting such a study.
4.3.2 Results
Due to the length of the outputs generated by this regression based event study it is impossible
to present the results here. However, in Table 2 below I try to sum up the results obtained. For a
more comprehensive understanding please refer to Appendix 3 where the regressions’ outputs are
presented in an extensive manner.
The summary is made at three levels: significance (immediate impact), market inefficiency,
and anticipation. The judgment of the three considered levels is made qualitatively through a very
Portuguese banking industry on the whole (All), country level outlook revisions from S&P caused significant impact (“yes”); the adjustment of stock prices after the announcement exhibited signs of
market inefficiency (“yes”); and finally, there were no signs of anticipation to the announcement
(“no”). Again, I divide the analysis of into two groups – outlook revisions and downgrades.
Table 3 - Regression Based Event Study - Outlook Revisions
Country Level
S&P Moody's
All BES BCP BPI Banif All BES BCP BPI Banif
Significance Yes Yes Yes No No No No No No No
Market Inefficiency Yes Yes Yes No Yes No No No No No
Anticipation No Yes No No No Yes Yes Yes Yes Yes
Bank Level Significance
NA
Yes No No
NA NA
No No Yes
NA
Market Inefficiency No No No No No No
Anticipation No Yes No No Yes No
Downgrades
Country Level
S&P Moody's
All BES BCP BPI Banif All BES BCP BPI Banif
Significance No Yes No No No Yes Yes Yes Yes Yes
Market Inefficiency Yes Yes No No Yes Yes Yes Yes Yes Yes
Anticipation Yes Yes Yes Yes Yes Yes No No No Yes
Fitch DBRS
Significance No No No No No Yes Yes Yes Yes Yes
Market Inefficiency No No No No Yes No No No Yes No
Anticipation No No No No Yes No Yes No No No
Bank Level
BES BCP BPI
S&P Moody's DBRS S&P Moody's Fitch S&P Moody's Fitch
Significance No No Yes Yes No No Yes No No
Market Inefficiency No Yes No No No No No No No
Anticipation No No Yes Yes Yes No Yes No Yes
Note: The classification of the event as significant is due based on the existence of significant negative abnormal returns (significant coefficient of the parameter associated with the dummy variable) on the day of the announcement and day after; the classification of market efficiency is due based on the existence of negative abnormal returns on the days after the announcement is made; the classification of anticipation is due based on the existence of negative abnormal returns on the days preceding the announcement
Source: Author’s calculations.
I now comment briefly the results obtained, starting by the upper part of Table 2 – outlook
Poor’s, there is evidence that it indeed produce significant negative abnormal returns to the banking
industry in general, and to BES and BCP in particular.
As for market inefficiency I find significant abnormal returns on the days after the
announcement for all the securities studied except of BPI, which indicate that the market is not
efficient as it does not adjust entirely on the day in which the announcement is made.
Regarding the anticipation, I find no significant negative coefficient in the days preceding the
announcement apart from BES. Concerning country outlook revision made by the rating agency Moody’s I find that they are not significant as there is no evidence of significant abnormal returns on
the days announcements were made. Also, in the days after the announcement no abnormal returns
are significant. However, interestingly, there is evidence of anticipation in all securities. Such
anticipation may thus explain the inexistence of abnormal returns in the day the announcement is
made as the stock prices were already corrected downwards.
Moreover, taking into account outlook revisions at bank level, I find its immediate effects to
be practically zero with the exception of BES and BPI, when the announcement comes from Standard & Poor’s and Moody’s respectively. There is no indication of market inefficiency and
suggestions of anticipation are weak.
In sum, I find once again evidence that markets value more sovereign than individual ratings.
An observation that strengthens the hypothesis mentioned before that banks’ credit rating reviews
have been reflecting changes in sovereign ratings rather than any idiosyncratic factors regarding banks’ solvency.
In relation to lower part of Table 2 concerning downgrades the main findings are the
following. Firstly, it is observable that downgrades by Standard & Poor’s are not significant across
the board, the only exception being BES. Instead, they seem to be highly anticipated which might be
and DBRS have affected banks’ share prices broadly. For both rating agencies I find the degree of
anticipation to be low.
Concerning market efficiency I find that the market adjusted slowly after announcements
coming from Moody’s whereas DBRS’s announcements do not seem to cause a slow adjustment of
stock prices the only exception being BPI. Finally, the rating agency Fitch has no impact whatsoever
with exception of Banif. Regarding bank level downgrade I find that the only significant for BES are
the announcements by DBRS, which means little as the newly appointed rating agency reviewed
their credit rating for Portugal and BES simultaneously. Standard & Poor’s affects both BCP and
BPI and also for both, there is a certain degree of anticipation. Once again, Fitch has no significance
for both banks to which it issues rating opinions (BCP and BPI).
5. Conclusion
This paper assesses to what extend the European debt crisis have affected Portuguese banks.
Firstly, I have made a comparative analysis between the performance of the banking industry and
the performance of the broad index excluding the banking sector. Secondly, I have carried an event
study analysis for the banks listed on the PSI20. The so-called events are supra company
announcements issued by credit rating agencies, both of rating changes and outlook revisions from
2009 onwards. I analyzed the impact of announcements made by the relevant rating agencies –
Standard & Poor’s, Moody’s, Fitch and DBRS.
From the first study I find that indeed, the banking industry has been severely impacted by
this European sovereign debt crisis. The underperformance of the banking industry in relation to the
remaining parts of the economy is overwhelming. Moreover, calculations on the correlations between sovereign and banks’ CDSs reveal themselves to be really close to 1 indicating a strong
Regarding the key results obtained with the event study they are essentially four-folded.
Firstly, I find evidence that sovereign ratings are more important to banks’ stock market
performances than the actual bank level ratings. This finding may be associated with the fact that during this period, changes in banks’ credit ratings have been reflecting changes in sovereign
creditworthiness rather than any idiosyncratic factors of bank’s solvency. Secondly, there is evidence
that S&P is the predominant agency, seemingly because it generally anticipates its counter-parties in
announcing analogous credit opinions. Thirdly, I find evidence that the market is not efficient in
respect to this type of announcements. Finally, there are indications of anticipation to several
announcements.
This study studies solely the particular impact that the European sovereign debt crisis has had
in Portuguese banks. However, further research on the impact of a sovereign debt crisis to advanced
economies in general is worthy of being carried out. Namely its impacts to the real economy not
only in the short run but also in the long run. Moreover, I believe it would be interesting to carry out future research on the dynamics of banks’ stock market returns after the results of sovereign debt
auctions are made public.
6. References
Fama, Eugene F., Lawrence Fisher, Michael Jensen, and Richard Roll. 1969. “The Adjustment of Stock Prices to New Information”. International Economic Review, Volume 10: 1-21.
Binder, John. 1998. “The Event Study Methodology Since 1969.” Kluwer Academic Publishers.
Ahern, Kenneth. 2009. “Sample Selection and Event Study Estimation.” Journal of Empirical
Finance, Volume 16: 466-482.
MacKinlay, A. Craig. 1997. “Event Studies in Economics and Finance.” Journal of Economic
Literature, Volume XXXV: 13-39.
Borensztein, Eduardo et al. 2007. ”Sovereign Ceilings “Lite”? The impact of Sovereign Ratings on
Corporate Ratings in Emerging Market Economies.” IMF Working Paper.
Blundell-Wignall, Adrian and Patrick Slovik. 2011. “A Market Perspective on the European Sovereign Debt and Banking Crisis.” Financial Market Trends, Volume 2010 – Issue 2. Davies, Michael. 2011. “The Rise of Sovereign Credit Risk: Implications for Financial
Stability.”Bank for International Settlements Quarterly Review, part 5, September 2011.
IMF, September 2011. “Global Financial Stability Report –Grappling with Crisis Legacies.” World
Economic and Financial Services, IMF publication services.
Bernanke, Ben. 1984. “Nonmonetary Effects of the Financial Crisis in the Propagation of the Great
Depression.” The American Economic Review, Volume 73: 257-276.
Afonso, António., Davide Furceri, and Pedro Gome. 2011. “Sovereign Credit Ratings and Financial Market Linkages –Application to European Data.” ECB Working Paper Series, No 1347. Banco de Portugal. 2011. “Relatório de Estabilidade Financeira.” Departamento de Estudos
Económicos.
Hofmann, Thomas., Dr. Rolf Schneider. 2010. “Eurozone Debt Crisis: Impact on the Economy.”
Economic Research & Corporate Development, Working Paper 141.
Panetta, Fabio., Ricardo Correa, Michael Davies, Antonio Di Cesare, José Marques,Francisco Nadal de Simone, Federico Signoretti, Cristina Vespro, Siret Vildo, Martin Wieland, and Andrea Zaghini. 2011. “The Impact of Sovereign Credit Risk on Bank Funding Conditions.”
Committee on the Global Financial System Papers, No 43
Pollock, A. 2012. “Yet Another Sovereign Debt Crisis.” American Enterprise Institute. March 16.
Thomas Jr., L. 2011. “Pain Builds in Europe’s Sovereign Debt Risk.” The New York Times. July 17. Samuelson, Robert. 2011. “Europe’s Banking Crisis.” Real Clear Politics. September 16.
Silva, M. 2012. “ Financiamento à economia bate mínimos históricos”. Diário Económico. April 10.
Lehmann, Alexander. 2012. “ANew ‘Credit Crunch’ in Emerging Europe?” European Bank for
Appendixes
Appendix 1 - Ratings Announcements
Institution Date Announcement Rating Agency
1 Portugal 13-01-2009 Outlook revision Standard & Poor's
2 Portugal 21-01-2009 Downgrade to A+ Standard & Poor's
3 BES 06-04-2009 Outlook revision Moody's
4 BCP 06-04-2009 Outlook revision Moody's
5 BPI 06-04-2009 Outlook revision Moody's
6 BCP 30-07-2009 Downgrade to A- Standard & Poor's
7 BES 16-09-2009 Downgrade to A1 Moody's
8 BCP 16-09-2009 Downgrade to A1 Moody's
9 BPI 16-09-2009 Outlook revision* Moody's
10 Portugal 07-12-2009 Outlook revision Standard & Poor's
11 Portugal 24-03-2010 Downgrade to AA- Fitch
12 BES 27-04-2010 Downgrade to A- Standard & Poor's
13 BCP 27-04-2010 Downgrade to BBB+ Standard & Poor's
14 BPI 27-04-2010 Downgrade to A- Standard & Poor's
15 Portugal 27-04-2010 Downgrade to A- Standard & Poor's
16 BES 05-05-2010 Outlook revision Moody's
17 BCP 05-05-2010 Outlook revision Moody's
18 BPI 05-05-2010 Outlook revision Moody's
19 Portugal 05-05-2010 Outlook revision Moody's
20 BES 14-07-2010 Downgrade to A2 Moody's
21 BCP 14-07-2010 Downgrade to A3 Moody's
22 BPI 14-07-2010 Downgrade to A2 Moody's
23 Portugal 14-07-2010 Downgrade to A1 Moody's
24 BCP 21-07-2010 Downgrade to A Fitch
25 BPI 21-07-2010 Downgrade to A Fitch
26 BCP 08-11-2010 Downgrade to BBB+ Fitch
27 BPI 08-11-2010 Downgrade to A- Fitch
28 Portugal 30-11-2010 Outlook revision Standard & Poor's
29 BES 03-12-2010 Outlook revision Standard & Poor's
30 BCP 03-12-2010 Outlook revision Standard & Poor's
31 BPI 03-12-2010 Outlook revision Standard & Poor's
32 BES 09-12-2010 Outlook revision Moody's
33 BCP 09-12-2010 Outlook revision Moody's
34 BPI 09-12-2010 Outlook revision Moody's
35 Portugal 21-12-2010 Outlook revision Moody's
36 Portugal 23-12-2010 Downgrade to A+ Fitch
37 BES 15-02-2011 Outlook revision Moody's
38 BCP 15-02-2011 Outlook revision Moody's
39 BPI 15-02-2011 Outlook revision Moody's
40 Portugal 15-03-2011 Downgrade to Baa1 & Outlook revision Moody's 41 Portugal 24-03-2011 Downgrade to BBB & Outlook revision Standard & Poor's 42 Portugal 24-03-2011 Downgrade to A- & Outlook revision Fitch 43 BES 28-03-2011 Downgrade to BBB & Outlook revision Standard & Poor's 44 BCP 28-03-2011 Downgrade to BBB- & Outlook revision Standard & Poor's 45 BPI 28-03-2011 Downgrade to BBB & Outlook revision Standard & Poor's 46 Portugal 29-03-2011 Downgrade to BBB- & Outlook revision Standard & Poor's
48 BPI 30-03-2011 Outlook revision Fitch
49 BES 31-03-2011 Downgrade to BBB- Standard & Poor's
50 BPI 31-03-2011 Downgrade to BBB- Standard & Poor's
51 Portugal 01-04-2011 Downgrade to BBB- & Outlook revision Fitch
52 BCP 05-04-2011 Downgrade to BBB- & Outlook revision Fitch
53 BPI 05-04-2011 Downgrade to BBB- & Outlook revision Fitch
54 BES 06-04-2011 Downgrade to Baa2 & Outlook revision Moody's 55 BCP 06-04-2011 Downgrade to Baa3 & Outlook revision Moody's 56 BPI 06-04-2011 Downgrade to Baa2 & Outlook revision Moody's
57 BES 25-05-2011 Downgrade to BBBH DBRS
58 Portugal 25-05-2011 Downgrade to BBBH DBRS
59 BCP 14-06-2011 Outlook revision* Standard & Poor's
60 Portugal 05-07-2011 Downgrade to Ba2 Moody's
61 BES 15-07-2011 Downgrade to Ba1 & Outlook revision Moody's
62 BCP 15-07-2011 Downgrade to Ba1 & Outlook revision Moody's
63 BPI 15-07-2011 Downgrade to Baa3 & Outlook revision Moody's
64 BES 07-10-2011 Downgrade to Ba2 Moody's
65 BCP 07-10-2011 Downgrade to Ba3 Moody's
66 BPI 07-10-2011 Downgrade to Ba2 Moody's
67 BES 20-10-2011 Downgrade to BBB DBRS
68 Portugal 20-10-2011 Downgrade to BBB DBRS
69 Portugal 24-11-2011 Downgrade to BB+ Fitch
70 BCP 25-11-2011 Downgrade to BB+ Fitch
71 BPI 25-11-2011 Downgrade to BB+ Fitch
72 Portugal 05-12-2011 Outlook revision Standard & Poor's
73 BES 07-12-2011 Outlook revision Standard & Poor's
74 BCP 07-12-2011 Outlook revision Standard & Poor's
75 BPI 07-12-2011 Outlook revision Standard & Poor's
76 BES 16-12-2011 Downgrade to BB Standard & Poor's
77 BCP 16-12-2011 Downgrade to BB & Outlook revision Standard & Poor's 78 BPI 16-12-2011 Downgrade to BB+ & Outlook revision Standard & Poor's
79 Portugal 13-01-2012 Downgrade to BB Standard & Poor's
Appendix 2 (part1) - Sovereign Downgrade
Agency: Standard & Poor's
Bank
Event Banking Industry Banif BCP BES BPI
13-01-2009 Outlook Revision
t-test -2,63*** -0,48 2,05*** 2,05*** -0,89
CAR -8,00% -2,10% -8,37% -9,79% 5,26%
21-01-2009 Downgrade to A+
t-test -0,07 0,70 0,93 -1,01 -1,21
CAR -0,23% 2,99% 3,89% -4,82%
-7,17%
07-12-2009 Outlook Revision
t-test -0,32 0,53 -1,34 0,29 -1,04
CAR -0,57% 2,21% -4,38% 0,71% 2,85%
27-04-2010 Downgrade to A-
t-test 0,37 4,10*** -0,62 2,53*** -1,60
CAR 0,50% -11,40% -1,47% 5,39% 3,58%
30-11-2010 Outlook Revision
t-test -2,48*** -0,47 -1,44 2,37*** -1,72*
CAR -4,66% -2,55% -3,48% -5,87% 3,61%
24-03-2011 Downgrade to BBB & Outlook Revision
t-test -2,52*** -0,80 2,43*** -1,74* -1,36
CAR -5,19% -3,57% -6,25% -5,12% 3,16%
29-03-2011 Downgrade to BBB- & Outlook Revision
t-test -1,30 -0,39 -1,79* -1,76* -0,92
CAR -2,75% -1,67% -4,66% -5,22% 2,14%
05-12-2011 Outlook Revision
t-test -0,80 5,27*** 0,07 2,04*** 0,69
CAR -4,14% 32,76% 0,48% -12,39% 4,31%
13-01-2012 Downgrade to BB
t-test 0,92 -0,07 0,77 0,86 0,47
CAR 5,64% -0,49% 6,17% 6,38% 3,09%
*** p<0.01, ** p<0.05, * p<0.1
Source: Author Calculations
Appendix 2 (part2) - Sovereign Downgrade
Agency: DBRS
Event Banking Industry Banif BCP BES BPI
25-05-2011 Downgrade to BBBH
t-test -1,72* 0,45 3,92*** 0,17 -0,48
CAR -3,90% 1,64% 10,88% 0,52% -1,40%
20-10-2011 Downgrade to BBB
t-test -2,59*** 2,53*** -0,26 2,90*** 3,16***
CAR -9,38% 13,71% -1,24% 12,77% 14,21%
*** p<0.01, ** p<0.05, * p<0.1
Appendix 2 (part3) - Sovereign Downgrade
Agency: Moody's
Bank
Event Banking Industry Banif BCP BES BPI
05-05-2010 Outlook Revision
t-test 1,32 1,10 1,89* -0,34 1,32
CAR 1,95% 3,27% 4,49% -0,83% 3,40%
14-07-2010 Downgrade to A1
t-test -0,62 0,54 0,21 -1,09 -0,28
CAR -1,27% 1,78% 0,56% -3,02% 1,30%
21-12-2010 Outlook Revision
t-test 0,51 -0,34 -1,10 1,18 0,17
CAR 1,01% -1,78% -2,51% 2,96% 0,39%
15-03-2011 Downgrade to Baa1 & Outlook Revision
t-test -0,82 -0,2905 -0,35 -0,6957 -1,12
CAR -1,64% -1,29% -0,89% -1,98% 2,56%
05-07-2011 Downgrade to Ba2
t-test -0,36 -0,90 -2,03*** -0,87 -0,70
CAR -0,83% -3,29% -6,77% -2,56% 2,12%
*** p<0.01, ** p<0.05, * p<0.1
Source: Author Calculations
Appendix 2 (part4) - Sovereign Downgrade
Agency: Fitch
Bank
Event Banking Industry Banif BCP BES BPI
24-04-2010 Downgrade to AA-
t-test 2,36*** 3,11*** 0,52 3,63*** 0,14
CAR 3,14% -8,66% 1,24% 7,72% 0,31%
23-12-2010 Downgrade to A+
t-test 0,23 -0,11 -0,19 0,88 -0,44
CAR 0,43% -0,59% -0,48% 2,16% -1,02%
24-03-2011 Downgrade to A- & Outlook Revision
t-test -2,52*** -0,80 2,43*** -1,74* -1,36
CAR -5,19% -3,57% -6,25% -5,12% -3,16%
01-04-2011 Downgrade to BBB- & Outlook Revision
t-test 1,22 -0,18 1,30 0,40 2,52***
CAR 2,59% -0,79% 3,45% 1,21% 6,06%
24-11-2011 Downgrade to BB+
t-test -0,90 -1,33 -1,79* 2,05*** 0,15
CAR -4,29% -8,13% 12,21% 10,42% 0,85%
*** p<0.01, ** p<0.05, * p<0.1
Appendix 3 (part1)- Sovereign Outlook Revisions
S&P Moody's S&P Moody's S&P Moody's S&P Moody's S&P Moody's
VARIABLES banks banks BES BES BCP BCP BPI BPI Banif Banif
PSI20 1.208*** 1.202*** 1.119*** 1.114*** 1.266*** 1.257*** 1.090*** 1.096*** 0.898*** 0.901*** (0.0419) (0.0426) (0.0510) (0.0522) (0.0499) (0.0499) (0.0479) (0.0487) (0.0503) (0.0522) t-5 0.000372 0.00837* -0.000586 0.0216* -0.00249 0.00127 0.0136 0.0157*** -0.00318 -0.00951 (0.00423) (0.00441) (0.00547) (0.0113) (0.00347) (0.00237) (0.0108) (0.00235) (0.00489) (0.0142) t-4 -0.0154 0.00551 -0.0221** 0.0146 -0.0126 0.00167 0.00579 0.00572 -0.00286 0.00976***
(0.0130) (0.00385) (0.0101) (0.0179) (0.0147) (0.00372) (0.00809) (0.0110) (0.0104) (0.00192) t-3 -0.00348* -0.0146*** 0.00368 0.0283*** -0.00649 0.00882*** -0.00782 0.0160*** -0.00232 -0.00658 (0.00189) (0.00111) (0.00361) (0.000889) (0.00442) (0.00119) (0.00559) (0.00283) (0.00822) (0.00948) t-2 0.0172 0.00490*** 0.0393 0.00518** 0.00604** 0.00951*** 0.0175 -0.00311 0.0287*** -0.0151***
(0.0111) (0.00131) (0.0322) (0.00252) (0.00261) (0.00164) (0.0121) (0.00396) (0.00681) (0.00113) t-1 0.00397 -0.00204 0.00233 0.00111 0.00434 -0.00290 0.0122 -0.00401 0.0181 -0.0219***
(0.00488) (0.00172) (0.00641) (0.00978) (0.00556) (0.00235) (0.0131) (0.00449) (0.0126) (0.00204) t0 -0.00396 0.000377 -0.0281 -0.0127 0.00934 0.00595 -9.35e-05 -0.00158 0.0192 -0.00933 (0.00977) (0.00520) (0.0234) (0.00774) (0.00783) (0.00563) (0.00209) (0.00153) (0.0197) (0.00605) t+1 -0.0190*** 0.0222 -0.0129** 0.0161*** 0.0214*** 0.0220 -0.00851 0.0326** 0.0145 0.0102
(0.00391) (0.0135) (0.00513) (0.00388) (0.00495) (0.0173) (0.0102) (0.0143) (0.0143) (0.0125) t+2 0.00261 0.00920 0.0132 0.00788* -0.00394 0.0154 0.00335 -0.0120* 0.0161 -0.00931 (0.00338) (0.00794) (0.00863) (0.00479) (0.00317) (0.0130) (0.00551) (0.00664) (0.0212) (0.0161) t+3 -0.0131** -0.00567 -0.0200* -0.000625 -0.00722 -0.00902 -0.00498 -0.00107 0.0275 0.000137
(0.00581) (0.00359) (0.0106) (0.00827) (0.00579) (0.00830) (0.0125) (0.00285) (0.0211) (0.00834) t+4 -0.00904* -0.000472 -0.0145 -0.00669 -0.0100** 0.00193 -0.00328 0.000388 -0.0119** -0.00505 (0.00519) (0.00200) (0.0110) (0.00732) (0.00436) (0.00172) (0.00682) (0.00626) (0.00500) (0.00600) Constant 0.000999** 0.00115*** -0.000559 -0.000712 0.00108** -0.00125** 0.00111** -0.00104* 0.00174*** -0.00131**
(0.000422) (0.000424) (0.000496) (0.000515) (0.000536) (0.000532) (0.000535) (0.000534) (0.000584) (0.000594)
Observations 1,304 1,304 1,304 1,304 1,304 1,304 1,304 1,304 1,304 1,304
R-squared 0.584 0.580 0.467 0.453 0.491 0.489 0.418 0.418 0.292 0.281
Robust standard errors in parentheses
Appendix 3 (part2) - Bank Level Outlook Revisions
VARIABLES
BES BCP BPI
S&P Moody's S&P Moody's S&P Moody's PSI20 1.125*** 1.102*** 1.259*** 1.262*** 1.079*** 1.094*** (0.0511) (0.0503) (0.0499) (0.0498) (0.0478) (0.0485) t-5 -0.0280 -0.00245 -0.0234 -0.00774 0.0129 -0.0152 (0.0188) (0.00362) (0.0161) (0.00598) (0.0150) (0.0176) t-4 0.00326 0.0159** -0.0117* -0.00619 -0.00680 -0.00127 (0.00878) (0.00766) (0.00608) (0.00476) (0.0115) (0.00475) t-3 0.0676 0.0122 0.00172 -0.0110** 0.0324* 0.00288
(0.0576) (0.0150) (0.00218) (0.00470) (0.0187) (0.00718) t-2 0.0106 0.0132 0.0140 0.0105*** 0.0315* -0.00386 (0.00805) (0.0256) (0.00859) (0.00362) (0.0178) (0.00520) t-1 -0.0538 -0.00736 -0.00444 -0.000424 -0.0102** 0.00886
(0.0390) (0.00829) (0.00908) (0.0112) (0.00466) (0.00582) t0 0.00732*** -0.00735 -0.00372 0.0113*** 0.00826 0.00567
(0.00184) (0.0193) (0.00432) (0.00393) (0.0129) (0.00807) t+1 0.0122 0.00669 -0.0126 -0.00684 0.00934*** -0.00470 (0.0176) (0.0127) (0.00945) (0.00554) (0.00324) (0.00679) t+2 -0.0353*** 0.0141** -0.00212 0.0105 0.0233** 0.0148*
(0.0133) (0.00652) (0.00951) (0.0127) (0.0100) (0.00871) t+3 -0.00106 0.0270 0.00800*** 0.0113 -0.0103 0.00113
(0.00612) (0.0166) (0.00222) (0.00943) (0.0106) (0.00860) t+4 -0.00326 0.000701 -0.0140 -0.00367 -0.00525 0.00587* (0.0241) (0.00488) (0.0149) (0.00519) (0.0321) (0.00317) Constant -0.000624 0.000913* -0.00107** 0.00118** -0.00113** 0.00107** (0.000491) (0.000504) (0.000532) (0.000536) (0.000528) (0.000539)
Observations 1,304 1,304 1,304 1,304 1,304 1,304
R-squared 0.473 0.456 0.491 0.490 0.422 0.418
Robust standard errors in parentheses
Appendix 3 (part3) - Sovereign Downgrades (Part1)
Banks BES BCP
VARIABLES S&P Moody's DBRS Fitch S&P Moody's DBRS Fitch S&P Moody's DBRS Fitch PSI20 1.202*** 1.203*** 1.204*** 1.206*** 1.112*** 1.114*** 1.116*** 1.115*** 1.259*** 1.260*** 1.261*** 1.265***
(0.0425) (0.0422) (0.0422) (0.0418) (0.0515) (0.0514) (0.0512) (0.0512) (0.0506) (0.0502) (0.0502) (0.0497) t-5 -0.0104 0.000226 -0.00576 0.00672 -0.00880 0.00564 0.0121*** -0.00318 -0.00639 -0.00576 -0.00304 0.0123* (0.00809) (0.00469) (0.00599) (0.00562) (0.00895) (0.0115) (0.00341) (0.00380) (0.0135) (0.00459) (0.00678) (0.00707) t-4 -0.00153 -0.00374 -0.00365 0.00958 -0.00255 -0.00778 -0.0193** -0.00205 -0.00391 -0.00270 0.00531 0.0162
(0.00427) (0.00609) (0.00524) (0.0111) (0.00730) (0.00498) (0.00875) (0.00833) (0.00447) (0.00977) (0.0136) (0.0171) t-3 0.00905** 0.00205 -0.0153 0.00537 -0.00151 0.0121** -0.0122 -0.00410 -0.0178** -0.00243 -0.0168 0.00997 (0.00392) (0.00489) (0.0106) (0.0219) (0.00592) (0.00548) (0.00978) (0.0108) (0.00774) (0.00806) (0.0111) (0.0287) t-2 0.00424 0.00854 0.00988* 0.000223 0.00672 0.00884* 0.0116*** -0.00892 -0.000679 0.00981 0.0234*** 0.00377 (0.0110) (0.00667) (0.00587) (0.00319) (0.0165) (0.00458) (0.000504) (0.00664) (0.00830) (0.00948) (0.00789) (0.00483) t-1 -0.00436 0.00508** -0.00921 0.00173 -0.0120** -0.00270 -0.0246 -0.00114 -0.00226 0.00735*** -0.00133 0.00429
(0.00491) (0.00238) (0.0243) (0.00443) (0.00551) (0.00365) (0.0286) (0.00379) (0.00561) (0.00233) (0.0213) (0.00582) t0 -0.00566 0.0151*** -0.00881 -0.0128 0.00867** 0.0167*** 0.0246*** -0.00503 0.000250 -0.0140* -0.00148 -0.0171
(0.00361) (0.00521) (0.00552) (0.0117) (0.00391) (0.00249) (0.00514) (0.00572) (0.00452) (0.00730) (0.0115) (0.0147) t+1 0.00334 -0.000871 0.0191*** -0.00356 0.00530 -0.00340 -0.0187** -0.00518 0.00300 -0.000340 -0.0210** -0.00410 (0.00505) (0.00919) (0.00304) (0.00447) (0.0116) (0.00366) (0.00771) (0.00332) (0.00371) (0.0121) (0.00982) (0.00663) t+2 0.00359 -0.00169 -0.0179 0.00894*** 0.0104 0.00759 -0.00462 -0.00118 0.000275 -0.00654 -0.0252 -0.00964 (0.00792) (0.00339) (0.0125) (0.00313) (0.00990) (0.00622) (0.00283) (0.00372) (0.00799) (0.00417) (0.0203) (0.00634) t+3 0.00462 -0.0106** 0.00565 0.00199 0.00184 -0.0134** 0.00826 -0.000969 0.00207 -0.0102* 0.00612 0.00335
(0.00689) (0.00433) (0.0154) (0.00853) (0.0101) (0.00547) (0.00940) (0.00957) (0.00643) (0.00551) (0.0195) (0.0110) t+4 -0.0101* 0.00911 0.00673 -0.00680 -0.0142** 0.00548 0.0286 0.00101 -0.00706 0.00939 -0.00493 -0.0119 (0.00526) (0.00965) (0.0242) (0.0138) (0.00720) (0.0137) (0.0211) (0.0154) (0.00431) (0.00729) (0.0262) (0.0135) Constant 0.00103** 0.00108** 0.00104** 0.00110*** -0.000595 -0.000674 -0.000543 -0.000565 0.00109** -0.00115** 0.00116** 0.00124**
(0.000425) (0.000426) (0.000419) (0.000415) (0.000514) (0.000518) (0.000511) (0.000519) (0.000536) (0.000535) (0.000526) (0.000519)
Observations 1,304 1,304 1,304 1,304 1,304 1,304 1,304 1,304 1,304 1,304 1,304 1,304
R-squared 0.580 0.580 0.581 0.581 0.452 0.451 0.456 0.449 0.489 0.489 0.491 0.492
Robust standard errors in parentheses
Appendix 3 (part4) - Sovereign Downgrades
VARIABLES
BPI Banif
S&P Moody's DBRS Fitch S&P Moody's DBRS Fitch
PSI20 1.090*** 1.086*** 1.088*** 1.085*** 0.895*** 0.891*** 0.898*** 0.898*** (0.0486) (0.0480) (0.0479) (0.0481) (0.0509) (0.0508) (0.0505) (0.0509) t-5 -0.0114** 0.0150 -0.0111 0.00195 -0.00341 0.0106 0.0137*** 0.00907 (0.00532) (0.0106) (0.0106) (0.00629) (0.00447) (0.0133) (0.00378) (0.00792) t-4 0.00731 -0.00181 0.00957 0.00225 0.00358 -0.00396 0.00920 -0.00191 (0.00759) (0.00560) (0.0111) (0.00618) (0.00589) (0.00693) (0.00715) (0.00405) t-3 -0.00184 0.00134 -0.0200 0.00134 -0.00705* 0.00502 0.0105 -0.00154 (0.00698) (0.00154) (0.0144) (0.0137) (0.00382) (0.00938) (0.0247) (0.00452) t-2 0.00692 0.00251*** -0.00362 -0.00220 0.000357 0.0110 0.0278*** -0.00626 (0.0100) (0.000904) (0.0152) (0.00248) (0.00703) (0.0116) (0.00178) (0.00856) t-1 -0.00280 -0.00133 -0.00487 -0.00427 2.43e-05 0.0213*** -0.00608 0.0112*** (0.00658) (0.00362) (0.0203) (0.00589) (0.00776) (0.00309) (0.0102) (0.00293) t0 -0.0162 -0.0189*** 0.0108*** -0.0113 -0.0110 -0.0161** 0.00409 -0.00811 (0.0128) (0.00302) (0.00128) (0.0134) (0.00795) (0.00626) (0.00675) (0.0110) t+1 -0.0119 0.000475 -0.00776 0.00587 -0.00509 0.0117 0.0331*** -0.00736 (0.00779) (0.00755) (0.00795) (0.00564) (0.00647) (0.00925) (0.00104) (0.00896) t+2 0.00476 -2.08e-05 0.0264*** -0.0142 0.00335 -0.00316 -0.00126 -0.00545 (0.00883) (0.00139) (0.00845) (0.0130) (0.00821) (0.00237) (0.0233) (0.00884) t+3 0.00280 -0.00854* -0.0193 0.00146 -0.00422 0.00437 -0.0155 -0.0125** (0.00861) (0.00454) (0.0211) (0.00965) (0.00559) (0.00766) (0.0297) (0.00577) t+4 -0.00358 0.0134 0.0164 0.0202** -0.0109** -0.0186* 0.0193 -0.00418 (0.00336) (0.0126) (0.0197) (0.00905) (0.00452) (0.0106) (0.0323) (0.00818) Constant 0.000922* -0.00103* 0.000903* -0.00103* 0.00129** 0.00138** 0.00143** 0.00123** (0.000537) (0.000538) (0.000530) (0.000534) (0.000601) (0.000596) (0.000587) (0.000600)
Observations 1,304 1,304 1,304 1,304 1,304 1,304 1,304 1,304
R-squared 0.417 0.417 0.419 0.418 0.281 0.284 0.285 0.282
Robust standard errors in parentheses