Article
ISSN 0102-695X
doi: 10.1590/S0102-695X2011005000028
Received 9 Jul 2010 Accepted 14 Sep 2010 Available online 4 Mar 2011
to predict aldose reductase inhibition by
l avonoid compounds
Luciana Scotti,
4Mariane B. Fernandes,
1Eric Muramatsu,
1Kerly F. M. Pasqualoto,
1Vicente de P. Emereciano,
2Leoberto C.
Tavares,
1Marcelo Sobral da Silva,
4Marcus T. Scotti
*,31Faculdade de Ciências Farmacêuticas, Universidade de São Paulo, Brazil, 2Instituto de Química, Universidade de São Paulo, Brazil,
3Centro de Ciências Aplicadas e Educação, Universidade Federal da Paraíba,
Campus IV, Brazil,
4Laboratório de Tecnologia Farmacêutica, Universidade Federal da Paraíba,
Campus I, Brazil.
Abstract: Aldose Reductase (AR) is the polyol pathway key enzyme which converts glucose to sorbitol. High glucose availability in insulin resistant tissues in diabetes leads into an accumulation of sorbitol, which has been associated with typical chronic complications of this disease, such as neuropathy, nephropathy and retinopathy. In this study, 71 flavonoids AR inhibitors were subjected to two methods of SAR to verify crucial substituents. The first method used the PCA (Principal Component Analysis) to elucidate physical and chemical characteristics in the molecules that would be essential for the activity, employing VolSurf descriptors. The rate obtained explained 53% of the system total variance and revealed that a hydrophobic-hydrophilic balance in the molecules is required, since very polar or nonpolar substituents decrease the activity. Artificial Neural Networks (ANNs) was also employed to determine key substituents by evaluating substitution patterns, using NMR data. This study had a high success rate (85% accuracy in the training set and 88% accuracy in the test set) and showed polihydroxilations are essential for high activity and methoxylations and glicosilations primarily at positions C7, C3' and C4' decrease the activity.
Keywords:
flavonoids
13C NMR
aldose reductase
Artificial Neural Networks VolSurf
Introduction
The high incidence and degree of morbidity make diabetes a serious disease in modernity, affecting more than 150 million people worldwide. The World Health Organization estimates that diabetes deaths are likely to increase by more than 50% in the next 10 years without urgent action (WHO, 2000).
The pathological mechanism of this disease is complex but is based on the pathway of polyols, which has the aldose reductase (AR) as a key enzyme (EC 1.1.1.21) (Kinoshita, 1974). AR catalyzes the reduction of glucose to sorbitol using nicotinamide-adeninenucleotide phosphate (NADPH) as a cofactor and, in normal tissues, this conversion occurs in little extent because AR has low substrate afi nity to glucose. Concomitantly, sorbitol is oxidized to fructose by sorbitol dehydrogenase. In diabetes mellitus, however, the increased availability of glucose in insulin resistant tissues such as lens, nerve, and retina leads to an increased formation of sorbitol
through the polyol pathway and so, sorbitol is produced faster than its oxidation to fructose (Fernández et al., 2005). It is known that sorbitol does not readily diffuse across cell membranes and its intracellular accumulation has been implicated in chronic complications of diabetes such as cataract, neuropathy, retinopathy, myocardial ischemic injury and atherosclerosis due to hyperosmotic effect (Demiot et al., 2006; Sun et al., 2006; Iwata et al., 2006; Fernández et al., 2005). These i ndings suggest that an aldose reductase inhibitor prevents the conversion of glucose to sorbitol and may have the capacity of preventing and/or treating several diabetic complications (Matsuda et al., 2002).
5000 individual known compounds. Some structural requirements of lavonoids for AR inhibitory activity were clariied, as lavones and lavonols having a catechol moiety at the B ring (3’,4’-dihydroxyl moiety) show stronger activity (Matsuda et al., 2002). Mercader et al., in 2008, constructed predictive QSAR models of inhibitory activity against AR enzyme for 55 lavonoids using a lot of kinds of descriptors (topological, geometrical and physical-chemical). A QSAR study of 57 lavones using topological descriptors associated with Multiple Linear Regressions (MLR) and Partial Least Squares (PLS) suggest some structural features for activity as structures rich in aromatic CH fragments, with a limited number of aliphatic fragments and and free hydroxyls in positions 7, 3’ and 4’ (Prabhakar et al., 2006).
Flavonoids are a class of secondary plant phenolics with signiicant antioxidant and chelating properties; cardioprotective effects stem from the ability to inhibit lipid peroxidation, chelate redox-active metals, and attenuate other processes involving reactive oxygen species. The basic syntheses, hydroxylases, and reductases of lavonoid pathways are presumed to have evolved from enzymes of primary metabolism. They possess a high variety of biological activities including antiinlammatory, antimicrobial, antiallergenic, antiviral, vasodilating action and antioxidant activity. These compounds are able either to suppress free radical formation and chain initiation or to scavenge free radical and chain propagation (Varma, 1986; Heim et al., 2002; Stafford, 1991; Fernández et al., 2005).
Flavonoids contain a basic structure constituted of 15 carbon atoms arranged in three rings (C6-C3-C6), and derive part of their structures from shikimate and part from polyketide pathway, and show the molecular structural requirements for a remarkable AR inhibition effect. It is reported that the two planar hydrophobic regions with hydrogen bonding substituents and an area containing a group such as a carbonyl or a thiocarbonyl, capable of undergoing reversible nucleophilic attack, are important to a satisfatory AR inhibition (Kador et al., 1985). The polyhydroxylation, especially at C-7 and C-4’, is also linked to an AR inhibition effect (Kador et al., 1985; Klopman Buyukbingol, 1988).
Studies that relate the biological activity or pharmacokinetic properties, including absorption, distribution, metabolism and excretion (ADME), of compounds with their physico-chemical and structural properties can lead to the identiication of most promising candidates for new drugs (Yamashita & Hashida, 2004). The molecular properties calculated from three-dimensional (3D) maps of interaction energy have emerged as a new approach to explore pharmacokinetic proiles and their determinants. In this context, VolSurf (Cruciani et al., 2000a,b,c; Crivori et al., 2000) is a computational procedure capable of computing the 3D
maps of molecular interactions and, using methods of image processing, transform these ields into simple molecular descriptors to interpret.
In order to describe the compounds molecular structure, in addition to the interaction energy maps data,
13C NMR data (Nuclear Magnetical Ressonance Carbon
13) can be used. 13C NMR spectrum is sensitive in detecting
small differences in the molecule, which are measured by the variation of chemical shifts and the values can be used to associate the chemical structure with the respective biological activity, since this association can help to understand the inluence of the chemical environment on the biological activity selected. The combination of such data can be made using a computational procedure called Artiicial Neural Networks or ANNs, which are systems not restricted to linear correlation approaches (Lawrence, 1994; Pierce & Hohne, 1995), making them an option for data analysis with unknown or uncertain correlation.
The most used ANN architecture for pattern recognition is the Kohonen network, also named Self-Organizing Map (SOM) (Kohonen, 2001). A SOM can map multivariate data onto a two dimensional grid, grouping similar patterns near each other and it was successfully used in several applications using chemistry database, such as classiication of photochemical reactions (Zhang & Aires-de-Souza, 2005), chemotaxonomy of the Asteraceae family (Da Costa et al., 2005; Hristozov et al., 2007), for a series of 103 sesquiterpene lactones which showed anti-inlammatory activity (Wagner et al., 2006), in drug design (Gasteiger et al., 2003), in the prediction of the cytotoxic potency of 55 SLs (Fernandes et al., 2008), in the comparison of dataset compounds (Bernard, 1998), in the classiication of metabolites (Gupta & Aires-de-Sousa, 2007) and in the prediction of the diterpene skeletons (Emerenciano et al., 2006) classiication of plants at lower hierarchical levels (Correia et al., 2008).
This study is an attempt to identify the molecular substituents that lead to a high capacity in inhibiting AR enzyme and to identify those that decrease the activity when inserted in the lavonoid molecule, proposing a model compound for further focused studies, helping the rational development of drugs against diabetes.
Material and Methods
Dataset and Molecular Modeling
Molecules were classiied as active (37 molecules with pIC50>5,69 µmol/L) and inactive ones (34 molecules with pIC50≤5,35 µmol/L).
The three dimensional structures were drawn
and molecular modeling computations were performed on SPARTAN for Windows v. 4.0 software (Wavefunction Inc, 2010). Initially, the mechanic molecular method MMFF94 was applied. Molecular mechanics describes
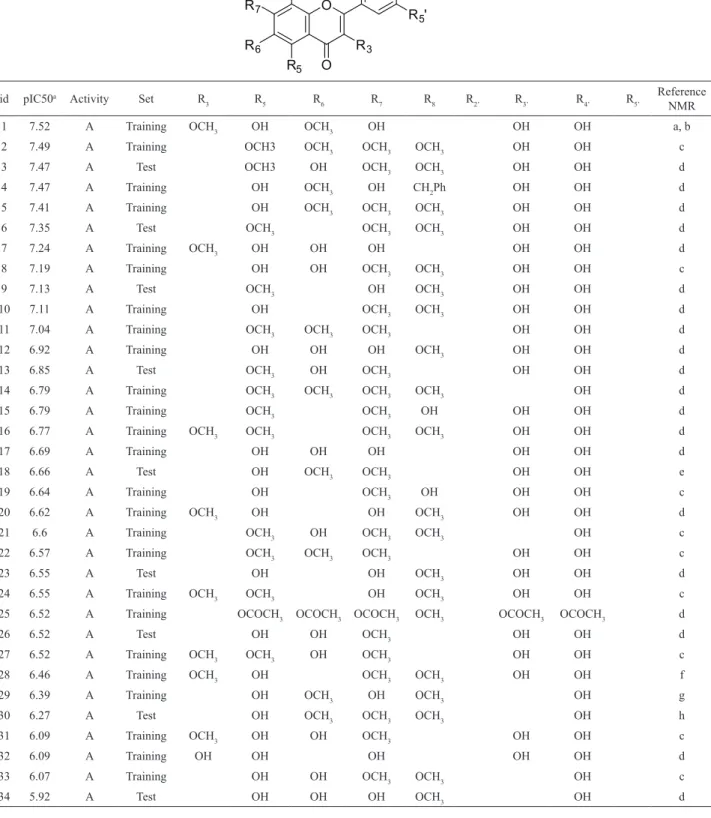
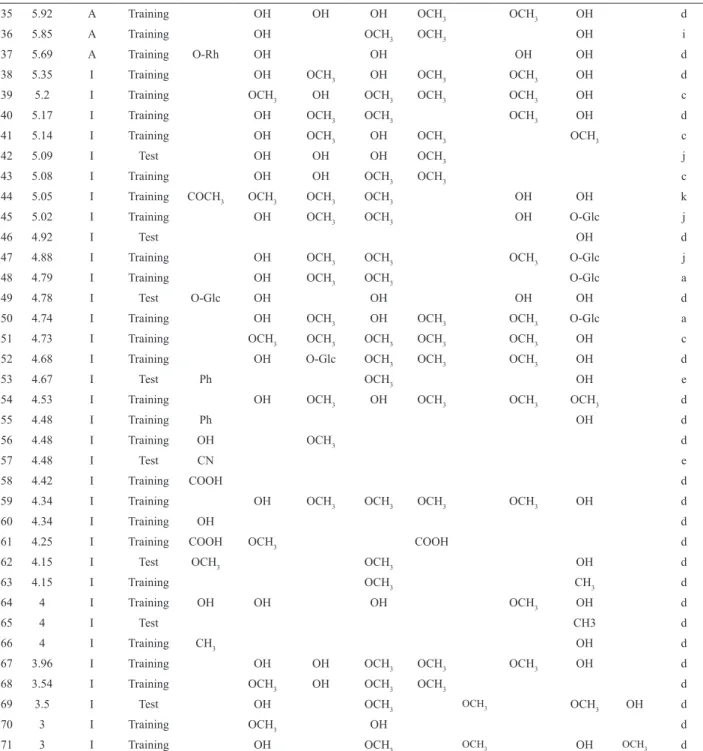
Table 1. Compounds, their biological activities (pIC50=-log IC50), activity and set classiication for the self-organizing maps,
chemical structure set.
id pIC50a Activity Set R
3 R5 R6 R7 R8 R2’ R3’ R4’ R5’
Reference NMR
1 7.52 A Training OCH3 OH OCH3 OH OH OH a, b
2 7.49 A Training OCH3 OCH3 OCH3 OCH3 OH OH c
3 7.47 A Test OCH3 OH OCH3 OCH3 OH OH d
4 7.47 A Training OH OCH3 OH CH2Ph OH OH d
5 7.41 A Training OH OCH3 OCH3 OCH3 OH OH d
6 7.35 A Test OCH3 OCH3 OCH3 OH OH d
7 7.24 A Training OCH3 OH OH OH OH OH d
8 7.19 A Training OH OH OCH3 OCH3 OH OH c
9 7.13 A Test OCH3 OH OCH3 OH OH d
10 7.11 A Training OH OCH3 OCH3 OH OH d
11 7.04 A Training OCH3 OCH3 OCH3 OH OH d
12 6.92 A Training OH OH OH OCH3 OH OH d
13 6.85 A Test OCH3 OH OCH3 OH OH d
14 6.79 A Training OCH3 OCH3 OCH3 OCH3 OH d
15 6.79 A Training OCH3 OCH3 OH OH OH d
16 6.77 A Training OCH3 OCH3 OCH3 OCH3 OH OH d
17 6.69 A Training OH OH OH OH OH d
18 6.66 A Test OH OCH3 OCH3 OH OH e
19 6.64 A Training OH OCH3 OH OH OH c
20 6.62 A Training OCH3 OH OH OCH3 OH OH d
21 6.6 A Training OCH3 OH OCH3 OCH3 OH c
22 6.57 A Training OCH3 OCH3 OCH3 OH OH c
23 6.55 A Test OH OH OCH3 OH OH d
24 6.55 A Training OCH3 OCH3 OH OCH3 OH OH c
25 6.52 A Training OCOCH3 OCOCH3 OCOCH3 OCH3 OCOCH3 OCOCH3 d
26 6.52 A Test OH OH OCH3 OH OH d
27 6.52 A Training OCH3 OCH3 OH OCH3 OH OH c
28 6.46 A Training OCH3 OH OCH3 OCH3 OH OH f
29 6.39 A Training OH OCH3 OH OCH3 OH g
30 6.27 A Test OH OCH3 OCH3 OCH3 OH h
31 6.09 A Training OCH3 OH OH OCH3 OH OH c
32 6.09 A Training OH OH OH OH OH d
33 6.07 A Training OH OH OCH3 OCH3 OH c
34 5.92 A Test OH OH OH OCH3 OH d
O
R3 R3' R2'
R5' R4'
O R5 R6 R7
35 5.92 A Training OH OH OH OCH3 OCH3 OH d
36 5.85 A Training OH OCH3 OCH3 OH i
37 5.69 A Training O-Rh OH OH OH OH d
38 5.35 I Training OH OCH3 OH OCH3 OCH3 OH d
39 5.2 I Training OCH3 OH OCH3 OCH3 OCH3 OH c
40 5.17 I Training OH OCH3 OCH3 OCH3 OH d
41 5.14 I Training OH OCH3 OH OCH3 OCH3 c
42 5.09 I Test OH OH OH OCH3 j
43 5.08 I Training OH OH OCH3 OCH3 c
44 5.05 I Training COCH3 OCH3 OCH3 OCH3 OH OH k
45 5.02 I Training OH OCH3 OCH3 OH O-Glc j
46 4.92 I Test OH d
47 4.88 I Training OH OCH3 OCH3 OCH3 O-Glc j
48 4.79 I Training OH OCH3 OCH3 O-Glc a
49 4.78 I Test O-Glc OH OH OH OH d
50 4.74 I Training OH OCH3 OH OCH3 OCH3 O-Glc a
51 4.73 I Training OCH3 OCH3 OCH3 OCH3 OCH3 OH c
52 4.68 I Training OH O-Glc OCH3 OCH3 OCH3 OH d
53 4.67 I Test Ph OCH3 OH e
54 4.53 I Training OH OCH3 OH OCH3 OCH3 OCH3 d
55 4.48 I Training Ph OH d
56 4.48 I Training OH OCH3 d
57 4.48 I Test CN e
58 4.42 I Training COOH d
59 4.34 I Training OH OCH3 OCH3 OCH3 OCH3 OH d
60 4.34 I Training OH d
61 4.25 I Training COOH OCH3 COOH d
62 4.15 I Test OCH3 OCH3 OH d
63 4.15 I Training OCH3 CH3 d
64 4 I Training OH OH OH OCH3 OH d
65 4 I Test CH3 d
66 4 I Training CH3 OH d
67 3.96 I Training OH OH OCH3 OCH3 OCH3 OH d
68 3.54 I Training OCH3 OH OCH3 OCH3 d
69 3.5 I Test OH OCH3 OCH3 OCH3 OH d
70 3 I Training OCH3 OH d
71 3 I Training OH OCH3 OCH3 OH OCH3 d
a Al-Yahya et al., 1988; b Flamini et al., 2001; c ACD/HNMR, 2003; d Agrawal, 1989; e Maldonado & Ortega, 1997; f Brown et al., 2003; g Greenham et al., 2001; h Jahaniani et al., 2005; i Youssef et al., 1995; j Horie et al., 1998; k Nagao et al., 2002.
Table 1. Continuation
molecules in terms of bonded atoms which have been distorted from some idealized geometry due non-bonded van der Waals and Coulombic interactions. Molecular mechanics methods differ in the number and nature of terms which they incorporate, as well details of parameterization. The MMFF94, developed at Merck Pharmaceuticals, is is limited in scope to organic systems and biopolymers. The molecules were subjected to geometry optimization and conformational analysis
(systematic analysis with dihedral angle rotationed at each 30°).
distances equal to the sum of their van der Waals radii. The termination condition and minimization method used were the patterns of SPARTAN. For both molecular mechanics and for semi-empirical method it was used the energy minimization method known as “conjugate gradient Polak-Ribière” (Leach, 2001).
VolSurf approach
Molecules with their energies minimized were saved as Sybyl MOL2 Files for multivariate characterization based on their interaction energy with chemical probes. GRID program (Kastenholz et al., 2000; Molecular Discovery, 2010) was used in VolSurf 4.1.4.3 for Linux (Cruciani et al., 2000a; Molecular Discovery, 2010), included in Sybyl program v. 6.9.1 (Tripos Inc, 2010), to calculate molecular interaction ields, which may be viewed as 3D matrixes, whereas elements (called grid nodes) are the attractive and repulsive forces between an interacting partner (the probe) and a target (the molecule or macromolecule), computed at sample positions (the grid points). VolSurf is speciically designed to produce descriptors related to pharmacokinetic properties (Cruciani, 2000a,b,c; Crivori, 2000). In this irst evaluation of the dataset using PCA presented in this article, only water (OH2) and DRY probes were employed because they are the most suitable to describe lipophilicity and hydrogen interactions. Water (OH2) probe was used to simulate solvation-desolvation processes, while DRY probe (hydrophobic) was used to simulate drug-membrane interactions. Thus, together, these probes are able to simulate absorption and distribution processes of drugs, which are primarily regulated by their hydrophobicity, since it is necessary that they dissolve and pass through biological membranes which form the tissues and the multicompartimental systems, until they reach their respective action sites (Cruciani, 2000c).
Principal Component Analysis (PCA) is a chemometric tool for extracting and rationalizing the information from any multivariate description of a biological system. PCA condenses the overall information into two smaller matrixes, namely the scores plot, which shows the pattern of compounds, and the loadings plot, which shows the pattern of descriptors. PCA provides information about the relationships between samples in a data set but also gives us insight into relationships between variables. The utility of PCA for dimension reduction lies in the fact that the PCs are generated so that they explain maximal amounts of variance. The loadings plot is composed of a few vectors (Principal Components, PCs) which are obtained as lineal combinations of the original X-variables. In turn, each object in the scores plot is described in terms of its projections onto the PCs, instead of the original variables (Wold et al., 1987).
This step was also performed automatically by VolSurf program. The autoscaling and centering procedures were applied to the PCA analysis.
Self-organizing maps approach
For the analysis correlating the 13C NMR data
(table in supplementary material) and the lavonoid inhibitory activities, the former were obtained from the literature (Al-Yahya et al., 1988; Flamini et al., 2001; Agrawal, 1989; Maldonado & Ortega, 1997; Greenham et al., 2001; Jahaniani et al., 2005; Youssef & Frahm, 1995; Horie et al., 1998; Nagao, 2002) and, for some structures, they were extracted using ACDlabs software (ACD/HNMR, 2003), since lavonoids are plane aromatic compounds, and so, the aditivity model can be applied satisfactorily to predict 13C NMR data. To validate the
method employed in the 13C NMR data prediction, the
chemical shifts of some lavonoids were predicted and compared to the literature data (table in supplementary material), showing errors smaller than 3ppm. To standardize the 13C NMR analysis, since not all structures
have glycosil and methyl groups, the 13C NMR data used were only the chemical shifts pertaining to the lavonoid skeleton.
The correlation between the 13C NMR data
and biological activity was performed using the SOM Toolbox version 2.0 for Matlab version 6.5 computing environment by MathWorks, Inc (Mathworks, 2004; Vesanto, 2005). The training was conducted through the Batch-training algorithm, in which the whole dataset is presented to the network before any adjustment is made. The compounds were irst randomly divided into two subsets: one training set composed of 54 structures and one external test set composed of seventeen compounds, suitable to analyze the predictive performance. In each training step, the dataset was partitioned according to the regions of the map weight vectors. Each sample is a 15-dimensional vector. SOMs were generated with the same topology: for the local lattice structure, the rectangular grid was used, while sheet was used to indicate the global map shape, using Gaussian neighborhood function. The literature shows that the determination of the size of the SOMs is an empiric process (Kohonen, 2001). Initially a heuristic formula of m=5.(n)0.5 is used for total number of
map units, where n is the number of samples. The ratio of side lengths is based on the two biggest eigenvalues of the covariance matrix of the given data. Some different maps sizes were prepared, based on the initial map, generated as described before.
Results and Discussion
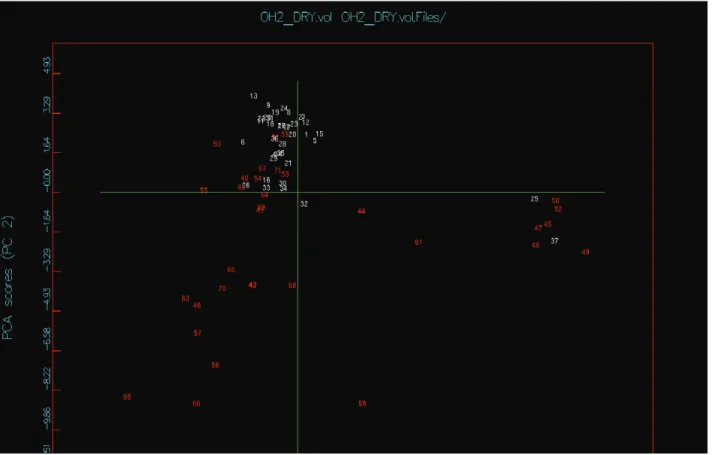
VolSurf descriptors have been presented and explained in detail elsewhere (Crivori et al., 2000; Cruciani et al., 2000; Molecular discovery, 2010). In Figure 1, PC1 explained 40.5% and PC2 explained 12.5% of the total variance, accounting for approximately 53% of the total variance of the matrix. The second PC discriminates more clearly between the active and inactive compounds. A more detailed inspection of the scores plot in Figure 1 indicates that in the upper quadrant, 77.3% of the compounds are active and in the lower quadrant, 88.9% of the compounds are inactive. Ten inactive (structures
39, 40, 51, 53, 54, 55, 62, 67, 71 and 79) and three active (structures 25, 32 and 37) compounds were misclassiied,
so 92% of active molecules were grouped together, while for the inactive ones the percentage was 70.5%.
By analyzing the scores and loadings plots (Figures 1 and 2) together it is possible to observe that the DRY probe descriptors are predominantly associated to the active structures region. High values of the descriptors Emin1-3DRY, D13DRY, BV12DRY and BV32DRY are associated to active structures, while high values of the hydrophilic descriptors Iw7-8OH2 and all the Cwx are associated to the inactive ones. Local Interaction Energy minima descriptors (Emin1 - Emin3) represent the energies of interaction in kcal/mol, for the interaction between the OH2 and DRY probes and the target molecule.
Hydrophobic regions (D1 - D8) are deined when a DRY probe is interacting with a target molecule. Best Volumes (BV11 BV21 BV31 BV12 BV22 BV32) are six new descriptors which represent the best three hydrophilic generated by a water molecule when interacting with the target. Integy moments descriptors (Iw1-Iw8) measure the unbalance between the center of mass of a molecule and the position of the hydrophilic regions around it. Capacity factors (Cw1 - Cw8) represent the ratio between the hydrophilic regions and the molecular surface, i.e. the amount of hydrophilic regions per surface unit (Crivori al., 2000; Cruciani et al., 2000; Molecular discovery, 2010). It should be noted that in the active structures region there is a hydrophilic contribution of descriptors such as D12OH2, D13OH2 and D23OH2, indicating that there must be an ideal hydrophilic-hydrophobic balance for the structures to behave as active. This balance becomes clearer when the inactive structures outside the "core" of active ones (structures 53 and 55) are analysed. Such compounds have been heavily inluenced by the DRY probe descriptors, showing that a hydrophobic character in excess, which can be represented by a phenyl group, reduces the inhibitory activity value.
A more detailed analysis of the scores plot reveals that there is a group of active (structures 25 and
37) and inactive (structures 45, 47, 48, 49, 50 and 52)
Figure 1. PCA scores plot for the compounds in Table 1. Ids in white colors represent the active lavonoids and the red ones represent
compounds at the far right of the plot, being clearly separated from the other compounds. Except id25, all these compounds are glycosylated lavonoids with high hydrophilic character, what does not contribute to the hydrophobic-hydrophilic balance necessary for their interaction with the receptor. The glycosilation causes a great solvation around the structures, what turns them unavailable for interations due to the water molecules shielding. The structure 25 is the sole tetraacetylated, also possessing high hydrophilic character because of the great number of hydroxyl and carbonyl groups. So, it is expected that this molecule is strongly inluenced by the hydrophilic descriptors of capacity factors (CW1-8) and descriptors of hydrophilic regions (W1-8) that abound in this region. The inactive compounds located in the lower right quadrant (structures 41, 42, 43, 46 53, 56, 57, 60, 63, 65, 66, 68, 69 and 70) have fewer free hydroxyl groups and do not have substituents at positions C2' and C3'. When both are hydroxylated, it is known to lead to a good inhibitory activity (Klopman & Buyukbingol, 1998). These compounds are inluenced by Iw7-8 descriptors, which describe the polar core concentration. In these structures, the polarity is concentrated in one ring, that is, an unbalanced distribution of polarity in the molecule seems to be unfavorable for the inhibitory activity.
The inactive structures 44, 58 and 61 in the lower right quadrant have carbonyl (44) and carboxyl (58
and 61) groups, and the latter are the sole structures of the
series owning an acidic group. As mentioned before, with such polar groups, it is expected that the structures are highly solvated, what makes it dificult to interact with the receptor and to pass through membranes, reducing its biological activity. Most of the inactive structures clustered near the active ones in the upper quadrant have structural features like the latter, especially the hydroxylation at C3' or C4', but these compounds present poor activity because they do not have these two positions hydroxylated.
All the active structures, except 30 and 34, have hydroxylations at positions C3' and C4', reiterating the importance of this substitution pattern for the active structures. In addition, all have hydroxyl or methoxy groups at positions C5 and C7, what is especially important because these positions seem to interact with speciic amino acids in the enzime inhibitory site (Carbone et al., 2009). Although the structures 30 and 34 do not possess a hydroxyl group at position C3', they have this group at C5, which contributes to the inhibitory activity. The descriptors inluencing such active structures, as already stated before, are mainly the probe DRY descriptors as EminxDRY and DxDRY and some descriptors of the OH2 probe as DxOH2. Such structures are in a mixed descriptors region, indicating that they can be neither very hydrophobic nor very hydrophilic, so high values of the Eminx, which represent the interaction energies in kcal/mol between the probes (OH2 and DRY) and the
target molecule descriptor, lead to active structures. Summarizing, the active structures are associated to DRY probe descriptors, while high values of the hydrophilic descriptors Iw7-8OH2 and all the Cwx are associated to the inactive ones. There must be an ideal hydrophilic-hydrophobic balance for the structures to behave as active. Some structures, such as the phenyl group, reduce the inhibitory activity by contributing to a hydrophobic character in excess. Glycosylated and tetraacetylated lavonoids and those possessing acidic groups present a high hydrophilic character, what does not contribute to the hydrophobic-hydrophilic balance necessary for their activity. On the other hand, hydroxylations at positions C3' and C4' or C5 and hydroxyl or methoxy groups at positions C5 and C7 increase the activity.
Self-organizing maps approach
Figure 3 shows the Kohonen map obtained after the completion of the training.
Figure 3. Kohonen map obtained after the training phase of set 1 using 13C NMR descriptors. The grey color represents the
active substances, while the black represents the inactive ones.
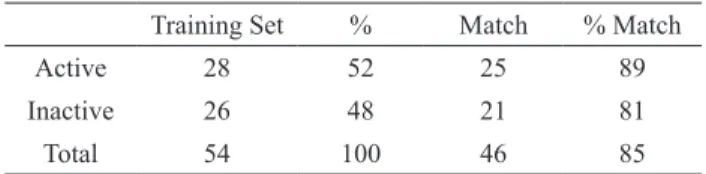
By examining Table 2, it is possible to observe a signiicant success rate with a high percentage of correct relations for both groups (85%). By analyzing the groups separately, the highest number of hits occurred among the active compounds (89%), what can be explained by these compounds substitution pattern which inluences the electromagnetic vicinity in the same way. This substitution pattern could be the polyhydroxylation, especially at C5, C7, C3 and C4'. Thus, the neural network recognized this structural pattern and succeded in classiicating almost all active compounds (25 lavonoids). Table 3 conirms the success of the model by showing a signiicant hit for both groups (88%). The great hit of 100% for the active group and the good accuracy of 75% for the inactive group support the validation of the study.
However, some compounds were mispredicted in both sets. In the training set, compounds 5 and 8 share a replacement pattern with the inactive ones, which is an oxygen atom attached to C5 and C6 and a methoxy group at C7 and C8. Compound 35 has a hydroxyl group at C4'
and a methoxy group attached at C3'. This substitution is also characteristic of inactive compounds. Thus, active compounds that possess such patterns were classiied as inactive by the ANN. The inactive molecules 47 and 48
were misclassiied because of the glycosyl group attached to C4', which gives a chemical shift with a similar value to the free hydroxyl group at C4'. Thus, these molecules resemble active molecules for the ANN, but it is already known thar the glycosylation at C4' usually diminishes or even overrides the biological activity of lavonoids (Molineux, 2004).
Table 2. Summary of the training match results (%).
Training Set % Match % Match
Active 28 52 25 89
Inactive 26 48 21 81
Total 54 100 46 85
Table 3. Summary of the test match results (%).
Training Set % Match % Match
Active 9 53 9 100
Inactive 8 47 6 75
Total 17 100 15 88
For the test set, the mismatches occured among the inactive compounds possessing molecular structures similar to the active compounds. For instance, compound
42, which has NMR values very similar to compounds 9
and 34 and compound 49, which has a hydroxyl group attached to C3 'and C4', a pattern of the test set active molecules.
A detailed look at Figure 4 shows a clear discrimination between the groups. The active compounds correspond to the gray squares and the inactive, to the black ones. Each square in the map illustrates a neuronal region and this illustrates an artiicial brain. If the study is successful, neurons with similar patterns would stimulate their surroundings, and so, a distinction between the areas of the map containing neurons with similar patterns clustered near each other could be observed. There is a predominance of inactive compounds in the left portion of the map. The central and right parts show a strong tendency in clustering active compounds. This distribution shows a satisfactory separation between the groups, which is a consequence of a satisfatory Kohonen study.
the molecule and hydroxylations at C5, C7, C3 'and C4', being the two latter essential for a high activity. However, compounds with polar groups in excess, for instance sugars and acids, or nonpolar, such as the phenyl group, disadvantage the inhibitory activity. Through the 13C
NMR data the ANN achieve a signiicant result, sorting the active and inactive molecules with minimal errors (< 25%). This supports the idea that 13C NMR data can be
used to perform classiication of lavonoids taking into account the biological activity, making clear that radical scavenging activity is highly correlated with the chemical environment.
All these results are conirmed by a recent crystallography study of the enzyme inhibitory site with a classic lavonoid, quercetin (Carbone et al., 2009). In this study, the researchers showed that the hydroxyl group at positions C3 'and C4' make stable hydrogen bonds with the threonine residue 113, the hydroxyl at C7 form hydrogen bonds with Histidine 110 and Tyrosine 48 and C3 hydroxyl makes hydrogen bond with Asparagine 83. In addition, the lavonoid performs a number of other stabilizing interactions with the hydrophobic residues Trp20, Val47, Trp79, Phe115, Phe122, Leu300 and Tyr309, conirming the necessity of the hydrophobic character for a good activity. Therefore, it is possible to predict that a lavonoid lead compound would posses hydroxylations in C3, C5, C7, C3 'and C4', few methoxylation or glicosilations mainly at C7, C3 'or C4 ' positions and the absence of very polar or nonpolar groups.Such a molecule model would be a good starting point to develop studies of rational drug design in the search for new therapeutic arsenals capable of alleviating the pathological complications of diabetes.
Some structural features of lavonoids, as hydroxylations in C7, C3 'and C4' are the same as clariied on previous studies (Matsuda et al., 2002; Prabhakar et al., 2006; Mercader et al., 2008). These indings are important because they were achieved using non-supervised methods and empirical data from 13C NMR.
Besides, VolSurf was suitable to show the importance of some molecules regions and the type of interactions between the substances and the target by means of physico-chemical interpretations. When SOM was used, the search for a linear correlation was not necessary and the interpretation of the results was easier whith simpler descriptors, such as those in VolSurf.
Acknowledgements
The authors thank CNPq and FAPESP (Brazil) for fellowships and inancial support.
References
ACD/HNMR Predictor 7.03 2003. Advanced Chemistry
Development Inc. Toronto, www.acdlabs.com.
Agrawal PK 1989. Carbon-13 NMR of Flavonoids. India: Elsevier.
Al-Yahya MA, El-Sayed AM, Mossa JS, Kozlowski JF, Antoun MD, Ferin M, Baird WM, Cassady JM 1988. Potential cancer chemopreventive and cytotoxic agents from Pulicaria crispa. J Nat Prod 51: 621-624.
Bernard P, Golbraikh A, Kireev D, Chre´tien JR, Rozhkova N 1998. Comparison of chemical databases: analysis of molecular diversity with self organizing maps (SOM). Analysis 26: 333-341.
Brown GD, Liang, GY, Si LK 2003. Terpenoids from the seeds of Artemisia annua. Phytochemistry 64: 303-323. Carbone V, Zhao H, Chung R, Endo S, Hara A, El-Kabbani O
2009. Correlation of binding constants and molecular modelling of inhibitors in the active sites of aldose reductase and aldehyde reductase. Bioorg Med Chem 17: 1244-1250.
Correia MV, Scotti MT, Ferreira MJP, Alvarenga SAV, Rodrigues GV, Emerenciano VP 2008. Self-Organizing
Maps as a new tool for classiication of plants at lower
hierarchical levels. Nat Prod Commun 3: 1723-1730. Crivori P, Cruciani G, Carrupt P-A, Testa B 2000. Predicting
blood-brain barrier permeation from three-dimensional molecular structure. J Med Chem 43: 2204-2216. Cruciani G, Pastor M, Guba W 2000a. Volsurf: A new tool for
the pharmacokinetic optimization of lead compounds. Eur J Pharm Sci 11: 29-39.
Cruciani G, Pastor M, Clementi S 2000b. Handling information from 3D grid maps for QSAR studies. In Gundertofte K, Jorgensen FE. Molecular Modelling and Prediction of Bioactivity. New York: Kluwer Academic/Plenum Publishers, p. 73-82.
Cruciani G, Crivori P, Carrupt P-A, Testa B 2000c. Molecular
ields in quantitative structure-permeation relationships:
the VolSurf approach. Theochem 503: 17-30.
Da Costa FB, Terfloth L, Gasteiger J 2005. Sesquiterpene lactone-based classification of three Asteraceae tribes: a study based on self-organizing neural networks applied to chemosystematics. Phytochemistry 66: 345-353.
Demiot C, Tartas M, Fromy B, Abraham P, Saumet JL, Sigaudo-Roussel D 2006. Aldose reductase pathway inhibition
improved vascular and C-iber functions, allowing for
pressure-induced vasodilation restoration during severe diabetic neuropathy. Diabetes 66: 1478-1483.
Dewar MJS, Zoebisch EG, Healy EF, Stewart JJP 1985. Development and use of quantum mechanical molecular models. 76. AM1: a new general purpose quantum mechanical molecular model. J Am Chem Soc 107: 3902-3909.
Dewar MJS, Healy EF, Holder AJ, Yuan YCJ 1990. Comments on a comparison of AM1 with the recently developed PM3 method. J Comput Chem 11: 541-542.
Jean-Marc N 2006. Diterpene skeletal type classiication and
recognition using Self-Organization Maps. Int Eletro J Mol Design 5: 213-223.
Fernandes MB, Scotti MT, Ferreira MJP, Emerenciano VP 2008. Use of self-organizing maps and molecular descriptors to predict the cytotoxic activity of sesquiterpene lactones. Eur J Med Chem 43: 2197-2205.
Fernández M, Caballero J, Helguera AM 2005. Quantitative structure-activity relationship to predict differential
inhibition of aldose reductase by lavonoids compounds.
Bioorg Med Chem 13: 3269-3277.
Flamini G, Antognoli E, Morelli I 2001. Two lavonoids and
other compounds from the aerial parts of Centaurea bracteata from Italy. Phytochemistry 57: 559-564.
Gasteiger J, Teckentrup A, Terloth L, Spycher S 2003. Neural
networks as data mining tools in drug design. J Phys Org Chem 16: 232-245.
Greenham J, Vassiliades DD, Harborne JB, Williams CA, Eagles J, Grayer RJ, Veitch NC 2001. A distinctive favonoid chemistry for the anomalous genus Biebersteinia. Phytochemistry 56: 87-91.
Gupta S, Aires-de-Sousa J 2007. Comparing the chemical spaces of metabolites and available chemicals: models of metabolite-likeness. Mol Divers 11: 23-36.
Heim KE, Tagliaferro AR, Bobilya DJ 2002. Flavonoid antioxidants: chemistry, metabolism and structure-activity relationships, J Nut Biochem 13: 572-584. Horie T, Ohtsuru Y, Shibata K, Yamashita K, Tsukayama M,
Kawamura Y 1998. 13C NMR spectral assignment of the
A-Ring of polyoxygenated lavones. Phytochemistry 47: 865-874.
Hristozov D, Da Costa FB, Gasteiger J 2007. Sesquiterpene
lactones-based classiication of the family Asteraceae
using neural networks and k-nearest neighbours. J Chem Inform Model 47: 9-19.
Iwata K, Matsuno K, Nishinaka T, Persson C, Nishimura CY 2006. Aldose reductase inhibitors improve myocardial reperfusion injury in mice by a dual mechanism. J Pharm Sci 102: 37-46.
Jahaniani F, Ebrahimi SA, Rahbar-Roshandel N, Mahmoudian M 2005. Xanthomicrol is the main cytotoxic component of Dracocephalum kotschyii and a potential anti-cancer agent. Phytochemistry 66: 1581-1592.
Kinoshita JH 1974. Mechanisms initiating cataract formation. Invest Ophthalmol 13: 713-724.
Kador PF, Kinoshita JH, Sharpless NE 1985. Aldose reductase inhibitors: a potential new class of agents for the pharmacological control of certain diabetic complications. J Med Chem 28: 841-849.
Kastenholz MA, Pastor M, Cruciani G, Haaksma EEJ, Fox T 2000. GRID/CPCA: A new computational tool to design selective ligands. J Med Chem 43: 3033-3044.
Klopman G, Buyukbingol E 1988. An artiicıal intelligence
approach to the study of the structural moieties relevant to drug-receptor interactions in aldose reductase
inhibitors. Mol Pharm 34: 852-862.
Kohonen T 2001. Self-Organizing Maps. Berlin: Springer. Koukoulitsa C, Zika C, Geromichalos GD, Demopolus VJ,
Skaltsa H 2006. Bioorg Med Chem 14: 1653-1659. Lawrence J 1994. Introduction to neural networks design,
theory and applications. London: Sylvia Luedeking. Leach AR 2001. Molecular Modeling: Principles and
Applications. London: Prentice Hall.
Maldonado E, Ortega A 1997. Languidulane, clerodane and secoclerodane diterpenes from Salvia tonalensis. Phytochemistry 45: 1461-1464.
Mathworks Inc 2004. Available in http://www.mathworks.com access 9 Sep 2010.
Matsuda H, Morikawa T, Toguchida I, Yoshikawa M 2002.
Structural requirements of lavonoids and related
compounds for aldose reductase inhibitory activity. Chem Pharm Bull 50: 788-795.
Mercader AG, Duchowicz PR, Fernández FM, Castro EA, Bernardi D, Autino JC, Romanelli GP 2008. QSPR Prediction of inhibition of aldose reductase for
lavonoids. Bioorg Med Chem 16: 7470-7476.
Molecular Discovery 2010. Available in http://www. moldiscovery.com/index.php, access 9 Mar 2010. Molineux P 2004. The use of stable free radical
diphenylpicrylhydrazyl (DPPH) for estimating antioxidant activity. Songklanakarin J Sci Technol 26: 211-219.
Nagao T, Abe F, Kinjo J, Okabe H 2002. Antiproliferative constituents in plants 10. Flavones from the leaves of Lantana montevidensis BRIQ and consideration of structure-activity relationship. Biol Pharm Bull 25: 875-879.
Okuda J, Miwa I, Inagaki K, Horie T, Nakayama M 1984. Inhibition of aldose reductase by 3',4'-dihydroxyflavones. Chem Pharm Bull 32: 767-772. Pierce TH, Hohne BA 1985. Artiicıal Intelligence Aplication in
Chemistry. Washington DC: ACS Ed.
Prabhakar YS, Gupta MK, Roy N, Venkateswarlu Y 2006. A high dimensional QSAR study on the aldose reductase
inhibitory activity of some lavones: topological
descriptors in modeling the activity. J Chem Inf Model 46: 86-92.
Stafford HA 1991. Flavonoid evolution: an enzymic approach. Plant Physiol 96: 680-685.
Sun W, Oates PJ, Coutcher JB, Gerhardinger C, Lorenzi M 2006. A selective aldose reductase inhibitor of a new structural class prevents or reverses early retinal abnormalities in experimental diabetic retinopathy. Diabetes 55: 2757-2762.
Tripos Inc 2010. Available in http://tripos.com/, access 9 Mar 2010.
Varma SD 1986. Inhibition of aldose reductase by lavonoids:
possible attenuation of diabetic complications. Prog in Clin and Biolog Res 213: 343-358.
Toolbox for Matlab 5. Available in http://www.cis.hut.
i/projects/somtoolbox, access 9 Sep 2010.
Yamashita F, Hashida M 2004. In silico approaches for predicting ADME properties of drugs. Drug Metab Pharmacokin 10: 327-338.
Youssef D, Frahm AW 1995. Constituents of the Egyptian Gentaurea scoparia; III. Phenolic constituents of the aerial parts. Planta Med 61: 570-573.
Wagner S, Hofmann A, Siedle B, Terloth L, Merfort I,
Gasteiger J 2006. Development of a structural model for NF-kappaB inhibition of sesquiterpene lactones using self-organizing neutral networks. J Med Chem 49: 2241-2252.
Wavefunction Inc 2010. Available in http://www.wavefun.com/ products/spartan.html, access 9 Mar 2010.
Wold S, Esbensen K, Geladi P 1987. Principal component analysis. Chemom Intell Lab Syst 2: 37-52.
World Health Organization 2000. Diabetes (Fact Sheet, nº 164). Available in http://www.who.int/mediacentre/ factsheets/fs164/en/, accesss 9 Sep 2010.
Zhang Q-Y, Aires-de-Souza J 2005. Structure-based
classiication of chemical reactions without assignment
of reaction centers. J Chem Inform Model 45: 1775-1783.
*Correspondence
Marcus T. Scotti
Centro de Ciências Aplicadas e Educação, Universidade Federal da Paraíba, Campus IV, Rua da Mangueira s/n, 58297-000 Rio Tinto-PB, Brazil