Abstract
The data traffic in wireless networks for the third generation (3G) mobile telecommunication systems should take into account a variety of services (voice, data, video) and environments (e.g.: private, outdoors, indoors) as well as the user mobility behavior. A good evaluation of measures of performance can help a sys-tem designer to make its strategic decisions concern-ing cell size and the number of channel frequencies allocated to each cell. In this paper we present an analysis of data services in a third generation mobile telecommunication networks based on simulation. In addition, we illustrate the need for a simulation in or-der to characterize the mix of several traffic types for capacity and quality of service (QoS) planning. We use the distributions heavy tailed Weibull and Pareto to simulate respectively, the data traffic and the re-source occupation time for data service. Finally, we also comment some simulation results of third gener-ation services where we analyze the QoS parameters of a mobile network, such as channel occupation time, handoff, new call blocking probabilities and traffic in Erlangs.
Keywords— Mobile Networks, Data Services, Third
Generation, Quality of Service
1. Introduction
One of the driving forces of the next generation of wireless communication and computing networks is the promise of high-speed multimedia services. The
next generation wireless mobile networks, known as third generation (3G) mobile telecommunication sys-tems, should take into account a variety of services (voice, data, video) and environments (e.g.: private, outdoors, indoors) as well as the user mobility behav-ior. The great difference between the next and the cur-rent networks is their ability to provide higher-rate data service, which are expected to fuel a mobile device of new application. Third generation systems, such as Future Public Land Mobile Telecommunication Sys-tem (FPLMTS or IMT-2000) and the Universal Mobile Telecommunication System (UMTS), promise to pro-vide multimedia services to mobile and fixed users via wireless access to the global telecommunication in-frastructure [25, 27, 32]. The UMTS idea is to enable Mobile Users (MUs) to access differentiated services
of’anywhere’, and’anytime’, using a single
telecom-munication device.
The evolution of cellular mobile networks, pushed by a rapidly increasing number of subscribers, began in the field of telephony. Nevertheless, the evolution of mobile networks also followed a second path: the packet radio networks for mobile data communication. These networks provide packet oriented data transfer to and from a mobile station. In addition to the inte-gration of speech and data services, the ongoing net-work evolution progress is directed towards personal communications and mobility. Building integrated ser-vices mobile networks can be realized either by im-proving the service profile offered by existing cellular systems, or by adding air interfaces to existing wired networks.
Traffic modeling in wireless telecommunication
in Third Generation Mobile
Telecommunication Networks
Aloizio P. Silva, Geraldo R. Mateus
Federal University of Minas Gerais Department of Computer Science
Av. Antônio Carlos, 66-31270-010 - Pampulha - BH - MG - Brazil {aloizio, mateus}@dcc.ufmg.br
Keywords — Mobile Networks, Data Services, Third
system has to deal with two main issues, the Ra-dio Resource Management (RRM) scheme and the ef-fect of the user mobility on the traffic volume per cell [14, 22, 34]. Data traffic in wireless telecom-munication networks is emerging like one of aspects more important in third generation networks plan-ning [13, 16, 33, 35]. Thus a mix of several traffic types of different services has required more resources and QoS planning. Therefore, from the telecommuni-cations point of view we can model the different traffic types like voice and data based on their behaviour.
Wireless data applications produce data that may have different characteristics from those of wired data applications and wireless voice data [18]. This arti-cle describes the simulation results of data service in mobile (cellular) telecommnunication networks, using the simulator named ’Simula2’ [29, 30, 31], which take into account the self-similarity [5, 21, 26] of the network traffic. We use the distributions heavy tailed Weibull and Pareto [17] to simulate the data traffic and the resource occupation time for data service, respec-tively. The simulation provides simple analytical re-sults regarding the traffic of different services and also provides means to estimate the following parameters:
¯ telecommunication traffic volume,
¯ telecommunication traffic intensity,
¯ handoff blocking probability,
¯ call blocking probability, and
¯ channel occupation time.
When a MU wants to communicate with another MU, it must first obtain a channel from one of the base stations that hears depending on signal power. If a channel is available, it is assigned to the user. In the case that all the channels are busy, the new call is blocked. This kind of blocking is called new call blocking and it refers to blocking of new calls. On the other hand, the procedure of moving from one cell to another, while a call is in progress, is called hand-off. While performing handoff, the MU requires that the base station of the destination cell will allocate it a channel. If no channel is available in the new cell, the handoff call is blocked. This kind of blocking is called handoff blocking and it refers to blocking of ongoing
The paper is organized as follows. In Section 2, the simulation organization and simulator characteristics are described. Section 3 reports the data traffic modeling used in the simulator. Simulation results and implications on QoS planning are given in Section 4. Finally, the conclusions and future directions, towards to the third generation systems are presented in Section 5.
calls due to the mobility of the users [33]. Basically, the new call and handoff blocking probabilities is that allow to determine the Quality of Service (QoS) in cel-lular networks.
In addition, the traffic volume and intensity, and channel occupation time are also parameters that will allow to evaluate the system behavior and the resource utility. The time interval that a call is keeping busy a channel or a set of them is called channel occupa-tion time. Then the traffic volume may be defined as the sum of the channel occupation time. The traffic intensity is a measure of the average occupancy of a channel during a specified period of time, normally a busy hour, measured in traffic units (Erlangs1). This is a dimensionless quantity and may be used to measured the time utilization of single or multiple channels. The results are obtained by assuming that voice and data service are available, while user moves.
2. Simulation Organization
We used the Manhattan Model [4, 23] that perfectly serves ours needs, and because of its simplicity, allows us to track hundreds of thousands of MUs. The square grid has 12.8 Km sides. The streets are spaced every 128 meters, and are numbered 0, 1, 2,...N, with each one accepting traffic in both directions. Speed of the MUs is controlled independently for the inner and the outer strees, typical values being 30 and 50 Km/h re-spectively. All cells have the same area, are circular and spread having minimum overlapping areas. The program allows us to define several areas within the city, which we callregions of interest. For implemen-tation purposes we have limited these areas in:
¯ Traffic
¯ Residential 1
Erlang or Erl corresponds to measured unit that determine the occupation rate of a channel, for example: to use a channel of 1 Erl means that the channel is been used in its maximum capacity all the time.
¯ Business
¯ Shopping
¯ Park/Lake
The information entered can then be stored, allow-ing us to have several different templates for simula-tion purposes. Hence it is possible in the simulator to create as many MU categories as needed, and divide the whole population among the categories such as to reflect a real situation.
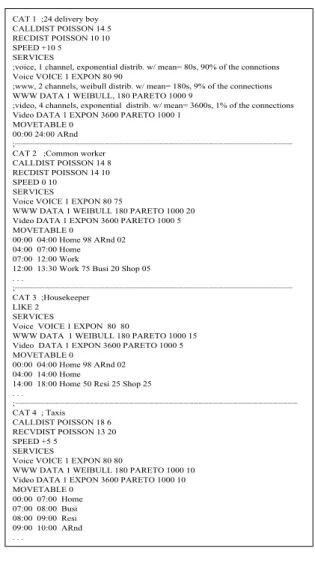
When the MUs are created within a simulation, the program randomly assigns one Home location and one Work location for each MU. We can also built timetable to schedule the MU’s activities, which are used for traffic simulation. These timetables are de-fined using a simple ASCII editor. A typical example is shown on Figure 1.
In the Figure 1, we have 4 categories of MUs. The originating and the receiving call distributions can be defined by the words CALLDIST and RECDIST re-spectively. For each category we can also define differ-ent services and its connection average. These services can be voice, data or video. Each service has different requiring of bandwidth. To determine the bandwidth that will be used by each service, a different channel amount for each one has been allocated (i.e., two chan-nel to WWW service and four chanchan-nel to video ser-vice). To determine the traffic volume over the area under study, we define that:
¯ On voice service the call arrival process is as-sumed to be Poissonian while the call duration is exponentially distributed.
¯ On data service the call arrival process is assumed to be Pareto while the call duration follow the heavy tailed Weibull distribution.
¯ On video service the call arrival process is as-sumed to be Pareto while the call duration is ex-ponentially distributed.
The simulator can also write a ASCII text file in disc. Figure 2 shows a example file.
We define in our simulator five types of events that can be processed by event manager as shown in Ta-ble 1.
CAT 1 ;24 delivery boy CALLDIST POISSON 14 5 RECDIST POISSON 10 10 SPEED +10 5 SERVICES
Voice VOICE 1 EXPON 80 90
WWW DATA 1 WEIBULL, 180 PARETO 1000 9
;www, 2 channels, weibull distrib. w/ mean= 180s, 9% of the connections
Video DATA 1 EXPON 3600 PARETO 1000 1
;video, 4 channels, exponential distrib. w/ mean= 3600s, 1% of the connections
MOVETABLE 0 00:00 24:00 ARnd
;−−−−−−−−−−−−−−−−−−−−−−−−−−−−−−−−−−−−−−−−−−−−−−−−−−−−−−−− CAT 2 ;Common worker
CALLDIST POISSON 14 8 RECDIST POISSON 14 10 SPEED 0 10
SERVICES
Voice VOICE 1 EXPON 80 75
;voice, 1 channel, exponential distrib. w/ mean= 80s, 90% of the connctions
WWW DATA 1 WEIBULL 180 PARETO 1000 20 Video DATA 1 EXPON 3600 PARETO 1000 5 MOVETABLE 0
00:00 04:00 Home 98 ARnd 02 04:00 07:00 Home 07:00 12:00 Work
12:00 13:30 Work 75 Busi 20 Shop 05 . . .
;−−−−−−−−−−−−−−−−−−−−−−−−−−−−−−−−−−−−−−−−−−−−−−−−−−−−−−−− CAT 3 ;Housekeeper
LIKE 2 SERVICES
Voice VOICE 1 EXPON 80 80
WWW DATA 1 WEIBULL 180 PARETO 1000 15 Video DATA 1 EXPON 3600 PARETO 1000 5 MOVETABLE 0
00:00 04:00 Home 98 ARnd 02 04:00 14:00 Home
14:00 18:00 Home 50 Resi 25 Shop 25 . . .
;−−−−−−−−−−−−−−−−−−−−−−−−−−−−−−−−−−−−−−−−−−−−−−−−−−−−−−−−− CAT 4 ; Taxis
CALLDIST POISSON 18 6 RECVDIST POISSON 13 20 SPEED +5 5
SERVICES
Voice VOICE 1 EXPON 80 80
WWW DATA 1 WEIBULL 180 PARETO 1000 10 Video DATA 1 EXPON 3600 PARETO 1000 10 MOVETABLE 0
00:00 07:00 Home 07:00 08:00 Busi
09:00 10:00 ARnd 08:00 09:00 Resi
. . .
Figure 1. Timetable with location probability distribution given for 4 different MU cate-gories
To handle the handoff request we used the Priority II model, defined in [15], that considers handoff queue. In [20, 21] and in numerous other studies [5, 7, 8] net-work packet traffic appears “similar” when measured over a wide range of time scales. That is, the network traffic looks the same when measured over time in-tervals ranging [10]. Data traffic of this type is said to be self-similar or fractalin nature [20, 21]. Self-similar traffic is very different from both conventional telephone traffic and from the currently accepted norm for model of packet traffic.
esti-RECV 476 3 8:02:59 22 2 Voice [1] 1 HANG 185 2 8:03:01 48 3 535 535 2 0 1 CALL 986 2 8:03:02 41 1 WWW [2 3] 2 CALL 504 3 8:03:02 54 3 Voice [1] 2 HANG 414 3 8:03:04 67 4 186 0 0 1 RECV 461 2 8:03:04 55 3 Voice [1] 3 HANG 853 2 8:03:11 41 1 17 17 0 0 3 RECV 881 2 8:03:26 66 4 Voice [1] 1 RECV 126 4 8:03:30 41 1 Voice [1] 5 HANG 126 4 8:03:33 41 1 3 3 0 0 5 RECV 890 2 8:03:37 16 1 Voice [1] 3 CALL 423 2 8:03:38 48 3 Video [1 2 3 4] 2
Figure 2.Simulation log file of acess to the 3G services.
mated from the variance of a statistical process. Self-similarity is implied if . We used one graphical method to test the self-similarity of the traf-fic: variance-time plot [1, 21].
Event Description
MOVE The MU must physically move within the city area.
RECV The MU receives a call. CALL The MU originates a call.
HANG The call received or originated by an MU termi-nates.
HOFF The system must process handoff for a specific MU from one cell to another.
Table 1. Events table
For the variance-time plot, the process is self-similar if the estimated asymptotic slope
is between
and. The Hurst parameter can then be estimated as
. We estimated the H value for one cell sample. The asymptotic slope estimated is aprox-imately , resulting in an estimate
of
the Hurst parameter. This method suggests that the traffic sequence is self-similar.
The self-similar process has been constructed by superimposing several processes on/off2, where times between arrivals has a heavy tailed distribution It has influenced the blocking rate. So the process of Pois-son used to model the arrival of voice service requests started by users, was not the same to the arrival of
2The periodsoncorrespond to the periods of transmission of
web files and the periodsoffcorrespond to the periods where the server is not receiving data.
web documents in a server. Since the transmissions of WWW and video documents are not completely started by user. For instance, a web page often con-tains several images and when user demands one of these pages the browser automaticaly generates a lot of additional requests to read these images. Therefore the blocking rates of WWW and video services were bigger than voice service due to the used model, which allows to simulate another additional request needed to provide these type of services. Power-tails distribu-tions have been used to model network traffic behav-ior [12].
3. Data Traffic Modeling
Intuitively, we consider heavy-tailed distributions as models for possibly large values in a sample. Such models have been taken as basis for more sophisti-cated models in teletraffic data transmission [11, 28]. In certain applications, in particular in queueing the-ory, more structure for the distribution tail is needed. The Pareto distribution is characterized by a linearly increasing mean excess function. In addition, it has finite mean, infinite variance, and it has been used to model traffic having fractal characteristics [26].
The data traffic from the wireless network is mod-eled by Pareto distribution, where the traffic is gen-erated by use of distribution inverse function. Like WAP (Wireless Application Protocol) data service has quickly developed [19], we have obtained from a wire-less carrier of this service the average data traffic in the network. In this case, the average data traffic has been used in the simulation is 1.52kbps.
Heavy-tailed service times, has been researched in [3, 11]. Specifically, in [3] has been proved that when the service time is lighter than the tail of a Weibull distribution with parameter, the num-ber of arriving customers comes into the picture as well. Then the combination of the number of cus-tomers and the likely large service time the queue-length large.
occupation time with average of 2.52 minute ( 180 seconds).
The following subsection describes how the shape parameters were calculated for both Pareto and Weibull distributions.
3.1. Calculating Shape Parmeter of Pareto Distri-bution
There are in the literature a lot of methods that al-low to estimate the parameter value. Specifically, we used the Method of Moments, because this method does not need of an initial sample set. The sample av-erage is defined as follows:
(1)
Therefore, we can calculate.
(2)
3.2. Calculating Shape Parmeter of Weibull Distri-bution
The method of sucessive projection has been used to determine parametersandof the Weibull distri-bution. This method can be considered as a generaliza-tion, described in [2] [24][6] [9]. Theandvalues are obtained by the plans intersection in
, such that these values are greater than zero. The equations 3 and 4 represent the mean and the variance of Weibull distribution, respectively .
½ ¬ (3) ¾ ¬ ℄ (4)
This allows us to create a system as showed in Equation 5. ½ ¬ ¾ ¬ ℄ (5)
The Equations 6 and 7 can be determined applying logarithm properties. (6) ¬ ¾ ¾ ¾ ¬ ¾ ½ ¬ ℄℄ (7)
In this case, we know the mean, that is, the aver-age occupation time for data service. By expanding 6, we have 8):
(8)
The Equation 8 can be divided in two function, whereis convex andis concave. They can be computed by 9 and 10.
(9)
(10)
Therefore, we can writeas shown in Equa-tion 11.
(11)
The following hypothesis are necessary to deter-minee.
convex
concave
Thus a linear approximation ofin can
be made. We refer
. Then, we have a linear
approximationin
. Applying sucessive projec-tion and making the intersecprojec-tion of two hyperplans we can determinee. Finally, the data service average occupation time can be generated.
4. Simulation Results
The simulation tool model both the traffic and mo-bility behaviour of users offering amo-bility to consider different service types and different MU categories. Morever, it allows to estimate the blocking propabil-ity and the radio resource utilization. In particular:
Voice and dada service are available anywhere.
New calls and handoffs are differently treated.
We consider 162 channel per cell. This allows us to create a system as showed in Equation
5. Where M = x is the mean and the d2=
~
S2 is the variance.~
~
¯ The Simulation time is 24h.
¯ The Timeout to handoff queue is 2 seconds.
¯ The increase of the signal power occurs to 50 me-ters of cell’s boundary.
¯ The Mean call from the originating and receiving rate for categories 1, 2 and 3 is 0.9 calls/hour/MU.
¯ The Mean call originating and receiving rate for category 4 is 1.7 calls/hours/MU
¯ See Table 2 for the distribution of MUs among categories. The mobility parameter in the third column gives the time percentage that MU moves into the simulator period.
¯ The Mean duration for voice service is 120 sec-onds, for data service is 180 secsec-onds, and for video service is 3600 seconds.
¯ The MU speed varies between 30 and 50 km/h
We use 162 channels per cell, a parameter used by the American D-AMPS (Digital Advanced Mobile Phone System) or TDMA IS-543, which was
standard-ized by FCC (Federal Communications Commission). The bands of 25MHz are divided into channels of 30 KHz, that give us 416 duplex channels, with 21 for control. We apply a reuse factor of 7, for the 395 remainder, then we have 56 channels per cell. There are 3 time slots per carrier, that gives a service capac-ity of 168 channels or user per cell. Depending on the interference between channels, for example, this number can be decreased (54 x 3 = 162). In the case of GSM (Global System for Mobile Communications) we could consider until 192 channels per cell (3 sec-tors, 8 carriers per sector, 8 slots per carrier).
Category % of UMs Mobility (%) Description
1 18.2 90 24h delivery boy 2 35.3 50 Common worker 3 26.3 30 Housekeeper 4 20.2 60 Taxis
Table 2. Categories and the MUs distribution
3Time Division Multiple Access was first specified as a
stan-dard in EIA/TIA (Electronic Industries Association) Interim Stan-dard 54 (IS-54).
20 22 24 26 28 30 32 34 36 38 40 42 44 46 48 50 52 54 56 58 60 62 64 66 68 70
0 200000 400000 600000 800000
Channel occupation time (%)
Number of MUs
Ch= 0 Ch= 5 Ch= 10 Ch= 15
Figure 3. Channel occupation time in 3G telecommunication networks per number of MUs per cell (30/50km/h)
Figure 3 shows the influence of the number of MU in the effective channel occupation time with differ-ent variations of reserved channels to the handoff pro-cedure. We see that when the number of MUs is in-creased, this will mean that more calls being held by each cell, leading to a better channel occupancy. Rel-atively, we can also note that a variation on number of reserved channels to handoff does not interfere in the channel occupation time.
0 0.2 0.4 0.6 0.8 1 1.2 1.4 1.6 1.8 2
0 200000 400000 600000 800000
New call bloking probability (%)
Number of MUs
Ch= 0 Ch= 5 Ch= 10 Ch= 15
Figure 4. New call blocking probability in 3G telecommunication networks per number of MUs per cell(30/50 Km/h)
ca-pacity. In practice, this value should not exceed 2% for new calls. In Figure 4 we observe that when the number of channels to handoff is increased, the new call blocking probability also raises. If we compare the new call blocking probability between 3G and cur-rent telecomunication networks, we could note a high blocking probability in 3G network. This happens be-cause the same channels of current networks are used in 3G networks to move beyond of voice service, the video and data services. This implies in a larger con-sumption of resources.
Specifically, there is a reduction in the number of channels available to answer new calls in the system in such way to attend the requests of handoff. If we consider that the number of MU has a tendency to re-main either constant or increase, the new call blocking will increase. On the other hand the MUs can perform more handoff, but also the QoS of the network is dam-aged.
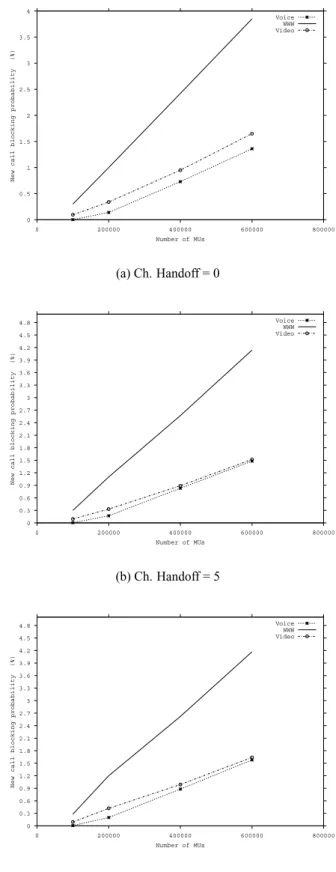
Figure 5 shows a new call blocking probability per service (voice, video, WWW), changing the number of reserved channels to handoff. We can note that the WWW and video services blocking rates are greater than voice service blocking rate when the number of reserved channels to handoff increases. This result may be explained by the fact that video connection requires a larger amount of resources to maintain the minimum QoS and the connection percentage is small. On the other hand, for the WWW service, the amount of the resource necessary is smaller than the video re-sources, but the connection percentage is bigger.
Besides that, the 162 available channels to meet the demand of new calls are decreased in the same amount of with the reserved channels to handoff. In addition, the low blocking probability of voice service may be explained by the fact that this service uses only one channel for each connection.
The simulator mobility model tries to control a blocking probability per cell around 1%. Consider-ing different number of reserved channels to handoff call, Figure 6 indicates that as the number of MUs in-creases and the number of reserved channels to hand-off decreases, the handhand-off blocking probability also in-creases. We can also note that the handoff blocking probability in 3G network tends to 0 when the number of reserved channels to handoff procedure are greater or equal 5. In this case, the superimposition of curves
0 0.5 1 1.5 2 2.5 3 3.5 4
0 200000 400000 600000 800000
New call blocking probability (%)
Number of MUs
Voice WWW Video
(a) Ch. Handoff = 0
0 0.3 0.6 0.9 1.2 1.5 1.8 2.1 2.4 2.7 3 3.3 3.6 3.9 4.2 4.5 4.8
0 200000 400000 600000 800000
New call blocking probability (%)
Number of MUs
Voice WWW Video
(b) Ch. Handoff = 5
0 0.3 0.6 0.9 1.2 1.5 1.8 2.1 2.4 2.7 3 3.3 3.6 3.9 4.2 4.5 4.8
0 200000 400000 600000 800000
New call blocking probability (%)
Number of MUs
Voice WWW Video
(c) Ch. Handoff = 10
−0.05 0 0.05 0.1 0.15 0.2 0.25 0.3 0.35 0.4
0 200000 400000 600000 800000
Handoff blocking probability (%)
Number of MUs
Ch= 0 Ch= 5 Ch= 10 Ch= 15
Figure 6. Handoff blocking probability in 3G telecommunication networks per number of MUs per cell (30/50 Km/h)
occurs as depicted in Figure 6.
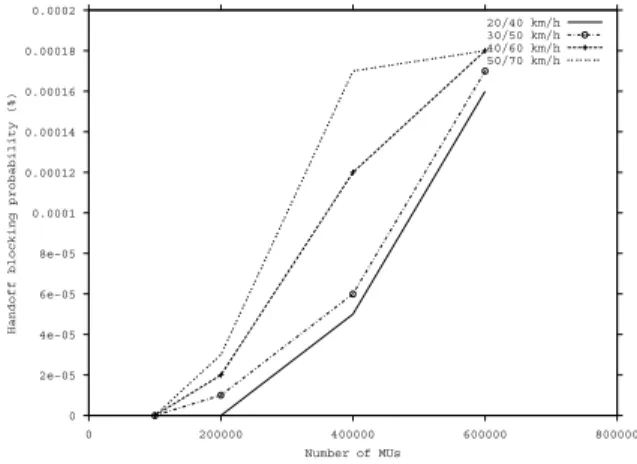
In Figure 7, we analyze the variation of MUs speed fixing the number of channels to handoff equal 5. We can note how the MU mobility degree, might influ-ence in the quality of service of the network. We ob-serve that as the MU’s speed and the number of MUs increases towards high values, the handoff blocking probability raises.
0 2e−05 4e−05 6e−05 8e−05 0.0001 0.00012 0.00014 0.00016 0.00018 0.0002
0 200000 400000 600000 800000
Handoff blocking probability (%)
Number of MUs
20/40 km/h 30/50 km/h 40/60 km/h 50/70 km/h
Figure 7. Handoff blocking probability in 3G telecommunication networks per number of MUs per cell changing MU’s speed
Figure 8 shows the handoff blocking probability in 3G network per service with MU speed between 30
and 50 Km/h, changing the reserved channels to hand-off. When the number of reserved channels to handoff is increased, the blocking probability reduces. In this case, the number of MUs must remain unchanged.
We also see that both voice and WWW service blocking probability tends to 0 for handoff channels greater or equal 10. While the video service block-ing probability tends to¾¼½¼
, so it require larger amount of resources, in agreement with established criteria in the simulation.
We also note that rising the number of handoff chan-nels, the carried traffic tends to decrease. This result can be explained by the fact that the number of chan-nels to serve new call is decreased, while we increase the number of reserved channels to handoff.
If we vary the MUs speed and fix the number of available handoff channels in 5, then we observe that, independent of MU speed, the carried traffic (in Er-langs) keep unchanged.
Specifically, when we increase the number of MU at system the carried traffic varies clearly. On the other hand, a increasing in the number of available channels to handoff procedure, causes a reduction in the number of available channels to new call, but also there is a reduction of the performed handoff number. In this case the traffic volume remains stable, but also there is no guarantee of quality to users demanding access to services.
Figure 9 shows the carried traffic (in Erlangs) per cell. In this case, we vary the number of reserved chan-nels to handoff procedure. We can note that rising the number of handoff channels, the carried traffic tends to decrease. This result can be explained by the fact that the number of channels to serve new calls are reduced, while we increase the number of reserved channels to handoff.
If we vary the MUs speed as is showed in Figure 5 and fix the number of available handoff channels in 5, then we observe that, independent of MU speed, the carried traffic (in Erlangs) keep unchanged as we can note by the superimposition of the curves.
0 0.02 0.04 0.06 0.08 0.1 0.12 0.14 0.16 0.18 0.2 0.22 0.24 0.26 0.28 0.3 0.32 0.34 0.36 0.38 0.4
0 200000 400000 600000 800000
Handoff blocking probability (%)
Number of MUs
Voice WWW Video
(a) Ch. Handoff = 0
0 4e−05 8e−05 0.00012 0.00016 0.0002 0.00024 0.00028 0.00032 0.00036 0.0004
0 200000 400000 600000 800000
Handoff blocking probability (%)
Number of MUs
Voice WWW Video
(b) Ch. Handoff = 5
−1e−05 0 1e−05 2e−05 3e−05 4e−05
0 200000 400000 600000 800000
Handoff blocking probability (%)
Number of MUs
Voice WWW Video
(c) Ch. Handoff = 10
Figure 8. Handoff blocking probability to 3G mobile telecommunication network per ser-vice per cell (30/50 Km/h)
0 5 10 15 20 25 30 35 40 45 50 55 60 65 70 75 80 85 90 95 100 105 110 115 120
0 200000 400000 600000 800000
Carried traffic (Erlangs)
Number of MUs
Ch= 0 Ch= 5 Ch= 10 Ch= 15
Figure 9. Carried traffic (in Erlangs) per cell to mobile telecommunication networks (30/50 Km/h)
case the traffic volume remains stable, but also there is no guarantee of quality to users who are demanding access to the services.
0 10 20 30 40 50 60 70 80 90 100 110 120 130
0 200000 400000 600000 800000
Carried traffic (Erlangs)
Number of MUs
20/40 km/h 30/50 km/h 40/60 km/h 50/70 km/h
Figure 10. Carried traffic (in Erlangs) per cell to mobile telecommunication networks for different MUs speeds
Figure 11 shows the carried traffic (in Erlangs) to 3G networks per category of MU with inner/outer
0 5 10 15 20 25 30 35 40
0 200000 400000 600000 800000
Carried traffic (Erlangs)
Number of MUs
24h delivery boy Common worker Housekeeper Taxis
(a) Ch. Handoff = 0
0 5 10 15 20 25 30 35 40
0 200000 400000 600000 800000
Carried traffic (Erlangs)
Number of MUs
24h delivery boy Common worker Housekeeper Taxis
(b) Ch. Handoff = 5
Figure 11. Carried traffic (in Erlangs) per cat-egory per cell to mobile telecommunication networks
We can still verify that the category 2 (common worker) tends to have a larger traffic, that is delineated by the large number of connection performed to the 3G services for this type of user. This implicates in a rising on channel occupation time, generating a rise in the traffic volume of network.
We observe that carried traffic in the network does not depend on available channels to handoff. We still note that the tendency is that the voice service traffic is bigger than the video and WWW services traffic. This happens because a large number of requests is generated by voice services. These requests can use
any of the 162 channels for a generated new call, they can decrease when we increase the number of reserved channels to handoff. In this case, the new call block-ing probability increases, reducblock-ing the traffic volume in the network. This traffic volume depend on chan-nel occupation time, what imply in a reduction of the carried traffic.
5. Conclusions
In this paper we have presented a performance anal-ysis of third generation mobile telecommunication net-works, using a simulator. We have considered some parameters, such as new call and handoff blocking probability, carried traffic (in Erlangs), and channel occupation time that make possible evaluate the QoS of mobile networks. Traffic analysis for future mo-bile systems should take into account a variety of ser-vices (voice, data, video) and environments (e.g.: pri-vate, outdoors, indoors) as well as the user mobility behavior. The simulator presented in this paper in-corporates all the above mentioned features, besides it considers the self-similar network traffic (in this case we have used the heavy tailed distribution to simulate self-similarity of data traffic). In the case of the voice service: the call duration has been exponentially dis-tributed and the arrival process of new calls have been Poissonian.
These results clearly show that the mobility directly influences in the network quality of service and that the different available types of services depend on other is-sues as carried traffic, bandwidth, etc. These features are essential part of mobile communication system de-sign. Each type of traffic has different characteristics. Then, the capacity planning becomes a hard task with a variety of data applications, such as Internet access, email, file transfer, and with a variety of data rates and mix of traffic. Hence, in 3G network planning is cru-cial to use capacity planning techniques which give ac-curate results, because it directly affects the number of cells required to serve a given area. The simulation is one of the aspects that make possible the wireless provider to prepare for 3G wireless networks.
the simulator to consider QoS constraints and channels dynamic allocation tecniques.
[15] D. Hong and S. S. Rappaport. Traffic model and per-formance analysis for celular mobile radio telephone systems with prioritized and nonprioritizied handoff
procedures. InIEEE Transaction on Vehicular
Tech-nology, volume 35, pages 77–92, August 1986. [16] B. Jabbari. Teletraffic aspects of evolving and next
generation wireless communication networks. In
IEEE Transactions on Vehicular Technology, vol-ume 3, pages 4–9. December 1996.
[17] R. Jain. The Art of Computer Systems Performance
analysis, techniques for Experimental Design, Mea-surement, Simulation, and Modeling. John Wiley & Sons, INC, 1991.
[18] M. Jiang, M. Nikolic, S. Hardy, and L. Trajkovic. Im-pact of self-similarity on wireless data network
per-formance. InIEEE International Conference on
Com-munications, June 2001.
[19] T. Kunz, T. Barry, J. P. Black, and H. M. Mahoney. WAP traffic: Description and comparison to WWW
traffic. In3rd ACM International Workshop on
Mod-eling Analysis and Simulation of Wireless and Mobile Systems, August 2000.
[20] W. E. Leland, M. S. Taqqu, W. Willinger, and D. V. Wilson. On the self-similar nature of ethernet
traf-fic. ACM Sigcomm Computer Communications
Re-view, 23:183–193, 1993.
[21] W. E. Leland, M. S. Taqqu, W. Willinger, and D. V. Wilson. On the self-similar nature of ethernet
(ex-tended version). IEEE/ACM transactions on
Net-working, 2(1):1–15, February 1994.
[22] J. G. Markoulidakis, G. L. Lyberopoulos, and M. E. Anagnostou. Traffic model for third generation
cel-lular mobile telecommunication systems. InWireless
Networks, pages 389–400. 1998.
[23] M. Middendorf. Manhattan channel routing is
NP-complete under truly restricted settings. Chigago
Journal of Theorical Computer Science, 2:1–19,
1996.
[24] T. S. Motskin and I. I. Schoenberg. The relation
method for linear inequalities. InCan. J. Math, vol-ume 6, pages 393–404. 1954.
References
[1] G. Abdula and et al. Shared user behaivor on
the word wide web. http://www.cs.vt.edu/
chi-tra/docs/97webnet, 1997.
[2] S. Agmon. The relaxation method for linear inequali-ties. InCan. J. Math, volume 6, pages 382–392. 1954. [3] S. Asmussen, C. Kluppelberg, and K. Sigman. Sam-pling at subexponential times, with queueing applica-tions, 1999. Stoch. Proc. Appl.
[4] A. Bar-Noy and L. Kessler. Tracking mobile users
in wireless networks. In IEEE Trans. On
Informa-tion Theory, volume 39, pages 1877–1886, November 1993.
[5] J. Beran, R. Sherman, M. S. Taqqu, and W.
Will-inger. Long-range dependence in variable-bit-rate
traffic.IEEE Transactions on Communications, 1995. [6] L. M. Breg. Finding the common point of convex sets by the method of sucessive projections. InDokl. Akad. Mousk SSSR, pages 487–490. 1965.
[7] M. E. Crovella and A. Bestavros. Self-similarity in world wide web traffic: Evidence and possible causes. InProceedings of SIGMETRICS Conference on Mea-surement and Modeling of Computer Systems, 1996. [8] D. E. Duffy, A. A. McIntosh, M. Rosenstein, and
W. Willinger. Statistical analysis of CCSN/SS7 traffic data from working subnetworks.IEEE J. Select Areas Commun, 1(3):544–551, 1994.
[9] I. I. Eremin. Generalization of the Motzkin - Agmon
relaxational method. InUsp Math. Monk 20, pages
182–187. 1965.
[10] A. Erramilli, O. Narayan, and W. Willinger. Experi-mental queueing, analysis with long-range dependent
pocket traffic. IEEE/ACM Trans. Networking, 4(2),
1996.
[11] M. Greiner, M. Jobmann, and C. Kluppelberg. Telecommunication traffic, queueing models, and subexponential distributions. Advances in Computa-cional Mathematics, 1999. Departament of Computer Science, Munich University of Technology.
[12] M. Greiner, M. Jobmann, and L. Lipsky. The impor-tance of power-tail distributions for telecommunica-tions traffic models. Technical report, Institute f¨ur In-formatik, Technische Universit¨at Munchen, 1995. [13] R. Guri. Channel occupancy time distribution in a
cel-lular radio system. InIEEE transactions on Vehicular Technology, volume 36, pages 89–99. August 1987. [14] D. Hong and S. S. Rappaport. Traffic model and
per-formance analysis for cellular mobile radio telephone systems with prioritized and nonprioritized handoff
procedure. InIEEE transactions on Vehicular
Tech-nology, volume 35, pages 77–92. August 1986.
[25] R. Pandya, D. Grillo, and P. Mieybegue. IMT-2000
standards: Network aspects. InIEEE Personal
Com-munications, pages 20–29. August 1997.
[26] P. Ramakrishnan. Self-similar traffic model. Techni-cal Report CSHCN T.R.99-5 (ISR T.R. 99-12), Center for Satellite and Hybrid Communication Networks, 1997. www.isr.umd.edu/CSHCN/.
[27] J. Rapeli. UMTS: Targets, system concept, and
stan-dardisation in a global framework. InIEEE
commu-nications, pages 20–28, February 1995.
g y
[28] S. I. Resnick. Heavy tail modeling in teletraffic data. InAnn. Statist., number 25, pages 1805–1848. 1997. [29] M. N. Rocha, G. R. Mateus, and S. L. Silva. A
com-parison between location updates and location area paging for mobile unit tracking simulation in
wire-less communication systems. InThe 3rd Int.
Work-shop on Discrete Algorithms and Methods for Mobile Computing and Communications (DialM-99), pages 72–77, Seattle, WA, August 1999.
[30] M. N. Rocha, G. R. Mateus, and S. L. Silva. Simu-lation of mobile unit tracking simuSimu-lation in wireless
communication systems. InWireless Personal
Mul-timedia Communications (WPMC’99) Conference,
Amsterdam, The Netherlands, September 1999. [31] M. N. Rocha, G. R. Mateus, and S. L. Silva. Traffic
simulation and the location of mobile units in wireless
communication systems. In17th Brazilian Computer
Networks Symposium, pages 405–417, May 1999. [32] A. Samnkic. UMTS universal mobile
telecommuni-cations system: Development of standard for the third
generation communications. InIEEE Transactions on
Veicular Technology, volume 47, pages 1099–1104. November 1998.
[33] M. Sidi and D. Starobinski. New call blocking ver-sus handoff blocking in cellular networks. InWireless Networks, volume 3, page 1 27. February 1997. [34] A. P. Silva and G. R. Mateus. Performance analysis
for data service in third generation mobile
telecom-munication networks. InAdvanced Simulation
Tech-nologies Conference 2002 - 36th Annual Simulation Symposium, pages 227–235. IEEE and Computer So-ciety, April 2002.
[35] X. Zhou. Cellular data traffic: Analysis, models,