Soft Capacity Modeling for WCDMA
Radio Resource Management
Bing Cao, Student Member, IEEE, and Teresa A. Dahlberg, Member, IEEE
Computer Science Department, University of North Carolina at Charlotte
Charlotte, NC 28223, USA {bcao,tdahlberg}@uncc.edu
T. A. Dahlberg is a professor in the Computer Science Department, University of North Carolina at Charlotte, Charlotte, NC 28223, USA (corresponding author, e-mail: [email protected]). B.Cao is a doctoral student in the Computer Science Department, University of North Carolina at Charlotte, Charlotte, NC 28223, USA (e-mail: [email protected]).
Abstract
This work addresses wireless capacity models and capacity consumption models for 3G WCDMA system analysis. Uplink and downlink capacities are viewed as multiple heterogeneous circuit-switched and packet-switched pools of various bit rate channels, wherein traffic channels and control channels contend for the same capacity within a cell. An individual user’s consumption of capacity is formulated as a function of the user’s traffic class, activity factor and negotiated QoS. Simulation based analysis, of resource management algorithms that employ admission control and channel rate- and type-switching, are undertaken to compare results obtained using the proposed capacity and capacity consumption models to that obtained using existing homogeneous models. The primary results demonstrate that differentiating between channel modes, giving consideration to control channel utilization, and giving consideration to user’s service type can each significantly impact the results and conclusions drawn from resource management protocol analysis.
Keywords— Capacity Model, 3G, WCDMA, Radio Resource Management.
1. Introduction
THIRD Generation (3G) mobile networks aim to provide a diverse array of users with wireless access to telecommunication networks, data networks, and to the Internet. Wireless access in 3G systems is provided via a wideband code division multiple access (Wideband-CDMA) radio interface. Radio Resource Management (RRM) protocols enact the policies for sharing the
Wideband-CDMA radio channels among various classes of user traffic with prescribed quality of service (QoS) requirements. RRM includes admission control, channel allocation, and packet scheduling protocols, etc. RRM techniques for 2G systems are not entirely applicable to 3G systems. For example, the issue of network planning becomes quite different since there is no need to deal with the frequency allocation problem in 3G systems. However, 3G admission control is more complex since capacity can no longer be expressed in terms of a number of connections or channels within each cell. The characteristics of 3G, such as soft capacity, cell- and services-specific capacity and coverage, traffic asymmetry between uplink and downlink, and multiple QoS services, require new RRM strategies.
Analysis of new RRM strategies requires a model to represent wireless transmission capacity and a model to represent a user’s demand and consumption of this capacity [1]-[8]. The wireless capacity model for 2G systems is typically viewed as a pool of homogeneous fixed bit rate channels that are consumed by mobile users for the duration of a call (circuit-switched mode) or on a slot-by-slot basis. This view is not sufficient for 3G networks wherein the soft capacity of the Wideband-CDMA radio interface is interference-limited, and the user’s capacity consumption is based on many factors such as type of service and QoS negotiations.
for the uplink of a 3G WCDMA cell are provided which include dedicated traffic channels (DCH), shared traffic channels (CPCH), and corresponding control channels (DPCCH).
We demonstrate the usefulness of our capacity model by simulation analysis, using JavaSim [16], of proposed uplink admission control protocols and channel rate- and type- switching. We use visualization of 3-D volumes to illustrate the relationships among the traffic classes in the consumption of traffic and control channel capacity. The visualizations illustrate the impact that RRM strategies have on individual user service classes as well as system performance as a whole.
We briefly review capacity models developed or proposed for 2G and 2.5G CDMA systems in section II. In section III, we formulate a channel model for 3G WCDMA systems that encompass the multiple services supported and the multiple channel modes deployed for these systems. We review recently proposed 3G WCDMA capacity models in section IV to highlight needed improvements. In section V, we extend existing models to provide these improvements. We illustrate the use of our extended capacity model in section VI through simulation analysis of uplink RRM algorithms (admission control and channel switching). Section VII provides concluding remarks.
II. 2/2.5G CDMA Capacity Models
In this section we review capacity models for 2/2.5G CDMA systems. The primary limitation of these capacity models is that they typically model only single-service traffic. For example, the authors in [1] express the uplink capacity of a single cell narrow band CDMA system in terms of N, the maximum number of users per cell, as follows:
(1)
where NS is the number of users per sector; a is the voice activity factor; R is the user’s information bit rate; W is the total spread bandwidth; S is the received signal power, at a base station (BS), from all mobile users (MS), assuming perfect power control; and h is the background noise. The energy per bit to noise density ratio [Eb/N0] is set to the minimum ratio acceptable that will support transmission and reception of data within a predefined value of bit error rate (BER). For single-cell analysis, this ratio is expressed as:
(2)
For multiple-cell analysis, [Eb/N0] is express as:
(3)
This assumes that the interference to an MS from other MS within the same cell (or sector) has power level i (equal to “1” with probability p and “0” with probability 1-p), and the interference from MS in other cells has power level I(r0, rm), where rm and r0 are the distances from an interfering MS to its own BS and to the BS serving the MS experiencing interference, respectively. Using this model, the capacity of a cell is expressed by (1), in terms of the number of users simultaneously supported within a cell. The capacity utilization of all users is simply unit 1. The limitation of this model is the assumption that all users have the same constant bit rate, and all users require the same value for [Eb/N0] for a given BER. A single service assumption is not sufficient for the multiple services supported by 3G systems [4][5][6].
The authors in [2] present an expression to calculate the Erlang capacity as a function of Erlangs per cell, inter-cell interference, and power control standard derivation. Uplink cell capacity is expressed as the load, Z, of a cell:
(4)
Z is determined by specification of an acceptable blocking rate:
(5)
where W, R, Eb, and N0 are as previously defined; k is the number of MS per cell; v is an “on/off” binary random variable representing voice activity; e = [Eb/N0], h = N0/I0;
and I0 is the maximum total acceptable interference density. The value of [Eb/N0] for each MS is a variable dependant on propagation conditions and can be determined empirically from field measurement. Using this model, the capacity of the uplink in a cell is expressed by (4) and (5), in terms of Erlangs. The capacity utilization of all users varies based on propagation conditions, but not based on type of service. Hence, a similar limitation as for [1] remains.
The authors in [3] extend the above capacity model to include both voice and web browsing (WWW) services, as follows:
(6)
respect to bit rate. It has been shown that the minimum required value of [Eb/N0] is not solely proportional to bit rate. Higher bit rate traffic channels receive better service from their corresponding control channel [4].
The authors in [5] propose a theoretical capacity model for power-controlled CDMA uplink. Instead of considering the commonly used “soft blocking,” the author derives a capacity model used to control admittance of new user connections when the system is saturated. However, the authors assume that the capacity required by all best-effort connections is fixed and homogeneous, and that the value of [Eb/N0]required for a given BER remains the same over connections of varying bit rates. The authors in [4] have shown that these assumptions are not sufficient for WCDMA systems.
Although most of the above CDMA capacity models are applicable to circuit-switched dominant 2G/2.5G systems, this is not the case for packet-switched CDMA capacity models. For example, in circuit-switched mode, cell capacity is generally limit to the maximum number of channels supported based on a given QoS target, and it is undesirable to add extra channels beyond this limit. But for packet-switched mode, occasional or controlled increase of BER beyond a target value can be tolerated by application of error control mechanisms such as ARQ (Automatic Retransmission Request) and FEC (Forward Error Correction). Hence, the hard limit imposed by circuit-switched capacity modes can be exceeded in a controlled way, and certain additional interference can be allowed without undue detrimental effects on QoS performance.
The authors in [6] put forth a packet-switched CDMA capacity definition as the number of users that enables the whole system to achieve maximum packet throughput. But it is not clear how, for the proposed model, the packet-switched and circuit-packet-switched modes coexist in the same system. Modeling coexistence of packet- and circuit-switched traffics is a necessity for analysis of WCDMA systems [15].
III. WCDMA Channels
In general, 2/2.5G CDMA channels were defined to carry circuit-switched voice services [4][10], with data services supported as an add-on feature. For UMTS Terrestrial Radio Access Network (UTRAN), diverse channels with different characteristics are designed to carry multiple services, as shown in Table I. Hence, for WCDMA systems the capacity and consumption of both traffic and control channels are quite different from those for 2/2.5G CDMA systems, requiring new capacity models. For example, consider that the 2/2.5G CDMA capacity models described in the previous section are such that one can view the wireless capacity for these systems as a pool of fixed bit rate traffic channels that are allocated on a circuit-switched basis. Even packet data traffic
is carried by circuit-switched connections [4]. A different view is required to model the uplink and downlink of WCDMA systems, as described next.
A. WCDMA Uplink
In WCDMA uplink, there are three kinds of transport channels: Random Access Channel (RACH), Dedicated Channel (DCH), and Common Packet Channel (CPCH). All of these transport channels are mapped to physical channels in the physical layers as shown in Fig. 1.
TABLE I
Qos Service in WCDMA [12]
RACH is primarily used to handle common access signaling functions such as registration updates. A dedicated channel (DCH) is allocated for exclusive use by a single mobile user, MS, and a 3G base station access point, called the Node B [12]. DCH are used in both uplink and downlink to transport user data and control traffic. DCH are allocated in a circuit-switch mode and aim to carry delay sensitive traffics. DCH has obvious advantages of fast power control, multiple bit rates, soft handover, and less interference than common/shared channels, but requires more time for connection set up and tear down [14].
Common Packet Channel (CPCH) is a special transport channel for WCDMA uplink. Evolved from RACH, Digital Sense Multiple Access with Collision Resolution Access (DSMA-CR) is employed by users sharing a CPCH. A pool of CPCH channels, of various bit-rates, can be allocated at the uplink in a cell, and is shared by multiple users. CPCH is characterized by channel sharing, fast access, and close
Fig. 1. Transport channel mapping of WCDMA uplink
Class Properties
Conversational Voice
Preserve time variation between information entries;
conversational patterns;
Streaming Streaming video/audio
Preserve time variation between information entries;
Interactive Web browsing
Request/response service; Preserve payload
Background Email No time constraints; Preserve payload.
power control, which provide more efficient capacity utilization when transporting bursty packet traffic as compared to using DCH.
As shown in Fig. 1, each RACH is mapped to a Physical Random Access Channel (PRACH). An additional control channel, a Dedicated Physical Control Channel (DPCCH), is directly associated with each traffic channel Dedicated Physical Data Channel (DPDCH), for signaling (e.g., power control) in the physical layer. DPCCH and DPDCH coexist in an Inphase-Quadrature multiplex mode at the uplink. Hence, each DCH is mapped to a Dedicated Physical Data Channel (DPDCH) for traffic and a DPCCH for control in the physical layer [13]. Similarly, each CPCH is mapped onto a DPDCH and DPCCH [13].
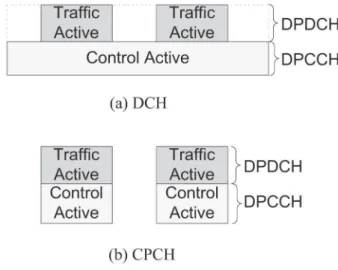
However, the DPDCH/DPCCH association is not the same for both channel modes. As shown in Fig. 2, CPCH control channel capacity is only utilized during periods of active data transmission. DCH control channel capacity is utilized throughout a connection, since it is circuit-switch based and continuous power control is required even during periods of no data transmission. Therefore, control channel capacity utilization varies dependant on the traffic channel modes used.
Fig. 2. Channel utilization of DCH and CPCH
Thus, the wireless capacity of a WCDMA uplink system (assuming FDD), can be viewed as two pools of varied bit rate channels, wherein the number of channels available within each pool, and the channel bit rate, varies dynamically and is dependent on the activity factor and interference constraints of ongoing user connections. Capacity allocation strategies are employed to admit new connections or switch existing connections among channel pools and/ or among channels within a single pool, as shown in Fig. 3:
Fig. 3. Heterogeneous channel pools
As shown in Table I, 3GPP supports at least 4 types of QoS services [12]. However, the type of transport channels designated to transport various traffic classes is not defined by the 3GPP standard. While it is clear that real time conversational and streaming traffic types should use DCH to guarantee the QoS requirements, interactive packet traffic types (e.g., web browsing) can use either circuit-switched DCH or packet-circuit-switched CPCH—depending on the time-varying activity of a particular user. In order to efficiently utilize capacity, allocation strategies can vary the bit rate assigned to a user inside the same channel pool (channel rate switching) and can switch an interactive user among the DCH/CPCH pools (channel type switching).
B. WCDMA Downlink
A similar but different case exists for WCDMA downlink [13]. Among the downlink transport channels, DCH and Downlink Shared Channels (DSCH) are the two major transport channels for user traffic. Forward Access Channel (FACH) is primarily used for system signaling functions such as paging.
The WCDMA downlink transport channel to physical channel mapping is shown in Fig. 4. FACH is mapped to the Secondary Common Control Physical Channel (S-CCPCH). Each DCH is mapped to one Downlink Dedicated Physical Channel (downlink DPCH), which is logically divided into one DPDCH and one associated DPCCH, but the two associated DPCCH and DPDCH are time-multiplexed instead of I/Q-multiplexed as for the uplink. Each DSCH is mapped to one Physical Downlink Shared Channel (PDSCH), which can be code-multiplexed by multiple users within one radio frame or time-multiplexed by multiple users among different radio frames. For each radio frame, each DSCH is mapped to one physical layer PDSCH to carry traffic. Each DSCH is also directly associated with one downlink DCH (DPDCH / DPCCH) for signaling (e.g., power control).
multiple users, there might be additional load generated from the associated DPDCH/DPCCH. Since all the physical channels coexist and generate interference in the same downlink pool, a capacity model is required that considers these multiple factors, as well as the trade-offs when dealing with the multiple services of WCDMA. Thus a similar capacity view of the downlink as heterogeneous channel pools is applicable, as shown in Fig. 3.
Fig. 4. Transport channel mapping of WCDMA downlink
IV. WCDMA Capacity Models
In this section, we review proposed WCDMA capacity models. The authors in [4] discuss a theoretical load estimation method to make a semi-analytical prediction of the average uplink capacity of a WCDMA cell, expressed in terms of a load factor h :
(7)
where i is the inter-cell interference factor; N is the number of users; and Lj_UL is the load (i.e., capacity utilized) by a single user, expressed as:
(8)
where W is the spread bandwidth; [Eb/N0]j is set to a value predetermined to prescribed QoS; Rj is the bit rate and vj is activity factor of user j.
A similar consideration is applied in the downlink. At the downlink, the capacity utilization of a user is expressed as Lj_DL:
(9)
where Rj, W, vj and [Eb/N0]j have the same meanings as for the uplink; is an othogonality factor of the channel of user j, which depends on the downlink multi-path propagation; and ij is the power ratio of other cell to own
cell received by user j, which is different among users with different user locations and log-normal shadowing. Another difference from uplink is that the Spreading Factor (SF) of Rj for the downlink DPCCH is not fixed as in the uplink.
The total downlink capacity of a WCDMA cell can be similarly found:
(10)
where N is the number of connections with extra allowance with soft handover overhead.
However, it is not clear how this model is used to differentiate between control channel capacity utilization for dedicated channels versus shared channels, e.g., DCH versus CPCH channel in the uplink. That is, the capacity model considers control channel capacity utilization by inflating the activity factor. The authors consider two user services: voice and data (uplink case). The activity factor for voice service is assumed to be 50% with an added “capacity overhead” from DPCCH control channels of 17%. This gives an overall activity factor of 67%. The activity factor for data service is assumed to be 100%, which cannot reflect the burstiness of data service in WCDMA [15][17]. Consider, however, that the interactive service class at the uplink, shown in Table I, can be supported with either DCH or CPCH channels. As shown in Fig. 2, the use of DCH over CPCH for an interactive service will increase the capacity consumed by the associated DPCCH control channel.
It has been shown that making the distinction between the usage of DCH and CPCH (and considering the differences in resultant capacity consumption) is important to prevent overly pessimistic predictions of capacity utilization for interactive services, such as WWW [8][9]. Also, since the control and traffic channel users contend for the same capacity resource, it is necessary that WCDMA capacity models explicitly consider control channel capacity consumption.
Another limitation of current capacity models (e.g., [1][5][6]) is that they model either packet-switched services or circuit-switched services, but not both. In order to analyze RRM strategies to manage the multi-services (packet- and circuit- switched) for WCDMA systems, a capacity model is needed that considers at least the multiple services listed in Table I, and the capacity consumption of both traffic and control channels to support these services. We propose such a model, as follows.
V. A Capacity Model for 3G WCDMA
We extend the work in [4] to more clearly model capacity utilization in a manner that considers negotiated QoS levels,
UL
The capacity of a cell uplink is expressed as load, as follows:
(15)
Similarly, we extend (9) for the downlink considering both the packet-switched shared channel and the circuit-switched dedicated channel. At downlink, the capacity utilization of a traffic or a control channel can be represented a load factor:
(16)
(17)
(18)
As shown in Fig. 4, the downlink channel mapping and association are different from the uplink. When a user goes into the shared DSCH mode, an associated downlink DPCH is triggered simultaneously. Thus capacity utilization of a user for dedicated and shared channel mode in the downlink will be respectively:
(19)
(20)
where the values of (gj, Rj, nj, aj, ij) are similar to that for LDPDCHj_DL, LDPCCHj_DL, and LPDSCHj_DL respectively.
Thus, the total load is divided from the DCH channel pool, with capacity LDCH_DL, and the DSCH channel pool, with capacity LDSCH_DL
(21) as well as the distinction between traffic and control channel
capacity consumption for dedicated versus shared channels. As explained in the previous section, the authors in [4] use (8) to model capacity utilization as a load factor. We also use (8) to model uplink capacity utilization as a load factor. However, unlike [4], we use (8) to separately model the control channel load consumption and the traffic channel load consumption. This enables one to choose distinct load factor parameters (gj, Rj, nj) for traffic channels and control channels. The capacity utilization of a traffic channel or of a control channel is expressed as a load factor as LDPDCHj_UL or LDPCCHj_UL:
(11)
(12)
where gj = [Eb/N0]j and is determined based on bit rate, service type, and channel mode; Rj is service bit rate; W is the WCDMA chip rate; vj is the activity factor of the channel, and where the terms (gj, Rj, nj) are defined as for
(gj, Rj, vj) in (11). The accent on the control channel terms is meant merely to indicate that these values for control channels do not necessarily correspond to the similar values for the corresponding traffic channel, which is a result of the different performance requirements of the diverse channels [4][14][17].
Note that for a DCH user, traffic channel activity factor corresponds to the burstiness of the users’ traffic and varies over time. Control channel activity factor, however, is always 1. For a CPCH user, traffic and control channel activity factors are both time-varying indicators of burstiness.
Capacity utilization of a user is expressed dependent on the user’s channel mode, as the sum of (11) and (12). Thus, the total load is divided among the DCH channel pool, with capacity LDCH_UL, and the CPCH channel pool, with capacity LCPCH_UL.
(13)
(22)
Similarly, we obtain the capacity of a cell downlink as a load, as follows:
(23)
where LDCH_DL and LDSCH_DL can be computed based on (21) and (22).
The extended capacity model considers both the uplink and downlink and differentiates traffic and control load generated from packet-switched shared channel and circuit-switched dedicated channels. This intrinsic traffic/load differentiation provides extra flexibility in RRM strategies, as shown in the simulations of the next section.
VI. Simulation Study Using Capacity Models
We illustrate use of our uplink capacity model for simulation-based analysis of RRM uplink algorithms. Our RRM algorithms combine cell admission control with channel rate switching and channel type switching. The simulation study demonstrates the benefits of differentiating the traffic load and control load by service class, thus enabling dynamic channel rate- and type- switching of interactive traffic for more efficient use of cell capacity, as explained next.
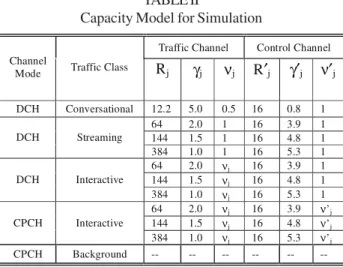
We simulate RRM for a single WCDMA cell, considering the inter-cell interference. Users arriving to the cell as new or handover connections request service according to a user profile. The user profile specifies one or a range of service levels from the 3GPP QoS classes shown in Table II. Note that gj = [Eb/N0]j varies with respect to users' QoS levels. Table II values were adopted from the results of link level simulations given in [4]. The activity factor, nj, is a time-varying random variable that represents the burstiness of the offered load.
As Table II illustrates, four basic service types are possible: conversational, streaming, interactive, or background. Conversational services are carried by DCH and are assumed to utilize control and traffic channel capacity according to (13) with parameters specified in Table II. Streaming services are also carried by DCH and are assumed to similarly utilize channel capacity, but further specify tolerable bit rate(s) (e.g., 64, 144, 384 kbps). Interactive services can be carried by either DCH or CPCH and are assumed to utilize control and traffic channel capacity according to (13) or (14), respectively, with parameters shown in Table II. As illustrated in Table II, a choice of bit rates is also possible. Background services
are carried by CPCH on a least priority, when capacity is available, basis. We did not consider background tasks in this simulation study.
TABLE II
Capacity Model for Simulation
Hence, for each simulation scenario, when a new or handover user requests admittance to a cell, the user will submit a user profile which specifies the acceptable QoS in terms of the traffic class and minimum and maximum acceptable bit rate limits. E.g., as shown in Table II, a user might specify "interactive" traffic QoS class and agree that 64-144 kbps is acceptable as the range of bit rate values.
The simulations were conducted using component-based simulator: JavaSim [16], and using the parameters listed in Table III. The system related values are adopted from [4][14]. Although the exact bit rate values are not defined by 3GPP standards [12], we apply typical bit rate values from [4], which are used for link budgets analysis. Real-time conversational and streaming services are modeled as Variant Bit Rate Traffic at 100% activity, with Poisson arrival and exponential duration. Packet traffic models recommended in [8][17] are applied, which determines the time-varying nj for bursty packet traffic (interactive service). Due to asymmetry of uplink and downlink for interactive traffic, we apply packet models with small uplink packet size. The simulated cell is setup with an initial CPCH pool which can accommodate the capacity for each of the bit rates (64/144/384 kbps).
A. Admission Control with
DCH/CPCH Load Differentiation
In this section, we compare two simulation scenarios. In the first scenario, cell capacity is modeled as a single pool of varied bit rate channels. E.g., cell capacity can be viewed as the "DCH capacity" pool shown in Fig. 3.
Traffic Channel Control Channel Channel
Mode Traffic Class Rj γj νj R′j γ′j ν′j
DCH Conversational 12.2 5.0 0.5 16 0.8 1
64 2.0 1 16 3.9 1
144 1.5 1 16 4.8 1
DCH Streaming
384 1.0 1 16 5.3 1 64 2.0 νj 16 3.9 1
144 1.5 νj 16 4.8 1
DCH Interactive
384 1.0 νj 16 5.3 1
64 2.0 νj 16 3.9 ν’j
144 1.5 νj 16 4.8 ν’j
CPCH Interactive
384 1.0 νj 16 5.3 ν’j
TABLE III Simulation Parameters
During simulation, the offered load is a combination of demand for conversational, streaming and interactive services. An admission control algorithm accepts user requests if the expected load (as specified by the user profile) added to the existing cell load is below a prescribed threshold value. Accepted users keep the same bit rate throughout their connection (i.e., no channel bit rate switching is employed).
In the second scenario, cell capacity is modeled as two pools of varied bit rate channels. E.g., cell capacity can be viewed as the DCH and CPCH channel pools shown in Fig. 3. A similar admission control algorithm accepts user requests for conversational and streaming services and similarly assigns accepted users to a DCH. Requests for interactive services, however, are assigned to either DCH or CPCH according to the activity factor specified in the user profile. No dynamic channel rate- or type- switching is employed.
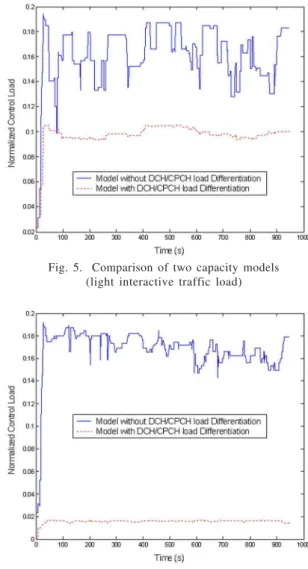
Fig. 5 and Fig. 6 show the results of these simulations. The figures illustrate the normalized real-time capacity consumption of the control channels during a simulation run. The solid line in Fig. 5 shows results for scenario 1 (admission control to a single channel pool). The dashed line in Fig. 5 shows results for scenario 2 (admission control
to two channel pools). The offered load for the Fig. 5 simulation runs was comprised of a 1:1:1 ratio of conversational, to streaming, to interactive services. Fig. 6 shows results for similar simulation scenarios, but for an offered load comprised of a 2:2:6, i.e., with much higher demand for interactive services.
In looking at the figures, we note the following. The off-loading of low activity interactive services to CPCH channels can result in a significant savings in control channel capacity utilization. This also means that if one performs simulation analysis of RRM without differentiating between the control and traffic channel capacity utilized by interactive services, then overly pessimistic results could be generated. This situation is exacerbated as the portion of the interactive traffic increases (Fig. 6 results). Since WCDMA traffic growth is expected in large part due to interactive services, it is important to implement RRM that utilize both DCH and CPCH for interactive services and to employ capacity models that distinguish between these channel pools.
Fig. 5. Comparison of two capacity models (light interactive traffic load)
Fig. 6. Comparison of two capacity models (heavy interactive traffic load)
Simulation Parameter Values
Radio Access M ode WCDMA (FDD) Uplink
Spread bit rate 3.84Mcps
Intercell Interference factor 0.65
Normalized Capacity 3dB
Service classes Conversational, Streaming,
Interactive
Connection arrival Poisson
Connection Duration Exponential
Bit rate
Conversational: 12.2kbps Streaming: 64, 144, 384(kbps) Interactive: 64, 144, 384(kbps)
DPCCH bit rate 16kbps
Eb/N0 target
Conversational: 5.0dB Streaming: 2.0, 1.5, 1.0(dB) Interactive: 2.0, 1.5, 1.0(dB) Connection setup + release
time 250ms
Inter-packet arrival time in packet call
64kpbs: 63ms 144kpbs: 28ms 384kpbs: 10ms
Connection release timer 1s
TCP RTT 300ms
Packet size 480bytes
Average file size 1kbytes
Initial CPCH pool
Fig.7. System states between channel switching
Fig. 8. Comparison of three admission control algorithms
B. Dynamic Channel Switching with DCH/CPCH Load Differentiation
In this section, we compare three simulation scenarios. The first and second scenarios employ admission control to a single DCH pool, as described in the previous section. The second scenario further includes dynamic channel rate switching (as illustrated in Fig. 3) to modify the bit rate of the DCH assigned to an on-going connection. The reassignment of rates is invoked when needed to satisfy a handover connection request when the cell is close to its capacity limit. The third scenario is similar to scenario two of the previous section (admission control to two channel pools, DCH and CPCH). The third scenario also includes dynamic channel rate- and type- switching (as illustrated in Fig 3) to modify the rate and/or type of the channel assigned to an on-going interactive connection.
The use of channel rate- and type- switching is further illustrated by Fig. 7. The oval on the left represents cell capacity utilization for one snapshot in time. As shown,
Fig. 9. Capacity utilization
Fig. 10. Another view of capacity utilization Fig. 8 illustrates new connection blocking rates (NBR)
as offered load is increased for the three simulation scenarios. In all cases, the offered load is evenly distributed among the three traffic classes (i.e., 1:1:1). The results show that using our capacity model, and thus enabling both channel rate switching and channel type switching, improves performance. Before the system reaches a high congestion state, the NBR of the admission control with both channel type- and rate- switching remains the lowest among the three values. This is because the dynamic changes in activity of interactive users are considered for radio resource management.
That is, when the system load is approaching the threshold values, the Node B will adaptively switch the on-going low activity interactive users from DCH pool into CPCH pool. This generates additional free capacity that is put back into the channel pools, to lower NBR. The next best algorithm is the admission control algorithm with channel rate switching only, which also reflects the multiple bit rates view of our capacity model. All results show
C. Visualization of RRM Strategies
Next, we experimented with using 2D and 3D visualization to illustrate subtle behaviors of the RRM strategies on the QoS
a DCH; otherwise, it is carried by a CPCH. A high offered load was employed.
The color bars illustrate capacity utilization in terms of color. The bars are not cumulative in the y-axis. For example, the red bar, on the bottom, shows capacity utilization for DCH traffic channels. This value remains at a high, almost flat, value. This is as expected since the offered load is high, and the algorithm employed always designates DCH as a first choice. The height indicates the threshold value set to limit the DCH pool capacity.
The second color bar from the bottom, the green, indicates the capacity utilization of CPCH traffic channels. Note the rise and dips of channel usage. The rise indicates points wherein the DCH utilization is at threshold, and offloading to CPCH begins. The dips indicate points of lower activity, and hence little or no CPCH usage.
The third color bar from the bottom, the blue, indicates the total control channel capacity utilization (shown as combined for both DCH and CPCH control channels). Note that the blue bar tends to increase proportional to the CPCH capacity increase. However, the increase in total control channel capacity utilization is very slight for increased CPCH. This is due to the markedly lower usage of control channel capacity by CPCH, as compared to DCH. Finally, the yellow bar, on top, illustrates the variations in available capacity (“free channel”) during simulation.
Fig. 9 illustrates real-time capacity utilization in a manner similar to a 2D plot. However the solid coloring allows the user to get a quick understanding of capacity usage across different types of services.
The same information is illustrated in the 3D concentric volumes shown in Fig. 10. The thin inner light colored (yellow) line denotes free capacity throughout the simulation run. Surrounding this are blue, green, and red concentric volumes to show the utilization values for control, CPCH traffic, and DCH traffic channels respectively. While the black and white printout is difficult to interpret, the live manipulation (zooming, rotating) provides interesting exploration into algorithm behavior.
In the second visualization, Fig. 10, transparent concentric cylinders represent each of the metrics. A key advantage of these visualizations is the ability to look at long dynamic simulations in an interactive setting and the ability to zoom into parts of the simulations that might be of interest. This is accomplished by constructing such views within a 3D dynamic and interactive environment, which also permits interactive queries.
VII. Conclusion
We have addressed wireless capacity models, for 3G WCDMA system analysis, which handle modeling of
multiple services and dual mode (circuit- and packet-switched) traffic transmission based on the 3G Wideband-CDMA radio interface. We presented a view of 3G WWideband-CDMA wireless capacity as heterogeneous pools of various bit rate channels, wherein traffic channels and control channels contend for the same capacity within a cell. We explained that the capacity utilization of control channels varies for different channel types (e.g., DCH versus CPCH in the uplink), and that capacity utilization of traffic and control channels varies for different services and bit rate values.
In addition, we discussed the four QoS services carried by 3G systems and explained why capacity utilization for each user must consider the user’s traffic class, activity factor, and negotiated QoS.
We have reviewed capacity models proposed or employed for CDMA systems and some geared towards WCDMA systems. A primary drawback in these models was shown to be the lack of consideration of capacity utilization based on users’ service type and channel mode. Additionally, many existing models deal with circuit-switch and packet-switch mode separately. We extended a given model to encompass these dynamics.
Finally, the usefulness of the proposed capacity model and capacity utilization models was illustrated through simulation-visualization analysis of admission control protocols and channel rate- and type- switching protocols. The primary results demonstrated that differentiating between channel modes (e.g., DCH or CPCH in the uplink), giving consideration to control channel utilization, and giving consideration to user’s service type can each significantly impact the results and conclusions drawn.
A
CKNOWLEDGMENTWe thank Dr. K. R. Subramanian for his work on the visualizations.
R
EFERENCES[1] Gilhousen K. J., Jacobs I.M., Padovani R., Viterbi A. J., Weaver I. A. and Wheatly C.E., “On the capacity of a cellular CDMA system”, IEEE Transactions on Vehicular Technology, vol. 40, May 1991, pp 303-312. [2] Viterbi A.M., and Viterbi A. J, “Erlang capacity of a
power controlled CDMA system”, IEEE Journal on Selected Areas in Communications, vol. 11, No. 6, Aug 1993, pp.892-920.
[3] C. Comaniciu, N. Mandayam, D. Famolari and P. Agrawal, “Admission and Flow Control in Multimedia CDMA’’, in Proceedings of IEEE Multimedia Conference, New York, NY, July 2000.
[5] Eitan Altman, “Capacity of Multi-service Cellular Networks with Transmission-Rate Control: A Queueing Analysis”, MOBICOM’02, Atlanta, Georgia, USA, Sep 23-28, 2002.
[6] Rui Luo, PingZhi Fan, “Capacity Evaluation of Packet-Switched CDMA System”, IEEE Communication Letters, vol. 15, No 8, Aug, 2001.
[7] Yoshihiro Ishikawa, Narumi Umeda, “Capacity Design and Performance of Call Admission Control in Cellular CDMA Systems”, IEEE Journal on selected areas in communications, vol. 15, No.8, Oct, 1997.
[8] K. Parsa, S.S. Ghssemzadeh, S. Kazeminejad, “Systems Engineering of Data Services in UMTS W-CDMA Systems”, International Conference on Communications, Helsinki, Finland, June 2001. [9] GBT wireless, CPCH Technical Overview, [Online],
Available: http://www.getwireless.com/pages/tech/ tech.html
[10] Ramjee Prasad, Tero Ojanpera, “An Overview of CDMA Evolution Towards WideBand CDMA”, IEEE Communications Surveys, Fourth Quarter, 1998. vol. 1 No.1.
[11] 3GPP, Radio Resource Management Strategies (Release 4), 3GPP TR25.992 V4.2.0, March 2002.
[12] 3GPP, QoS Concept and Architecture (Release 4), 3GPP TS23.107 V4.2.0, Oct 2001.
[13] 3GPP, Physical Channels and mapping of transport channels onto physical channels (Release 1999), 3GPP TS25.211 V3.5.0, Dec 2000.
[14] 3GPP, Physical Layer Procedures (FDD) (Release 1999), 3GPP TS25.214 V3.5.0, Dec 2000.
[15] 3GPP, Services provided by the Physical layer, 3GPP TS25.302 V3.5.0, June 2000.