www.bjorl.org
Brazilian
Journal
of
OTORHINOLARYNGOLOGY
REVIEW
ARTICLE
Aging
and
wave-component
latency
delays
in
oVEMP
and
cVEMP:
a
systematic
review
with
meta-analysis
夽
Ysa
Karen
dos
Santos
Macambira
a,
Aline
Tenório
Lins
Carnaúba
b,
Luciana
Castelo
Branco
Camurc
¸a
Fernandes
c,d,
Nassib
Bezerra
Bueno
e,f,
Pedro
de
Lemos
Menezes
c,g,∗aUniversidadeEstadualdeCiênciasdaSaúdedeAlagoas(UNCISAL),Audiologia,Maceió,AL,Brazil
bUniversidadeFederaldeAlagoas(UFAL),RedeNordestedeBiotecnologia(RENORBIO),BiotecnologiaemSaúde,Maceió,AL,
Brazil
cUniversidadeEstadualdeCiênciasdaSaúdedeAlagoas(UNCISAL),Maceió,AL,Brazil dUniversidadeFederaldeSãoPaulo(UNIFESP),DistúrbiodaComunicac¸ão,SãoPaulo,SP,Brazil
eUniversidadeFederaldeAlagoas(UFAL),Maceió,AL,Brazil
fUniversidadeFederaldeSãoPaulo(UNIFESP),Ciências,SãoPaulo,SP,Brazil
gUniversidadedeSãoPaulo(USP),FísicaaplicadaàMedicina,SãoPaulo,SP,Brazil
Received10October2016;accepted7December2016 Availableonline2February2017
KEYWORDS
Cervicalvestibular evokedmyogenic potential; Ocularvestibular evokedmyogenic potential; Elderly
Abstract
Introduction:Thenaturalagingprocessmayresultinmorphologicalchangesinthevestibular systemandintheafferentneuralpathway,includinglossofhaircells,decreasednumbersof vestibularnervecells,andlossofneuronsinthevestibularnucleus.Thus,withadvancingage, thereshouldbeadecreaseinamplitudesandanincreaseinlatenciesofthevestibularevoked myogenicpotentials,especiallytheprolongationofp13latency.Moreover,manyinvestigations havefoundnosignificantdifferencesinlatencieswithadvancingage.
Objective: Todetermineifthere aresignificant differencesinthelatencies ofcervicaland ocularevokedmyogenicpotentialsbetweenelderlyandadultpatients.
Methods:Thisisasystematicreviewwithmeta-analysisofobservationalstudies,comparing thedifferencesoftheseparametersbetween elderlyandyoungadults,withoutlanguageor daterestrictions,inthefollowingdatabases:Pubmed,ScienceDirect,SCOPUS,WebofScience, SciELOandLILACS,inadditiontothegrayliteraturedatabases:OpenGrey.euandDissOnline, aswellasResearchGate.
夽 Pleasecitethisarticleas:MacambiraYK,CarnaúbaAT,FernandesLC,BuenoNB,MenezesPL.Agingandwave-componentlatencydelays inoVEMPandcVEMP:asystematicreviewwithmeta-analysis.BrazJOtorhinolaryngol.2017;83:475---87.
∗Correspondingauthor.
E-mail:pedrodelemosmenezes@gmail.com(P.L.Menezes).
PeerReviewundertheresponsibilityofAssociac¸ãoBrasileiradeOtorrinolaringologiaeCirurgiaCérvico-Facial.
http://dx.doi.org/10.1016/j.bjorl.2016.12.006
Results:Then1oVEMP latencieshadameandelayintheelderlyof2.32mswith95%CIof 0.55---4.10ms.Theoveralleffecttestshowedp=0.01,disclosingthatsuchdifferencewas sig-nificant.The heterogeneityfound wasI2=96% (p<0.001).Evaluation ofp1latency wasnot
possibleduetothelownumberofarticlesselectedforthiscondition.cVEMPanalysiswas per-formedin13articles.Forthep13component,themeanlatencydelayintheelderlywas1.34ms with95%CIof0.56---2.11ms.Theoveralleffecttestshowedap<0.001,withheterogeneityvalue
I2=92%(p<0.001).Forthen23component,themeanlatencydelayfortheelderlywas2.82ms
with95%CIof0.33---5.30ms.Theoveralleffecttestshowedp=0.03.Theheterogeneityfound wasI2=99%(p<0.001).
Conclusion:The latencyofoVEMP n1wave componentandlatencies ofcVEMPp13 andn23 wavecomponentsarelongerintheelderlyaged>60yearsthaninyoungadults.
© 2017 Associac¸˜ao Brasileira de Otorrinolaringologia e Cirurgia C´ervico-Facial. Published by Elsevier Editora Ltda. This is an open access article under the CC BY license (http:// creativecommons.org/licenses/by/4.0/).
PALAVRAS-CHAVE
Potencialevocado miogênicovestibular cervical;
Potencialevocado miogênicovestibular ocular;
Idosos
EnvelhecimentoeosatrasosnaslatênciasdascomponentesdeondanooVEMPeno
cVEMP:umarevisãosistemáticacommetanálise
Resumo
Introduc¸ão:Oprocessonaturaldeenvelhecimentopoderesultaremmudanc¸asmorfológicasno sistemavestibularenavianeuralaferente,incluindoperdadecélulasciliadas,diminuic¸ãodo númerodecélulasdonervovestibulareperdadeneurôniosnonúcleovestibular.Dessaforma, comoavanc¸odaidade,deveria ocorrerdiminuic¸ãonasamplitudeseaumentonaslatências dospotenciaisevocadosmiogênicosvestibulares(VEMP),principalmenteoprolongamentoda latênciap13.Alémdisso,muitosartigosnãoencontraramdiferenc¸assignificativasnaslatências doVEMP,comoavanc¸odaidade.
Objetivo:Analisar se existem diferenc¸as significativas para as latências do VEMP cervical (cVEMP)edoVEMPocular(oVEMP)entreidososeadultos.
Método: Revisão sistemática com metanálise de estudos observacionais que comparam diferenc¸asdessesparâmetrosentreidososeadultosjovens,semrestric¸õesdeidiomasoudatas, nasseguintesbasesdedados:Pubmed,ScienceDirect,Scopus,WebofScience,SciELOeLilacs. Alémdasbasesdeliteraturacinzenta:OpenGrey.eueDissOnline,eaindanoResearchGate.
Resultados: Aslatênciasn1dooVEMPtiveramumatrasomédionosidososde2,32mscomIC 95%0,55---4,10ms.Otesteparaoefeitogeralobtevep=0,01erevelouquetaldiferenc¸afoi significativa.AheterogeneidadeencontradafoiI2=96%(p<0,001).Avaliac¸ãodalatênciadep1
nãofoipossíveldevidoaobaixonúmerodeartigosselecionadosparaessacondic¸ão.Aanálise docVEMPfoirealizadacom13artigos.Paraocomponentep13,oatrasomédioparaaslatências dosidososfoide1,34mscomIC95%0,56---2,11ms.Otesteparaoefeitogeralobtevep<0,001; comvalordaheterogeneidadeI2=92%(p<0,001).Paraocomponenten23,oatrasomédiopara
aslatênciasdosidososfoide 2,82mscomIC95%0,33---5,30ms. Otesteparaoefeitogeral obtevep=0,03.AheterogeneidadeencontradafoiI2=99%(p<0,001).
Conclusão:Alatênciadocomponentedeondan1dooVEMPeaslatênciasdoscomponentes deondap13en23docVEMPsãomaisprolongadasemidososcomidade>60anosdoqueem adultosjovens.
© 2017 Associac¸˜ao Brasileira de Otorrinolaringologia e Cirurgia C´ervico-Facial. Publicado por Elsevier Editora Ltda. Este ´e um artigo Open Access sob uma licenc¸a CC BY (http:// creativecommons.org/licenses/by/4.0/).
Introduction
The vestibular evoked myogenic potential (VEMP) is an objective, non-invasive examination with high-intensity auditorystimulithat assessesvestibularfunction integrity throughthemusclereflexresponse.1---3
Recentadvancesintechnologyhaveallowedcliniciansto assessthe vestibularfunctioncapacitythroughthe ocular
(oVEMP)andcervicalvestibularevokedmyogenicpotential (cVEMP).1,2
OVEMP is a short-latency potential that evaluates the utriculo-ocular reflex (upper vestibular nerve),3 whereas
cVEMP is a medium-latencypotential1 that evaluates the
saccular-colicreflex(lowervestibularnerve).1---6Thus,
thesecondmotorneuron,mayinterferewiththeresponse. Inviewofthis,theVEMPevaluatesthefinalreflex; there-fore, it cannot be used for the topographical diagnosis, but confirmsor rulesout theinvolvementof theaffected pathway.7---10
As a basic evaluation principle of any evoked poten-tial, the time between the stimulus and the response is measured,classifyingitasnormalor alteredbasedonthe durationtimeandthemorphologyofthegeneratedelectric waves.11---13
Thetracingobtainedconsistsoftwobiphasicwave com-plexes. In the cVEMP, the first biphasic potential has a positive peak (P) with a mean latency of 13 milliseconds (ms),followedbyanegativepeak(N)withameanlatency of23ms,anditiscalledP13-N23;whereastheoVEMPshows anegativepeak(N)withameanlatencyof10ms,followed byapositivepeak(P)withameanlatencyof15ms,being called N10-P15.4,14---16 The interaural difference of peak
latency is associatedwith theneuronal conduction veloc-ity,andtheincreasein thisdifferencecouldbeexplained bytheasymmetryinthisvelocity,commoninneurological diseases.17,18
Latencyistheclinicalparametermostoftenusedinthe analysisofVEMPresponses,sinceitdoesnotdependon stim-ulus intensity or the muscular tension level and has high reproducibility.1,19
With the natural agingprocess, morphological changes mayoccurinthevestibularsystemandtheafferentneural pathway,includinglossofhaircells,decreasednumbersof vestibularnervecellsandlossofneuronsinthevestibular nucleus.19---22Therefore,withadvancingage,thereshouldbe
adecreaseinamplitudes andanincrease inlatencies22 of
thesepotentials,especiallytheprolongationofp13latency. However, some authors report that VEMP latency cannot beaffectedbytheotolyticfunction,butbytheactivation of the organreceptor.22 Additionally, many investigations
didnot findsignificant differencesin VEMPlatencies with advancingage.21,23---27 Therefore,theaimofthisstudywas
todetermineiftherearesignificantdifferences regarding cVEMPandoVEMPlatenciesbetweentheelderlyandyoung adults.
Methods
Thedevisingofthissystematicreviewsoughttoanswerthe following question: Do the elderly have different latency values of cervical and ocular vestibular evoked myogenic potentialsthanadults?Basedonthisquestion,thereviewis reportedaccordingtotheitemsofthePreferredReporting Items for Systematic Reviews and Meta-Analyses State-ment(PRISMA).AprotocolwaspublishedinthePROSPERO database28 (http://www.crd.york.ac.uk/PROSPERO),under
registrationnumberCRD42016046991.
Searchstrategy
Thestrategyincludesthedescriptors(DECsandMESH)and Free terms (TL), based on the two first elements of PIC (Population,Interest,Context) present in thetitle,which consisted of: (senile OR Age-related OR Aged OR Aging OR Ageing Effect OR Ageing OR older) AND (vestibular
Table1 Literaturesearchstrategy,usedforalldatabases.
MEDLINE(viaPubMed)
#1E#2
#1(Cervicalvestibularevokedmyogenicpotential)OR (myogenicpotential)OR(vestibularpotential)OR (Cervicalevokedpotential)OR(Ocularevokedpotential) OR((Vestibular)AND(Evokedpotential)
#2(senile)OR(relatedtoaging)OR(elderly)OR(Aging)OR (Effectofaging)OR(Aging)OR(Elderly)OR(50years old)OR(60yearsold)OR(65yearsold)OR(70yearsold)
ScienceDirect/ClinicalTrials.gov/LILACS/Scopus/Webof Scienceandotherbases
(VestibularevokedmyogenicpotentialORvestibular potentialORVEMPORCervicalevokedpotentialOR OcularevokedpotentialOR(VestibularPotentialand evoked)AND(senileORRelatedtoagingORElderlyORL AgingOREffectofagingORAgingORElderly)
evokedmyogenicpotentialORvestibularpotentialORVEMP ORCervical evokedpotentialOR Ocularevokedpotential OR [Vestibular AND evoked AND Potential]). The com-pletestrategycanbefoundinthesupplementarymaterial (Table1).
The searches werecarried outbetween themonths of July and August of 2016, and were revised in September ofthesameyear.Thefollowing databasesweresearched: Pubmed,ScienceDirect,BVS(LILACS),SCOPUS,Circumpolar HealthBibliographicDatabase,SciELOandEMBASE,aswell asthegrayliteraturedatabases:OpenGrey.eu,DissOnline, TheNewYorkAcademyofMedicine,aswellas Reasearch-Gate.Therewasnomanualsearchoftheincludedarticles andexpertsintheareawerenotcontactedtoavoidtherisk ofcitationbias.29
Eligibilitycriteria
Table2 Newcastle-OttawaScale(adapted)forqualityassessmentofcross-sectionalstudies.
Selection:(Maximumof5stars)
1.Samplerepresentativeness:
a)Trulyrepresentativeofthemeaninthetargetpopulation.*(Allsubjectsorrandomsampling). b)Alittlerepresentativeofthemeaninthetargetpopulation.*(Non-randomsampling). c)Groupofselectedusers.
d)Descriptionofthesamplingstrategy. 2.Samplesize:
a)Justifiedandsatisfactory.* b)Notjustified.
3.Non-responses:
a)Comparabilitybetweenresponsesandnon-responsesisestablished,andtheresponserateissatisfactory.* b)Theresponserateisnotsatisfactory,orthecomparabilitybetweenresponsesandnon-responsesisunsatisfactory. c)Descriptionofresponserateorcharacteristicsofresponsesandnon-responses.
4.Exposurecalculation(riskfactor): a)Validatedmeasurementtool.**
b)Measurementtoolnotvalidated,butthetoolisavailableordescribed.* c)Descriptionofthemeasurementtool.
Comparability:(Maximumof2stars)
1.Theobjectsindifferentresultgroupsarecomparable,basedonthestudydesignoranalysis.Confoundingfactorsare controlled.
a)Thestudyconsidersthemostimportantfactor(selectone).* b)Studycontrolforanyadditionalfactor.*
Result:(Maximumof3stars)
1.Resultassessment:
a)Independentblindevaluation.** b)Recordassociation.**
c)Study’sownreport.* d)Nodescription. 2.Statisticaltest:
a)Thestatisticaltestusedtoanalyzethedataareclearlydescribedandadequate,andtheassociationmeasurementis presented,includingconfidenceintervalsandtheprobabilitylevel(p-value).*
b)Thestatisticaltestisnotappropriate,notdescribedorincomplete
ThisscalewasadaptedfromtheNewcastle-OttawaQuality AssessmentScalefor cohortstudiestoperformaqualityassessmentof cross-sectionalstudiesforthesystematicreview,‘‘Arehealthcareworkers’intentionstovaccinaterelatedtotheirknowledge,beliefs, andattitudes?Asystematicreview.’’
Dataextraction
During the selection process, the titles and abstracts of theobtainedarticleswereindependentlyevaluatedbytwo researcherswhowerenotblindedtotheauthorsorjournal title.Disagreementswereresolvedby discussion.Incases wheretherewasnoconsensus,athirdauthorwasaskedto makethefinaldecision.Thefulltextsofpotentiallyeligible articleswereacquiredandanalyzedinfull.
Theoutcomesoughtinthestudieswasthemeanlatency valuesofthebiphasiccomponentsforcVEMPand/oroVEMP andinthesecondassessment,associatedwithadispersion measure.
Datawereanalyzedfrompublishedarticlesandauthors werecontactedforadditionalinformation.Inadditiontothe outcomedata,wealsoobtainedthenamesoftheauthors, title,yearofpublication,country,agerangesofthegroups, numberofsubjectsineach group,monitoredmusclesand auditoryexaminations.Astandardformfordatastoragewas createdbasedonthemodelusedbyCochran.30
Assessmentofbiasrisk
The riskof biaswasassessedaccording tothe recommen-dations of the ‘‘Newcastle-Ottawa’’ manual and scale,31
adaptedforcross-sectionalobservationalstudies.The qual-ity of the study was independently evaluated by two researchersandthedivergenceswereresolvedby consen-sus. The maximum score to be reached was ten points and the evaluated scale items were: (1) representative-ness of the sample; (2) sample size; (3) management of non-responses; (4) exposure calculation (risk factor); (5) comparability,toinvestigatewhetherindividualsin differ-ent groups of outcomes are comparable, based on study designoranalysis,controlofconfoundingfactors;(6) eval-uationofresultsand(7)statisticaltest(Table2).
Data
analysis
Articles identified through search in databases
(n=7544)
Additional articles identified through other sources
(n=0)
Excluded articles (n=4967) Articles identified after duplicate removal
(n=7189)
Identificationr
Screening
Eligibility
Included
Assessed article (n=7189)
Summaries assessed (n=322)
Full-texts assessed (n=61)
Studies included in the quantitative synthesis
(n=16)
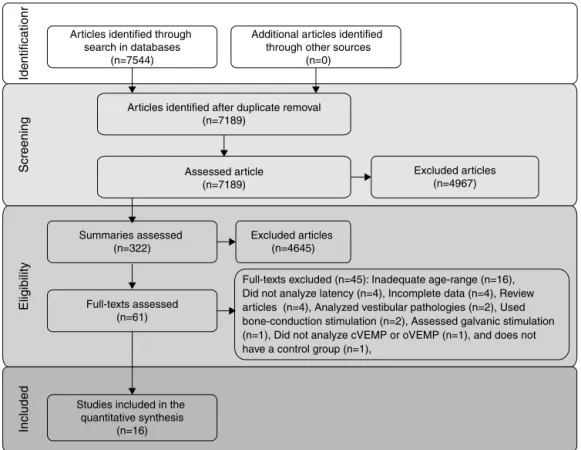
Full-texts excluded (n=45): Inadequate age-range (n=16), Did not analyze latency (n=4), Incomplete data (n=4), Review articles (n=4), Analyzed vestibular pathologies (n=2), Used bone-conduction stimulation (n=2), Assessed galvanic stimulation (n=1), Did not analyze cVEMP or oVEMP (n=1), and does not have a control group (n=1),
Excluded articles (n=4645)
Figure1 Flowchartofarticlesearchandselection.
group) wascompared by meta-analysis. Forthis purpose, a random effects model was used as a measure of the effectof themeandifferencebetween thegroups andas astatisticalmethodofanalysis.An˛valueof0.05was
con-sideredstatisticallysignificant.Whenitwasnotpossibleto obtainadequatedataforanalysis,Cochran’s recommenda-tionswerefollowed.
Thestatisticalheterogeneitybetweenstudieswastested using the Cochran’s Q test and inconsistency was tested using the I2 test. A value of p<0.10 wasconsidered
sta-tisticallysignificant.Whennecessary,studycharacteristics consideredpotentialsourcesofheterogeneitywereincluded inasubgroupanalysis.Furthermore,inthecaseof hetero-geneity,studieswereremoved,onebyone,toinvestigate whetherthatparticularstudywasthesourceof heterogene-ity.
AllanalyseswereperformedusingRevMan5.3software (CochraneCollaboration).
Results
Includedstudies
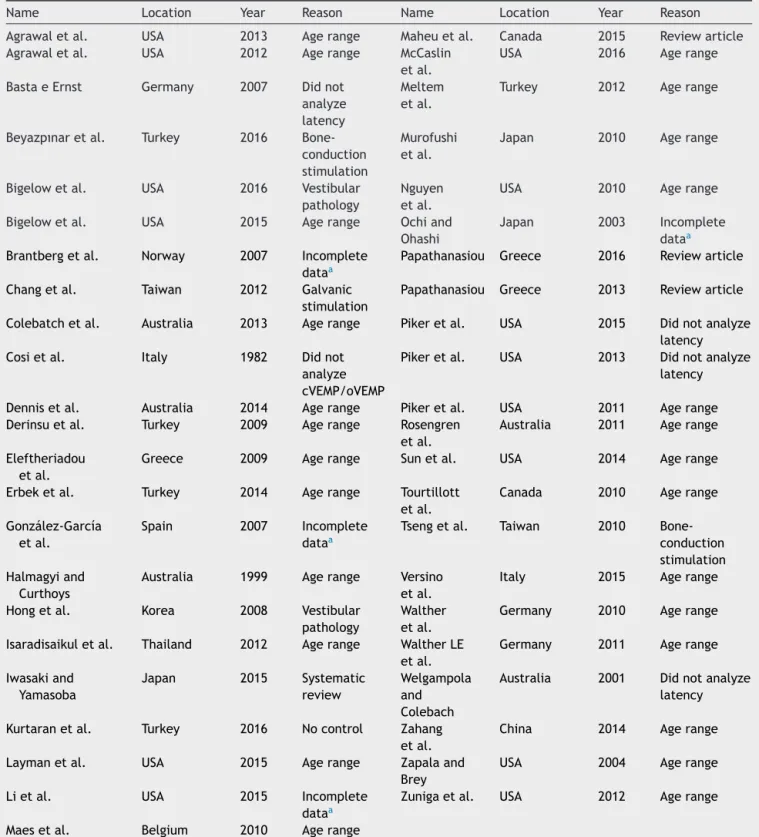
Theflowdiagramthatillustratesstudysearchandselection is shown in Fig.1. Of the7544 titles considered relevant fromthesearches inthese databases,322abstracts were readand,ofthose,61fulltextswereselectedforreadingin full.Afterreading,41articleswereexcluded,astheydidnot meettheeligibilitycriteriaandfourbecausetheydidnot havesufficientdataandtheirauthorsdidnotrespondtothe requestforadditionalinformation(Table3).Therefore,16
fulltextswereincludedinthequalitativeandquantitative analysis(Table 4).Thelatency means ofyoungadultsand elderlyindividualsofthemeta-analyzedarticlesareshown inTable5(oVEMP)andTable6(cVEMP).
Amongtheselectedstudies,onlythreeassessedoVEMP. However,one of them didnot have p1latency dataand, thus,themeta-analysisofthiscomponentwasvery compro-mised.Ontheotherhand,13articleshadmeanandstandard deviationdataforthecVEMPlatencycomponents,p13and n23, for the control group and for the elderly group. Of these,fourstudies founda significantdifferencebetween thegroups,oneof themfounda significantdifferencefor p13andnon-significantforn23,threestudieswerenotclear whetherthereweredifferencesandfiveaffirmedthatthere werenodifferencesbetweengroups.
Atotalof120subjectswerestudiedfortheassessment ofn1andp1latenciesof oVEMP,60ofwhichwereelderly and60wereyoungadults,and326subjects,ofwhich296 elderlyand326youngadults,wereevaluatedforcVEMPp13 andn23latencies.
In Table 6, all data on means and standard deviations wereprovidedexceptthestandarddeviationsofp13andn23 latenciesoftheelderlyofoneofthestudies,whenevoked byClicks.Inthiscase,thestandarddeviationswere calcu-latedbyapplyingan internationalconventioninwhichthe quotient:mean/2.5isusedtofindthestandarddeviation.
Biasriskassessment
Table3 Fulltextsexcludedfromtheanalysis.
Name Location Year Reason Name Location Year Reason
Agrawaletal. USA 2013 Agerange Maheuetal. Canada 2015 Reviewarticle Agrawaletal. USA 2012 Agerange McCaslin
etal.
USA 2016 Agerange
BastaeErnst Germany 2007 Didnot analyze latency
Meltem etal.
Turkey 2012 Agerange
Beyazpınaretal. Turkey 2016 Bone-conduction stimulation
Murofushi etal.
Japan 2010 Agerange
Bigelowetal. USA 2016 Vestibular pathology
Nguyen etal.
USA 2010 Agerange
Bigelowetal. USA 2015 Agerange Ochiand Ohashi
Japan 2003 Incomplete dataa Brantbergetal. Norway 2007 Incomplete
dataa
Papathanasiou Greece 2016 Reviewarticle
Changetal. Taiwan 2012 Galvanic
stimulation
Papathanasiou Greece 2013 Reviewarticle
Colebatchetal. Australia 2013 Agerange Pikeretal. USA 2015 Didnotanalyze
latency
Cosietal. Italy 1982 Didnot
analyze cVEMP/oVEMP
Pikeretal. USA 2013 Didnotanalyze
latency
Dennisetal. Australia 2014 Agerange Pikeretal. USA 2011 Agerange
Derinsuetal. Turkey 2009 Agerange Rosengren
etal.
Australia 2011 Agerange
Eleftheriadou etal.
Greece 2009 Agerange Sunetal. USA 2014 Agerange
Erbeketal. Turkey 2014 Agerange Tourtillott
etal.
Canada 2010 Agerange
González-García etal.
Spain 2007 Incomplete
dataa
Tsengetal. Taiwan 2010
Bone-conduction stimulation Halmagyiand
Curthoys
Australia 1999 Agerange Versino etal.
Italy 2015 Agerange
Hongetal. Korea 2008 Vestibular
pathology
Walther etal.
Germany 2010 Agerange
Isaradisaikuletal. Thailand 2012 Agerange WaltherLE etal.
Germany 2011 Agerange
Iwasakiand Yamasoba
Japan 2015 Systematic
review
Welgampola and Colebach
Australia 2001 Didnotanalyze latency
Kurtaranetal. Turkey 2016 Nocontrol Zahang
etal.
China 2014 Agerange
Laymanetal. USA 2015 Agerange Zapalaand
Brey
USA 2004 Agerange
Lietal. USA 2015 Incomplete
dataa
Zunigaetal. USA 2012 Agerange
Maesetal. Belgium 2010 Agerange
aTheauthorswerecontactedbutdidnotprovideadditionalinformationuntilthesubmissionofthisarticle.
Allincludedstudiesarecharacterizedasobservationaland cross-sectionalstudies.Inaddition,inthefinalevaluation, allhadapercentageofqualityequaltoorsuperiorto50% (5/10),whereastwoofthemobtainedamaximumscoreof 70%(7/10).
Onlyonestudyassessedthesamplerepresentativeness,25
as it was a normative study and analyzed all available
subjectsinacertainperiod.Allotherstudiesmadechoices perconveniencegroup.
Thesatisfactorysamplesizeof theelderlygroupwasa concernoffourstudies,33---36 whichconformtothecentral
Table4 Characteristicsofincludedstudies.
Authors Year Place Groupsofadults(years) N(Elderly) Intensity Stimulus Assessment
Akinetal.23 2011 USA GroupI(22---31),GroupII (61---86)
24 90dBNAn TB500Hz cVEMP
Asal39 2016 Egypt GroupII(25---35),Group V(>55)
10 95dBNAn TB500Hz oVEMP
Bastaetal.20 2005 Germany GroupI(20---40),Group III(60---76)
20 90dBNAn Tb500Hz cVEMP
Guillénetal.24 2005 Spain GroupI(11---30),Group III(>60)
10 100dBNAn Click cVEMP
Jankyand Shepard32
2009 USA GroupII(20---29),Group V(>60)
10 98dBNAn TB
500Hz/Click
cVEMP
Feietal.36 2015 China GroupI(20---40),Group III(>60)
20 95dBNAn TB500Hz Botha
Khanetal.25 2014 India GroupII(16---35),Group IV(>55)
9 100dBNAn TB500Hz cVEMP
Kumaretal.33 2015 India Youngadults(21---40), Elderly(>60)
30 100dBNAn TB500Hz oVEMP
Kumaretal.34 2010 India GroupI(21---30),GroupV (>60)
30 99dBNAn Click cVEMP
Leeetal.37 2008 Korea GroupII(20---29),[Group VI(60---69),GroupVII (>70)]b
[21] 95dBNAn Click cVEMP
Malekietal.35 2014 Iran GroupI(19---26),GroupII (>60)
31 95dBNAn TB500Hz cVEMP
Mandaland Barman26
2009 India GroupI(20---30),[Group IV(60---70),GroupV (70---80)]2
[21] 105dBNAn TB500Hz cVEMP
Sardaetal.40 2016 India GroupI(20---30),GroupV (60---70)
10 95dBNAn TP500Hz cVEMP
Singhetal.38 2014 Germany GroupII(20---30),[Group VI(60---70),GroupVII (>70)]2
[40] 105dBNAn TB500Hz cVEMP
Suetal.21 2004 Taiwan GroupII(21---40),Group IV(>60)
20 95dBNAn Click cVEMP
Tourtillott27 2009 USA Youngadults(20---30), Elderly[(65---74), (75---85)]2
[20] 95dBNAn TB500Hz cVEMP
a cVEMPandoVEMPlatencieswereassessed.
b Thegroupswereanalyzedtogether,asthecriterionchosenforthegroupwas>55yearsor>60years.
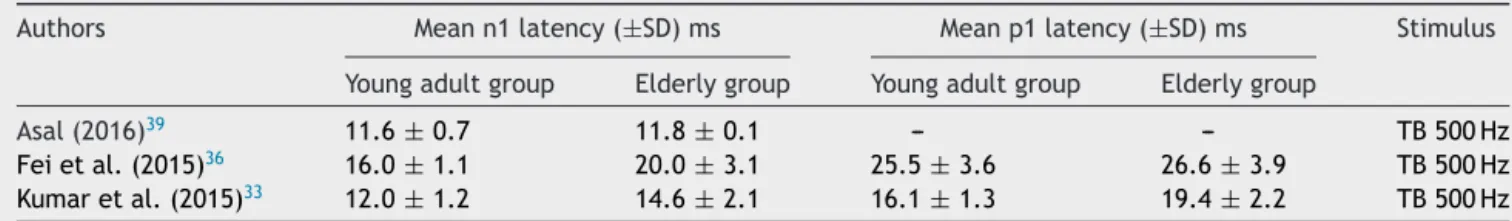
Table5 MeanandstandarddeviationofoVEMPn1andp1latencies,foryoungadultsandfortheelderly,perstudy.
Authors Meann1latency(±SD)ms Meanp1latency(±SD)ms Stimulus
Youngadultgroup Elderlygroup Youngadultgroup Elderlygroup
Asal(2016)39 11.6±0.7 11.8±0.1 --- --- TB500Hz
Feietal.(2015)36 16.0±1.1 20.0±3.1 25.5±3.6 26.6±3.9 TB500Hz
Kumaretal.(2015)33 12.0±1.2 14.6±2.1 16.1±1.3 19.4±2.2 TB500Hz
The non-response rate was satisfactory in 50% of all studies using validated tools for data collection and the comparability between the control group and the elderly groupwasalsopossiblefor allofthem. Theevaluationof theresultswascarriedoutinallthestudiesthroughtheir ownreports, exceptinthetwostudies,33,34 inwhichwave
analysiswascarriedoutbytwoindependentprofessionals. Finally,allstudiesusedappropriatestatisticaltests.
Dataanalysis
Table6 MeansandstandarddeviationsofcVEMPp13andn23latencies,foryoungadultsandfortheelderly,perstudy.
Authors Meanp13latency(±SD)ms Meanp23latency(±SD)ms Stimulus
Youngadultgroup Elderlygroup Youngadultgroup Elderlygroup
Akinetal.(2011)23 15.6±0.8 16.0±1.6 23.2±1.7 23.2±2.0 TB500Hz
Feietal.(2015)36 16.0±1.1 20.0±3.1 25.5±3.3 26.6±3.9 TB500Hz
Guillénetal.(2005)24 11.1±0.1 12.1±0.7 17.6±1.2 20.7±1.9 Click
JankyandShepard(2009)32 a 17.6±3.3 15.2±2.0 23.6±2.3 22.6±2.0 TB500Hz JankyandShepard(2009)32 a 14.5±2.5 17.4±6.692 20.7±2.2 25.3±10.12b Click
Khanetal.(2010)25 11.0±0.9 11.3±1.7 17.3±2.1 17.6±2.2 TB500Hz
Kumaretal.(2010)34 11.4±1.2 13.4±1.5 19.2±2.3 22.3±2.0 Click
Leeetal.(2008)37 13.1±1.6 16.2±2.4 18.8±1.8 21.7±2.8 Click
Malekietal.(2014)35 15.5±1.2 16.4±1.7 24.7±1.8 24.0±2.0 TB500Hz
MandalandBarman(2009)26 14.3±1.6 14.4±2.3 21.0±1.6 20.8±2.9 TB500Hz
Sardaetal.(2016)40 16.5±2.4 21.8±2.9 25.1±2.7 29.1±5.0 TP500Hz
Singhetal.(2014)38 14.4±0.7 17.8±1.2 23.7±0.6 27.3±1.3 TB500Hz
Suetal.(2004)21 11.4±0.8 11.9±0.7 18.2±1.3 19.2±1.4 Click
Tourtillott(2009)27 16.2±1.3 16.0±1.4 24.6±1.1 23.9±2.6 TB500Hz
aItisthesamestudy,whichanalyzedTB500Hzandclicks. b Standarddeviationwasnotprovidedandcalculated.
Study or subgroup Mean SD
Elderly Young adults Mean difference
Total Mean SD Total Weight IV, Random, 95%CI
Mean difference IV, Random, 95%CI
Study or subgroup 1.1.1 New subgroup
Mean SD
Elderly Young adults Mean difference
Total Mean SD Total Weight IV, Random, 95%CI
Mean difference IV, Random, 95%CI
Asal 2016 11.8
20 20
30 10
20 30
10 0.70 [0.61, 0.79] 4.00 [2.56, 5.44] 2.60 [1.99, 3.21] 29.2% 34.7% 36.1% 16 12 11.1 1.1 1.1 0.1 14.6 0.1 3.1 13 Fei et al. 2015
Fei et al. 2015 Guillén et al. 2005 Janky and shepard 2009 Janky and shepard 2009 Khan et al 2005 Akin et al. 2011 Basta et al. 2016 Kumar et al. 2015
Kumar et al. 2010 Lee et al. 2008
Sarda et al. 2016 Singh et al. 2014 Su et al. 2004 Tourtillot 2009 Maleki et al. 2016 Mandal andbarman 2009
Test for overall effect: Z=2.56 (P=0.01)
Heterogeneity. Tau2=2.27; Chi2=56.18, df=2 (P<0.00001); I2=96%
Test for overall effect: Z=3.39 (P=0.0007)
Test for subgroup differences: Not applicable
Heterogeneity. Tau2=1.91; Chi2=182.66, df=14 (P<0.00001); I2=92%
Total (95% CI)
Subtotal (95% CI) 296 326 100.0%
60 60 100.0% 2.32 [0.55, 4.10]
16 16.1 20 20 24 23 20
24 0.40 [–0.32, 1.12] –0.10 [–1.34, 1.14] 4.00 [2.56, 5.44] 6.8% 6.4% 7.6% 16.2 16 15.6 2.5 1.1 0.8 20 1.6 1.6 3.1 12.1 17.4 10 10 10 10 10
11 1.00 [0.56, 1.14]
–2.90 [–1.26, 7.06] –2.40 [–4.79, –0.01] 0.30 [–0.85, 1.45] 2.4% 4.6% 8.0% 14.5 17.6 11.1 1.2 3.3 0.1 15.2 0.7 6.6 2 11.3 13.4 30 21 9 30 17 37
2.00 [1.33, 2.67] 3.10 [2.13, 4.07] 0.90 [0.17, 1.63] 7.7% 7.2% 6.9% 11.4 13.1 11 1.1 1.6 0.9 16.2 1.7 1.5 1.4 31 31
0.10 [–1.03, 1.23] 7.6% 15.5 1.2 16.4 1.7 14.4 21.8 10 40 21 10 40 31
5.30 [2.97, 7.63] 3.40 [2.97, 3.83] 0.50 [0.03, 0.97] 4.7% 8.0% 6.9% 16.5 14.4 14.3 2.4 0.7 1.6 17.8 2.3 2.9 1.2 11.9 16 20 20 12 20
–0.20 [–1.16, 0.76]
1.34 [0.56, 2.11]
7.3% 7.9% 16.2 11.4 1.3 0.8 0.7 1.4 –10 –5
Elderly young adults
0 5 10
–10 –5
Elderly young adults
0 5 10
A -
n1 oVEMP.B -
p13 cVEMP.Figure2 Meta-analysis:comparisonofn1oVEMPandp13cVEMPlatencies.(A)n1oVEMP.(B)p13cVEMP.
and
wave-component
latency
delays
in
oVEMP
and
cVEMP
483
Table7 Qualityofincludedarticles,accordingtothe‘‘Newcastle---Ottawa’’qualityassessmentscale.
Authors Sample repre-sentativeness
Justified samplesizea
Non-response rate
Exposure calculation
Comparability Result assessment
Appropriate statisticaltest
Final assessmentb
Akinetal.(2011)23 Not
representative
No 8.4% Validatedtool Yes Theirown
report
Yes 6/10
Asal(2016)39 Not
representative
No 40%
(non-satisfactory)
Validatedtool Yes Theirown
report
Yes 5/10
Bastaetal.(2005)20 Not
representative
No 0% Validatedtool Yes Theirown
report
Yes 6/10
Guillénetal.(2005)24 Not
representative
No 0% Validatedtool Yes Theirown
report
Yes 6/10
JankyandShepard (2009)32
Not
representative
No 46.7%
(non-satisfactory)
Validatedtool Yes Theirown
report
Yes 5/10
Feietal.(2015)36 Not
representative
No cVEMP10%,
oVEMP5%
Validatedtool Yes Theirown
report
Yes 6/10
Khanetal.(2014)25 Little
representative
No Unclear(per
group)
Validatedtool Yes Theirown
report
Yes 6/10
Kumaretal.(2015)33 Not
representative
Yes 40%
(non-satisfactory)
Validatedtool Yes Two
independent assessments
Yes 7/10
Kumaretal.(2010)34 Not
representative
Yes 43%
(non-satisfactory)
Validatedtool Yes Two
independent assessments
Yes 7/10
Leeetal.(2008)37 Not
representative
No 0% Validatedtool Yes Theirown
report
Yes 6/10
Malekietal.(2014)35 Not
representative
Yes Unclear(per
group)
Validatedtool Yes Theirown
report
Yes 5/10
MandaleBarman (2009)26
Not
representative
No 7.2% Validatedtool Yes Theirown
report
Yes 6/10
Sardaetal.(2016)40 Not
representative
No 40%
(non-satisfactory)
Validatedtool Yes Theirown
report
Yes 5/10
Singhetal.(2014)38 Not
representative
Yes 40%
(non-satisfactory)
Validatedtool Yes Theirown
report
Yes 6/10
Suetal.(2004)21 Not
representative
No 40%
(non-satisfactory)
Validatedtool Yes Theirown
report
Yes 5/10
Tourtillott(2009)27 Not
representative
No 0% Validatedtool Yes Theirown
report
Yes 6/10
Study or subgroup 1.6.1 cVEMP p13 click
Mean SD
Elderly Young adults Mean difference Total Mean SD Total Weight IV, Random, 95%CI
Mean difference IV, Random, 95%CI
Guillén et al. 2005 Janky and shepard 2009 Kumar et al. 2010 Lee et al. 2008 Su et al. 2004
Test for overall effect: Z=2.42 (P=0.02)
Test for subgroup differences: Not applicable Test for subgroup differences: Not applicable
Heterogeneity. Tau2=0.97; Chi2=38.20, df=4 (P<0.00001); I2=90%
Subtotal (95% CI) 91 88 100.0% 12.1
15.2 10
10
10
11 1.00 [0.56, 1.14] –2.90 [–4.79, 0.01] 9.9% 23.9% 17.6 11.1 3.3 0.1 0.7 2 13.4 30 21 30 17
2.00 [1.33, 2.67] 3.10 [2.13, 4.07] 22.4% 20.1% 11.4 13.1 1.1 1.6 16.2 1.5 1.4
0.50 [0.03, 0.97]
11.9 20 20
1.19 [0.23, 2.16] 23.7% 11.4 0.8 0.7 –10 –10 –5
–5 0 5 10
Elderly young adults Elderly young adults
0 5 10
A -
p13 cVEMP (sub-group evoked only by 500 Hz Toneburst).B -
p13 cVEMP (sub-group evoked only by Click). Study or subgroup1.7.1 cVEMP p13 TB 500 Hz Mean SD
Elderly Young adults Mean difference Total Mean SD Total Weight IV, Random, 95%CI
Mean difference IV, Random, 95%CI
Fei et al. 2015 Janky and shepard 2009 Khan et al 2005 Akin et al. 2011 Basta et al. 2016
Sarda et al. 2016 Singh et al. 2014 Tourtillot 2009 Maleki et al. 2016 Mandal andbarman 2009
Test for overall effect: Z=2.51 (P=0.01)
Heterogeneity. Tau2=3.14; Chi2=132.39, df=9 (P<0.00001); I2=93%
Subtotal (95% CI) 205 238100.0% 16 16.1 20 20 24 23 20
24 0.40 [–0.32, 1.12] –0.10 [–1.34, 1.14] 4.00 [2.56, 5.44] 6.8% 6.4% 7.6% 16.2 16 15.6 2.5 1.1 0.8 20 1.6 1.6 3.1
17.4 10 10 –2.90 [–1.26, 7.06]
0.30 [–0.85, 1.45] 2.4%
14.5 1.2 6.6
11.3 9 37
0.90 [0.17, 1.63] 6.9%
11 0.9 1.7
31 31
0.10 [–1.03, 1.23] 7.6% 15.5 1.2 16.4 1.7 14.4 21.8 10 40 21 10 40 31
5.30 [2.97, 7.63] 3.40 [2.97, 3.83] 4.7% 8.0% 6.9% 16.5 14.4 14.3 2.4 0.7 1.6 17.8 2.3 2.9 1.2
16 20 12 –0.20 [–1.16, 0.76]
1.53 [0.33, 2.72] 7.3%
16.2 1.3 1.4
Figure3 Meta-analysis:comparisonofn13cVEMPlatencies,sub-groupsevokedby500HzToneburstandonlybyClick.(A)p13 cVEMP(sub-groupevokedonlyby500HzToneburst).(B)p13cVEMP(sub-groupevokedonlybyClick).
oVEMP:n1andp1latencies
Thenumberofarticlestobemeta-analyzedforoVEMP n1 latencieswassmall,astherewereonlythreeofthem.33,37,38
Themeandelayofthiscomponentforthelatenciesofthe elderlywas2.32mswith95%CIof0.55---4.10ms.Theoverall effecttestshowedp=0.01;disclosingthatsuchdifference wassignificant. However, the heterogeneity I2=96%, with
ap value <0.001(Fig.2A).Finally, duetothesmall num-berofselectedstudies,itwasnotpossibletoanalyzethe subgroupstounderstandtheoriginsofthisheterogeneity.
Ontheotherhand,onlytwoarticleswerefoundforthep1 component,37,38 whichconsiderablyaffected theanalyses,
aspreviouslydescribed,andmadeitsstudyimpossible.
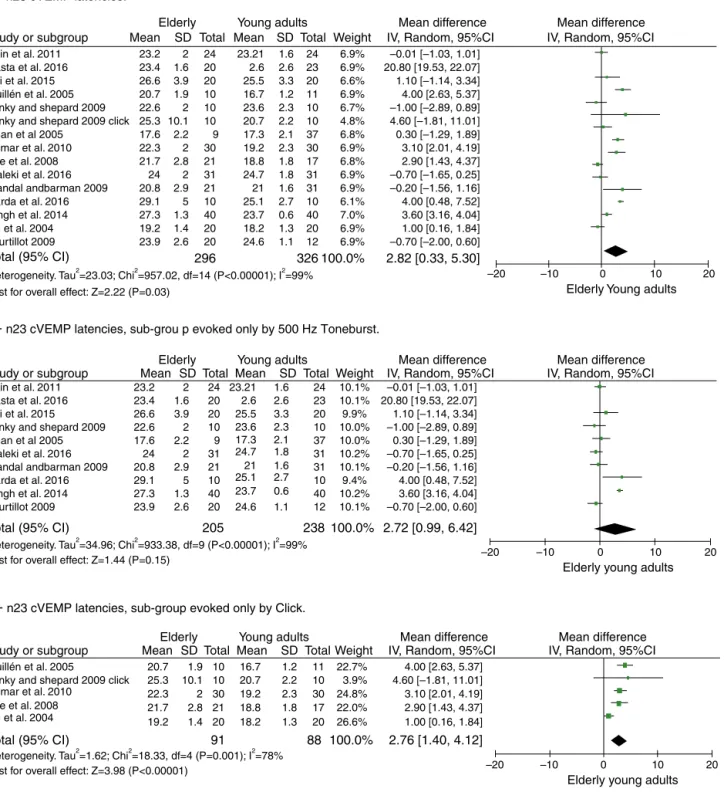
cVEMP:p13andn23latencies
Thenumberofarticlestobemeta-analyzedforcVEMP com-ponentsp13andn23latencieswasquiteencouraging.Thus, 13wereselected(describedinTable7).
Forthep13component,themeandelayforthelatencies intheelderlywas1.34mswith95%CIof0.56---2.11ms.The overalleffecttestshowedp<0.001;disclosingthatsucha
differencewassignificant.However,aheterogeneityvalue ofI2=92%wasfound,withp<0.001(Fig.2B).
Theattemptstoanalyzethesubgroupswerenot success-ful in explainingheterogeneity. When dividing the groups byusedstimulitoevokecVEMP,ToneburstorClick,inboth cases,itremainedhighandwithp<0.001,ascanbeseen inFig.3.Thesamewasdoneforthestimulusintensity(up to95dBNAnand>95dBNAn)andfortheageranges ofthe controlgroups(20---30yearsanddifferent<20---30years),yet bothevaluationswereunsuccessful.
Forcomponentn23,themeandelayforthelatenciesin theelderlywas2.82mswith95%CIof0.33---5.30ms.Thetest fortheoveralleffectshowedap=0.03;disclosingthatthe difference wassignificant. However,a high heterogeneity valueofI2=99%wasfound,withp<0.001(Fig.4A).
Discussion
Study or subgroup Mean SD
Elderly Young adults Mean difference
Total Mean SD Total Weight IV, Random, 95%CI
Mean difference IV, Random, 95%CI
Study or subgroup Mean SD
Elderly Young adults Mean difference
Total Mean SD Total Weight IV, Random, 95%CI
Mean difference IV, Random, 95%CI
Study or subgroup Mean SD
Elderly Young adults Mean difference
Total Mean SD Total Weight IV, Random, 95%CI
Mean difference IV, Random, 95%CI
Fei et al. 2015 Guillén et al. 2005 Janky and shepard 2009 Janky and shepard 2009 click Khan et al 2005
Akin et al. 2011 Basta et al. 2016
Kumar et al. 2010 Lee et al. 2008
Sarda et al. 2016 Singh et al. 2014 Su et al. 2004 Tourtillot 2009 Maleki et al. 2016 Mandal andbarman 2009
Test for overall effect: Z=2.22 (P=0.03)
Heterogeneity. Tau2=23.03; Chi2=957.02, df=14 (P<0.00001); I2=99%
Total (95% CI) 296 326100.0%
23.2 23.4 20 20 24 23 20
24 –0.01 [–1.03, 1.01] 20.80 [19.53, 22.07] 1.10 [–1.14, 3.34] 6.9% 6.6% 6.9% 2.6 25.5 23.21 26.6 2 1.6 3.9 20.7 22.6 10 10 10 10 10
11 4.00 [2.63, 5.37] –1.00 [–2.89, 0.89] 4.60 [–1.81, 11.01] 0.30 [–1.29, 1.89] 6.7% 4.8% 6.9% 23.6 20.7 16.7 25.3 1.9 2 10.1 17.6 22.3 30 21 9 30 17 37
3.10 [2.01, 4.19] 2.90 [1.43, 4.37] –0.70 [–1.65, 0.25] 6.9% 6.8% 6.8% 19.2 18.8 17.3 21.7 2.2 2 2.8 31 31
–0.20 [–1.56, 1.16] 6.9% 24.7 24 2 20.8 29.1 10 40 21 10 40 31
4.00 [0.48, 7.52] 3.60 [3.16, 4.04] 1.00 [0.16, 1.84] 6.1% 7.0% 6.9% 25.1 23.7 21 27.3 2.9 5 1.3 19.2 23.9 20 20 12 20
–0.70 [–2.00, 0.60]
2.82 [0.33, 5.30]
6.9% 6.9% 24.6 18.2 2.6 3.3 1.6 2.3 2.2 1.2 2.3 1.8 1.8 2.1 1.6 0.6 1.3 2.7 1.1 1.4 2.6
Fei et al. 2015 Janky and shepard 2009 Khan et al 2005 Akin et al. 2011 Basta et al. 2016
Sarda et al. 2016 Singh et al. 2014 Tourtillot 2009 Maleki et al. 2016 Mandal andbarman 2009
Test for overall effect: Z=1.44 (P=0.15)
Heterogeneity. Tau2=34.96; Chi2=933.38, df=9 (P<0.00001); I2=99%
Test for overall effect: Z=3.98 (P<0.00001)
Heterogeneity. Tau2=1.62; Chi2=18.33, df=4 (P=0.001); I2=78%
Total (95% CI)
Total (95% CI)
100.0% 100.0% 238 205 91 88 23.2 23.4 20 20 24 23 20
24 –0.01 [–1.03, 1.01] 20.80 [19.53, 22.07] 1.10 [–1.14, 3.34] 10.1% 9.9% 10.1% 2.6 25.5 23.21 26.6 2 1.6 3.9
22.6 10 10 –1.00 [–2.89, 0.89]
0.30 [–1.29, 1.89] 10.0%
23.6 2
17.6 9 37
–0.70 [–1.65, 0.25] 10.0%
17.3 2.2
31 31
–0.20 [–1.56, 1.16] 10.2% 24.7 24 2 20.8 29.1 10 40 21 10 40 31
4.00 [0.48, 7.52] 3.60 [3.16, 4.04] 9.4% 10.2% 10.1% 25.1 23.7 21 27.3 2.9 5 1.3
23.9 20 12 –0.70 [–2.00, 0.60]
2.72 [0.99, 6.42]
2.76 [1.40, 4.12]
10.1% 24.6 2.6 3.3 1.6 2.3 1.8 2.1 1.6 0.6 2.7 1.1 2.6
4.00 [2.63, 5.37]
10 11
4.60 [–1.81, 11.01] 22.7% 16.7 20.7 1.9 25.3 22.3 30 21 10 30 17 10
3.10 [2.01, 4.19] 2.90 [1.43, 4.37] 24.8% 22.0% 3.9% 19.2 18.8 20.7 21.7 10.1 2 2.8
19.2 20 18.2 20 26.6% 1.00 [0.16, 1.84] 1.2 2.2 1.8 2.3 1.3 1.4 –20 –10
Elderly Young adults
0 10 20
–20 –10
Elderly young adults
0 10 20
–20 –10
Elderly young adults
0 10 20
Guillén et al. 2005
Janky and shepard 2009 click Kumar et al. 2010
Lee et al. 2008 Su et al. 2004
A –
n23 cVEMP latencies.B –
n23 cVEMP latencies, sub-grou p evoked only by 500 Hz Toneburst.C –
n23 cVEMP latencies, sub-group evoked only by Click.Figure4 Meta-analysis:comparisonofn23cVEMPlatencies,n23cVEMPsub-groupevokedonlyby500HzToneburstandn23cVEMP sub-groupevokedonlybyClick.(A)n23cVEMPlatencies.(B)n23cVEMPlatencies,sub-groupevokedonlyby500HzToneburst.(C) n23cVEMPlatencies,sub-groupevokedonlybyClick.
reflexinthe1990s.21 Studiespublishedatthattimemostly
reportedonthe methodsusedand studiesin guineapigs. Fromtheyear2000articlesstartedtobepublishedaboutthe clinicalapplications,studiesthatinvolvedpathologies aim-ingtoassesstheeffectivenessofvestibularevokedmyogenic potentials.21
Regarding the test protocols, thearticles studied used strongintensitystimuli,rangingfrom90to105dBNAn; how-ever, only two studies usedthe lowest intensity.20,23 Most
chose to evoke VEMP with Toneburst stimuli, corroborat-ingthe literaturethat recommends the use ofToneburst, because the threshold of saccular excitability is smaller whencomparedtotheclick,beingmorecomfortableforthe assessedsubject,inadditiontohavingabetterdefinitionof wavesand greater responseamplitude.23---27 Regardingthe
The methodologicalqualityofthe studieswas satisfac-tory,attainingatleast50%ofthemaximumscore.Thefact thatonlyone study25 did notuseconvenience samplingis
afactofconcernandverycommoninscientificstudies,as theydonotallowthecreationofrepresentativesamples.On theotherhand,allstudiesusedvalidatedtoolsfordata col-lectionandappropriatestatisticaltests,20,21,23---27,32---40which
shows a greaterconcern withthe qualityof their quanti-tative analyses. A simple methodological adjustment can be observed in the studies, such as those performed in two articles32,33 with wave analysis by two independent
researchers,whichhelpedthemtoincreasethequalityto themaximumfoundinthepresentsystematicreview.
Accordingtothefindings,thenVlatencycomponentof oVEMPandthep13andn23componentsofcVEMPweremore delayed in the elderly than in young adults, as reported by all selected oVEMP studies33,37,38 and in five cVEMP
studies,34,36,38---40showingthatitmaybeassociatedwiththe
reduction in the number of neurons with advancing age, especially for subjects older than 60 years. In addition, advancedage and itsassociation withthe changesin the latency ofthe studied component due toaforementioned loss of neurons would have significant implications in the vestibularnucleus,whichcouldbeassociatedwithbalance deteriorationintheelderly.Finally,itisquitereasonableto affirm,basedontheresultsoftheothercomponents stud-iedandifthereweresufficientarticles,thatthep1wave componentofoVEMPwillmostlikelyalsobedelayedinthe elderly.33,37,38
Conclusion
ThelatencyofoVEMPn1wavecomponentandthelatencies ofcVEMPp13andn23 wavecomponentsarelongerinthe elderlyaged60yearsorolderthaninyoungadults.
Conflicts
of
interest
Theauthorsdeclarenoconflictsofinterest.
References
1.PapathanasiouE, MurofushiT, AkinFW,ColebatchJG. Inter-national guidelines for the clinical application of cervical vestibular evoked myogenic potentials: an expert consensus report.ClinNeurophysiol.2014;125:658---66.
2.RibeiroS,AlmeidaRR,CaovillaHH,Gananc¸aMM.Dospotenciais evocadosmiogênicosvestibularesnasorelhascomprometidae assintomáticanaDoenc¸adeMénièreunilateral.BrazJ Otorhi-nolaryngol.2005;71:60---6.
3.Young YH. Potential application of ocular and cervical vestibular-evokedmyogenicpotentialsinménière’sdisease:a review.Laryngoscope.2013;123:484---91.
4.OliveiraAC,DavidR,ColafêminaJF.PotencialMiogênico Evo-cadoVestibular:Metodologiaderegistroemhomensecobaias. BrazJOtorhinolaryngol.2008;74:770---5.
5.Wang HM,TsaiSM,ChienCY,Ho KY.Analysisofauditoryand vestibular function in patientswithunilateral Meniere’s dis-ease.ActaOto-Laryngol.2012;132:1246---51.
6.CarnaúbaATL,LinsOG,SoaresIA,AndradeKCL,MenezesPL. Potencialmiogênicoevocadovestibularesuasimplicac¸õesno domíniodasfrequências.ACR.2013;18:245---9.
7.ColebatchJG, Halmagyi GM. Vestibular evokedpotentials in humanneckmusclesbeforeandafterunilateralvestibular deaf-ferentation.Neurology.1992;42:1635---6.
8.Rauch SD. Vestibular evokedmyogenic potentials.Curr Opin OtolaryngolHeadNeckSurg.2006;14:299---304.
9.Sheykholeslami K, Murofushi T, Kermany MH, Kaga K. Bone-conducted evokedmyogenic potentialsfrom the stern-ocleidomastoidmuscle.ActaOtolaryngol.2000;120:731---4. 10.KingmaH.Functiontestsoftheotolithorstatolithsystem.Curr
OpinNeurol.2006;19:21---5.
11.Welgampola MS, Colebatch JG. Characteristics and clinical applicationsofvestibularevokedmyogenicpotentials. Neurol-ogy.2005;64:1682---8.
12.WuytsFL,FurmanJ,VanspauwenR,VandeHeyningP.Vestibular functiontesting.CurrOpinNeurol.2007;20:19---24.
13.ColebatchJG.Vestibularevokedpotentials.CurrOpinNeurol. 2001;14:21---6.
14.OchiK,OhashiT,NishinoH.Varianceofvestibular-evoked myo-genicpotentials.Laryngoscope.2001;111:522---7.
15.AbdeltawwabMM. Ocularvestibularevoked myogenic poten-tialstoair conductedtonebursts inpatientswithunilateral definiteMénière’sdisease.IntAdvOtol.2013;92:180---5. 16.Young YH. Potential application of ocular and cervical
vestibular-evokedmyogenicpotentialsinMénière’sdisease:a review.Laryngoscope.2013;123:484---91.
17.Sartucci F, Logi F.Vestibular evoked myogenicpotentials: a methodtoassessvestibulo-spinalconductioninmultiple scle-rosispatients.BrainResBull.2002;59:59---63.
18.Felipe L, Gonc¸alves DU, Santos MAR, Proietti FA, Ribas JGR,Carneiro-ProiettiAB, et al.Vestibular-evokedmyogenic potential (VEMP) to evaluate cervical myelopathy in human T-cell lymphotropic virus type I infection. Spine. 2008;33: 1180---4.
19.RosengrenS,WelgampolaM,ColebtahJ.Vestibularevoked myo-genicpotentials:past,presentandfuture.ClinNeurophysiol. 2010;12:636---51.
20.BastaD,Todt I,Ernst A. Normativedata for P1/N1--- laten-ciesofvestibularevokedmyogenicpotencialsinducedby air-orbone-conducted tonebursts.ClinNeurophysiol. 2005;116: 2216---9.
21.Su H,Huang T, YoungY, ChengP. Agingeffecton vestibular evokedmyogenicpotential.OtolNeurotol.2004;25:977---80. 22.Ochi K, Ohashi T. Age-related changes in the
vestibular-evoked myogenic potentials. Otolaryngol Head Neck Surg. 2003;129:655---9.
23.AkinFW,MurnaneOD,Tampas JW,ClinardCG.Theeffectof ageon thevestibular evoked myogenicpotential and stern-ocleidomastoidmuscletonicelectromyogram level.EarHear. 2011;32:617---22.
24.GuillénVP,GarcíaEG,Pi˜neroAG,DelReyAP,PérezCM, Gar-riguesHP.Vestibularevokedmyogenicpotential:acontribution tothevestibularphysiologyandpathologyknowledge. Quanti-tativepatternsinhealthysubjects.ActaOtorrinolaringolEsp. 2005;56:349---53.
25.Khan FK,Balraj A, Lepcha A. Normative datafor vestibular evokedmyogenicpotentialindifferentagegroupsamonga het-erogeneousIndianpopulation.IndianJOtolaryngolHeadNeck Surg.2014;66:149---54.
26.Mandal V, Barman A. Effect of ageing on vestibular evoked myogenicpotential.Dissertationpart---A,Audiology,vol.VIII. Mysore:AIISH;2009---2010.p.276---83.
27.TourtillottBM.Age-relatedchangesinvestibularevoked myo-genic potentials and dynamic visual acuity at near and far distances. TheDissertation Committee for Brandon M. Tour-tillott,Major(sel),USAF,BSC,M.S.,CCC-A;2009.
29.SterneJAC,EggerM,MoherD.In:HigginsJPT,ChichesterGS, editors. Cochran handbook for systematic reviews of inter-ventions.UK: Wiley;2008. p. 297---334.Addressing reporting biases.
30.HigginsJPT,Altman DG,SterneJAC. Assessingriskofbias in includedstudies. In: Higgins JPT, Green S, editors.Cochran handbook for systematic reviews of interventions Version 5.1.0.2016.Availableat:http://www.cochrane-handbook.org [Accessed07.02.16].
31.WellsG,SheaB,O’ConnellJ,RobertsonJ,WelchV,LososM, etal.TheNewcastle-OttawaScale(NOS)forassessingthe qual-ityofnonrandomisedstudiesinmeta-analysis.Availablefrom: http://www.ohri.ca/programs/clinicalepidemiology/oxford. htm[Accessed01.04.11].
32.Janky KL, Shepard N. Vestibular evoked myogenic poten-tial(VEMP) testing:normativethreshold responsecurvesand effectsofage.JAmAcadAudiol.2009;20:514---22.
33.KumarK,Bhat JS,Sequeira NM, BhojwaniKM.Ageingeffect onair-conductedocularvestibularevokedmyogenicpotential. AudiolRes.2015;5:121.
34.KumarK,BhatJS,SinhaSK.Effectofagingonvestibularevoked myogenicpotential.JIndianSpeechHearAssoc.2010;24:25---8. 35.MalekiM,JafariZ,ZarrinkoobH,BaghbanAA.Effectofaging onsaccularfunction.MedJIslamRepubIran.2014;22:28---117. 36.LiF,ZhuangJ,ChenY,ZhouX.Effectsofagingonvestibular evokedmyogenicpotential.JClinOtorhinolaryngolHeadNeck Surg.2015;29:1992---4.
37.LeeSK,ChaC,JungST,ParkDC,YeoSG.Age-relateddifferences inparametersofvestibularevokedmyogenicpotentials.Acta Otolaryngol.2008;128:66---72.
38.Singh NK,KashyapRS, SupreethaL. Characterizationof age-relatedchangesinsacculocolicresponseparametersassessed bycervical vestibular evoked myogenic potentials. EurArch Otorhinolaryngol.2014;271:1869.
39.Asal S. Effect of age on ocular vestibular-evoked myogenic potentials using air-conducted sound. Egypt J Otolaryngol. 2014;30:166---70.