*Correspondence: Kanakapura Basavaiah. Department of Chemistry, Univer-sity of Mysore. Manasagangotri, Mysuru-570006, Karnataka, India. Tel.: +91-8212419659. Fax: +91-8212516133. E-mail: [email protected]
A
vol. 51, n. 1, jan./mar., 2015 http://dx.doi.org/10.1590/S1984-82502015000100005
Titrimetric and spectrophotometric assay of diethylcarbamazine
citrate in formulations using iodate and iodide mixture as reagents
Nagaraju Swamy, Kudige Nagaraj Prashanth, Kanakapura Basavaiah
*Department of Chemistry, University of Mysore, Manasagangotri, Mysuru, Karnataka, India.
One titrimetric and two spectrophotometric methods are proposed for the determination of diethylcarbamazine citrate (DEC) in bulk drug and in formulations using potassium iodate and potassium iodide as reagent. The methods employ the well-known analytical reaction between iodate and iodide in the presence of acid. In titrimetry (method A), the drug was treated with a measured excess of thiosulfate in the presence of unmeasured excess of iodate-iodide mixture and after a standing time of 10 min, the surplus thiosulfate was determined by back titration with iodine towards starch end point. Titrimetric assay is based on a 1:3 reaction stoichiometry between DEC and iodine and the method is applicable over 2.0–10.0 mg range. The liberated iodine is measured spectrophotometrically at 370 nm (method B) or the iodine-starch complex measured at 570 nm (method C). In both methods, the absorbance is found to be linearly dependent on the concentration of iodine, which in turn is related to DEC concentration. The calibration curves are linear over 2.5-50 and 2.5-30 µg mL-1 DEC for method B and method C, respectively. The calculated molar absorptivity and Sandell sensitivity values were 6.48×10³ L mol-1 cm-1 and 0.0604 µg cm-2, respectively, for method B, and their respective values for method C are 9.96×10³ L mol-1 cm-1 and 0.0393 µg cm-2. The intra-day and inter-day accuracy and precision studies were carried out according to the ICH guidelines. The methods were successfully applied to the analysis of DEC formulations.
Uniterms: Diethylcarbamazine citrate/determination. Titrimetry/quantitative analysis. Spectrophotometry/ quantitative analysis. Pharmaceutical formulations/analysis.
Propõem-se titulação e dois métodos espectrofotométricos para a determinação de citrato de dietilcarbamazina (DEC) a granel e em suas formulações, usando iodato de potássio e iodeto de potássio como reagente. Os métodos utilizam a reação analítica conhecida entre iodato e iodeto, na presença de ácido. Na titulometria (Método A), o fármaco foi tratado com excesso medido de tiossulfato, na presença de excesso não medido de mistura iodato-iodeto e, depois de um tempo de repouso de 10 min, o excesso de tiossulfato foi determinado por titulação de retorno com iodo até o ponto inal com amido. A titulação é baseada em reação com estequiometria 1:3 entre DEC e iodo e o método é aplicável na faixa de 2.0-10.0 mg. O iodo liberado é medido espectrofotometricamente a 370 nm (método B) ou o complexo de iodo-amido medido a 570 nm (método C). Em ambos os métodos, a absorvância é considerada linearmente dependente da concentração de iodo, a qual, por sua vez, está relacionada à concentração de DEC. As curvas de calibração são lineares para concentrações de DEC de 2.5-50 e 2.5-30 mg mL- 1 para o método B e para o método C, respectivamente. A absortividade molar calculada e os valores de sensibilidade Sandel foram 6.48×10³ L mol-1 cm- 1 e 0.0604 ug cm-2, respectivamente, para o método B, e os seus respectivos valores para o método C são 9.96×10³ L mol-1 cm-1 e 0.0393 mg cm-2. Os estudos de exatidão e precisão intra-dia e inter-dia foram realizados de acordo com as diretrizes da ICH. Os métodos foram aplicados com sucesso na análise de formulações de DEC.
INTRODUCTION
Diethylcarbamazine citrate (DEC) [Figure 1], chemically known as [N,N -diethyl-4-methyl-1-piperazinecarboxamide citrate] is an anthelmintic agent
used in the treatment of ilarial infections caused by a host
of organisms commonly found in the tropics (Swinyard, 1990). It is also the alternative drug of choice in Onchocerca volvulus infections and tropical eosinophilia (Adkiwu, Ofokansi, Attama, 1999). The drug is official in British Pharmacopoeia [BP] (1988), which describes a non-aqueous titration method for its determination and also
oficial in the United States Pharmacopoeia [USP] (United
States Pharmacopoeia, Monographs), which uses a liquid chromatographic technique with phosphate buffer system for the assay.
Other than these official methods, a variety of techniques have been reported for the determination of DEC in pharmaceutical dosage forms, and include gas chromatography [GC] (Ramana, Raghuveer, Khadgapathi, 1986; Nene, Anjaneyalu, Rajagopalan, 1984; Pfaff, Gayral, Mahuzier, 1978; Joseph, Lawrence, 2001), high performance liquid chromatography [HPLC] (Mathew, Kalyanasundaram, 2001; Reddy et al., 2011; Krishna Vamsi et al., 2012), proton magnetic resonance [PMR] spectroscopy (El-Obeid, 1984, Jezzy et al., 1996), DC polarography analysis (Walash et al., 1985), ion selective electrode potentiometry (Campbell et al., 1980) and titrimetry (Abigail et al., 2011; Bhanumathi et al., 1981). However, many of the reported methods for DEC, particularly, the chromatographic methods are complex, requiring expensive instrumental set up and skilled operator which are not always found in laboratories of developing and under developed countries. Thus, the need for a simple, selective and low-cost method is obvious, especially for routine quality control analysis of pharmaceuticals containing DEC.
Several spectrophotometric methods based on diverse chemical reactions are found in the literature for DEC. Charge-transfer complex formed with iodine was used by Wahbi, El-Obeid, Gad-Kariem (El-Obeid,
Gad-Kariem, 1986), for the assay of 1-6 μg mL–1 DEC
N N
N HOOC COOH
COO HO O
CH3
H
FIGURE 1 - Structure of diethylcarbamazine citrate.
in tablets. Chloranilic acid has been employed by two groups of workers (Rizk, Walash, Ibrahim, 1984; Michael, Kenneth, Anthony,1999) as CT complexing agent for the assay of drug in pharmaceuticals based on the same type of reaction. In a method reported by Basu and Dutta (1961), the ion associate formed by DEC with ammonium
reineckate at pH 3.5 was iltered, dissolved in acetone and
absorbance measured at 525 nm. The colored condensation product (Refaat et al., 1987) formed by malonic acid with acetic anhydride in the presence of DEC was measured at 333 nm facilitating the assay of the drug in dosage forms. In a similar method (Bulbule, Kasture, Wadodkar,1981), the base form of the drug was reacted with malonic acid and acetic anhydride at 80 °C for 30 min and the resulting condensation product was measured at 334 nm. The yellow colored condensation product (Bhuee et al., 1981) formed by an acetous solution of DEC with acetic anhydride-pyridine mixture was measured at 428 nm and used for
the determination of DEC in 10-100 μg mL–1 range in
commercial tablets.
There are three reports on the use of ion-pair complexation reactions for the spectrophotometric assay of DEC. Rao and Subramanyam (1970) employed bromophenol blue at acidic pH as the ion pair complexing agent for the determination of the drug in tablets and
biological luids. The drug in tablets, syrups and parenterals
was determined by extracting the ion-pair complex formed with bromocresol green (Vadodaria, Vora, Mukherji,1968) at pH 4.6 with chloroform. The colored complexes of the drug with Fast green FCF at pH 5.0 and orange II in 0.1 M HCl were successfully employed by Sastry et al. (1988), for the determination of DEC in bulk drug and pharmaceutical preparations by extractive spectrophotometry.
The reported spectrophotometric methods suffer from one or the other disadvantage such as poor sensitivity and narrow linear range (Michael, Kenneth, Anthony, 1999), tedious and time-consuming steps like precipitation,
iltration and washing (Basu, Dutta, 1961), heating (Refaat
et al., 1987; Bulbule, Kasture, Wadodkar,1981; Bhuee et al., 1981). The extraction methods (Rao, Subrahmanyam, 1970; Vadodaria, Vora, Mukherji,1968; Sastry et al., 1988) though sensitive suffer from disadvantages like laborious liquid-liquid extraction step, critical pH adjustment, critical dependence on pH of the aqueous phase and the aqueous-organic phase’s ratio. Additionally, incomplete extraction of the analyte may lead to erratic results. Hence, there is a need for developing a method free from such disadvantages.
using iodate and iodide as reagents. Iodide of the mixture present is oxidized by iodate in an amount equivalent to the COOH group present in citrate in DEC to iodine and the liberated iodine is determined. The methods were successfully applied to quantify DEC in pharmaceutical formulations.
MATERIAL AND METHODS
Apparatus
A Systronics model 166 digital spectrophotometer (Systronics, Ahmedabad, Gujarat, India) with matched 1-cm quartz cells was used for absorbance measurements.
Reagents and standards
All chemicals used were of analytical reagent grade and distilled water was used to prepare solutions.
Potassium iodate
A high purity grade of the chemical (Merck, Mumbai, India) was used. A saturated solution of potassium iodate was prepared by stirring approximately 20 g of the chemical in a beaker containing 100 mL water with the help of magnetic stirrer for 60 minutes. The solution was decanted
and iltered using quantitative ilter paper.
Potassium iodide
A saturated solution of potassium iodide (Merck, Mumbai, India) was prepared just before use in order to prevent atmospheric oxidation to iodide.
Sodium thiosulphate
A 0.01 N sodium thiosulphate (S.D. Fine Chem., Mumbai, India) was prepared by dissolving 1.25 g in 500 mL water and standardized against 0.01N potassium dichromate (Vogel, 1961).
Iodine solution
A 0.01 N iodine solution (Merck, Mumbai, India) was prepared by dissolving 5 g of iodate-free potassium iodide in 30-40 mL of water in a glass stoppered 500 mL
calibrated lask. Weighed out 0.63 g of analytical reagent
(AR) grade or resublimed iodine on a watch glass and
transferred into a lask containing concentrated potassium
iodide by means of a small dry funnel, inserted the glass
stopper into the lask, and shaken well in the cold condition
until all the iodine has dissolved. Allowed the solution to acquire room temperature, and made up to mark with
distilled water in a 500 mL calibrated lask (Vogel, 1961).
Saturated Borax
Approximately 30 g of borax (S.D. Fine Chem., Mumbai, India) were dissolved in 100 mL water and stirred with the help of magnetic stirrer for 15 minutes. The
solution was decanted and iltered. The pH of the solution
was between 8 and 9.
1% starch
Made a paste of 1 g of the soluble starch (Potato starch, Loba Chemie, Mumbai, India) with a little water, and poured the paste with constant stirring, into 100 mL of boiling water, and boiled for 1 min., allowed the solution to cool before use and prepared afresh every day (Vogel, 1961).
Standard drug solution
Pharmaceutical grade DEC (99.7 per cent pure) was procured from Inga Laboratories Pvt. Ltd., Mumbai, India, and was used as received. Banocide forte tablets (Glaxo Smith Kline Pharma. Ltd., Nashik, India) and Banocide syrup (Glaxo Smith Kline Pharma. Ltd., Bangalore, India) both were purchased from local commercial stores.
A stock standard solution equivalent to 1 mg mL-1 DEC for method A was prepared by dissolving 250 mg of pure drug in water and diluting to 250 mL in calibrated flask with water. The stock solution was diluted appropriately to get working concentration of 100 µg mL-1
with water for spectrophotometric methods.
Recommended procedures
Method A
A 10 mL aliquot of pure DEC solution containing
2-10 mg of DEC was taken in an Erlenmeyer lask. Five
mL each of saturated solutions of KIO3 and KI followed by 10 mL thiosulfate (accurately measured) were added
and the lask was stoppered and let stand for 10 min with
occasional swirling. Finally, 1 mL of 1% starch indicator was added and unreacted thiosulfate was titrated against standard iodine solution until the decoloration of blue color.
The amount of DEC was calculated from the following formula:
W {(B – S) × M × C} Amount (mg) =
n
Method B
Varying aliquots (0.25-5.0 mL) of 100 µg mL-1 DEC was added in to a series of 10 mL calibrated flasks by
means of micro burette. To each lask, 1.5 mL of KIO3 and
1 mL of KI were added lasks stoppered, content mixed
and let stand for 15 min. Then 1 mL of saturated borax was added and made up to the mark with water. Absorbance of each solution was measured at 370 nm against reagent blank.
Method C
Different volumes (0.2-3.0 mL) of 100 µg mL-1 DEC
were taken in a series of 10 mL calibrated lasks. One mL
each of saturated KIO3 and KI solutions were added, lasks
were stoppered and content mixed. The lasks were let
stand for 15 min before adding 1 mL of saturated borax
and 1 mL of 1% starch to each lask and inally made up
to 10 mL with water. Absorbance of each solution was measured at 570 nm against reagent blank.
S t a n d a r d g r a p h w a s p r e p a r e d b y p l o t t i n g the absorbance versus drug concentration, and the concentration of the unknown was computed from the respective regression equation.
Procedure for tablets
Twenty tablets were weighed accurately and ground into a fine powder. An accurately weighed amount of the powdered tablet equivalent to 100 mg of DEC was
transferred into a 100 mL calibrated lask. Sixty mL water
was added and the content was shaken thoroughly for 15-20 min to extract the drug into the liquid phase; the volume
was inally diluted to the mark with water, mixed well and iltered using a Whatman No. 42 ilter paper. An aliquot of
the iltrate (1 mg mL-1 DEC) was used for method A and
diluted to required concentrations and used for the assay in method B and method C as described above.
Procedure for syrup
The content of ive 100 mL syrup bottles was pooled
and 5 mL syrup containing 120 mg DEC was taken and its solution prepared as described in ‘procedure for tablets’. This 1.2 mg mL-1 DEC syrup extract was further diluted to get working standard solution of 100 µg mL-1 for method
B and method C with water and analyzed by taking an appropriate volume in all the methods.
Procedure for the analysis of placebo blank and synthetic mixture
A placebo blank containing starch (45 mg), acacia (35 mg), sodium citrate (40 mg), hydroxyl cellulose (45 mg), magnesium stearate (50 mg), talc (40 mg) and
sodium alginate (35 mg) was prepared by mixing all the components into a homogeneous mixture. A 100 mg of the placebo blank was accurately weighed and its solution was prepared as described under ‘tablets’, and then subjected to analysis by following the general procedures.
To 50 mg of the placebo blank of the composition described above, 100 mg of DEC was added and
homogenized, transferred to a 100 mL calibrated lask and
the solution was prepared as described under “Procedure for tablets”, and then subjected to analysis by the procedure described above. This analysis was performed to study the interference by excipients normally present in tablet preparation.
RESULTS AND DISCUSSION
Preliminary experiments showed that DEC is
suficiently acidic to release iodine from iodate-iodide
mixture allowing the titrimetric and spectrophotometric determination of drug. Iodide present is oxidized by iodate in an amount equivalent to the COOH group present in citrate in DEC to iodine and the liberated iodine is determined. In titrimetry, the liberated iodine was reacted with a measured excess of thiosulphate and residual reductant was titrated with iodine and the end point being located visually with starch, while in spectrophotometry, it was determined by two different color reactions.
Method development
Method A
The quantitative nature of the reaction between DEC and iodate-iodide reagent was checked by treating 2.0-10.0 mg of drug with an excess of reagent and determining the iodine released. For the range studied (2.0-10.0 mg), 5.0 mL each of saturated solution of iodate and iodide and reaction time of 10 min were found adequate. The end point was located visually using starch. The reaction stoichiometry is 1:3 (drug: liberated iodine), the COOH group in the citrate is acidic enough to liberate iodine.
IO3ˉ + 5I ˉ + 6H+ (DEC) → 3I2 + 3H2O
I2 + 3Na2S2O3 (excess) → 2NaI + Na2S4O6 + unreacted Na2S2O3
unreacted Na2S2O3 + starch > < Iodine
Method B and method C
in the beginning and iodine continued to be liberated even after 15 min. Since most of the iodine was liberated within 15 min, the reaction was stopped by adding borax to the reaction mixture after a standing time of 15 min. The absorbance remained constant for 25 and 45 min in method B and method C, respectively. Attempts to hasten the reaction by heating were unsuccessful owing to the volatility of iodine and dissociation of iodine-starch complex at elevated temperature.
The possible reaction schemes responsible for change in absorbance as a function of DEC concentration are represented below:
IO3ˉ + 5Iˉ + 6H+ (DEC)
→ 3I2 + 3H2O
(Method B: measured at 370 nm) I2 + Starch → I2-Starch complex
(Method C: measured at 570 nm)
VALIDATION PROTOCOL
Linearity, detection and quantification limits
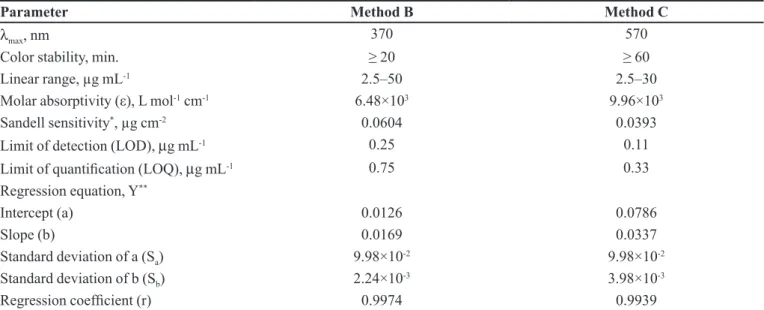
Under the optimum conditions, a linear relation was obtained between absorbance and concentration of DEC in the ranges given in Table I. The calibration graph in each instance is described by the equation:
Y = a + b X
where Y = absorbance, a = intercept, b = slope and X = concentration in µg mL-1). The correlation coeficient, intercept and slope for the calibration data are summarized in Table I. Sensitivity parameters such as apparent molar absorptivity and Sandell sensitivity values, the limits of
detection (LOD) and quantiication (LOQ) are calculated
as per the current ICH guidelines (ICH guidelines, 1996)
and compiled in Table I. LOD and LOQ were calculated
according to the same guidelines using the following formulae:
3.3
LOD S
σ ×
= & LOQ 10 S
σ × =
where σ is the standard deviation of six reagent blank
determinations and s is the slope of the calibration curve,
also molar absorptivity (ε) and Sandell sensitivity (SS)
were calculated using the relation;
3 W ΔA × M × 10 ε =
ppm &
9 W 0.001 × M × 10 SS =
ε × 1000
where ∆A is the change in absorbance, Mw is the molecular
weight of DEC and ppm is the concentration of DEC.
Selectivity
The results obtained from placebo blank and synthetic mixture analyses revealed that inactive ingredients used in the tablet preparation did not interfere in the assay of active ingredient. The absorbance values obtained from the placebo blank solution were almost equal to the absorbance of the blank which revealed no interference from the adjuvants. To study the role of additives added to the synthetic sample, the analysis of synthetic mixture solution prepared as described earlier yielded percent recoveries of 98.9±2.13, 99.2±1.36 and 102.31±1.29 (n=5) for method A, method B, and method C, respectively. This demonstrates the accuracy as well as the precision of the proposed methods and complements the findings of the placebo blank analysis with respect to selectivity.
Precision
The precision of the method was calculated in terms 0
0.1 0.2 0.3 0.4 0.5
360 370 380 390 400 410 420 430 440 450
Wavelength, nm
Absorbance
Absorbance
0 0.1 0.2 0.3 0.4 0.5
460 480 500 520 540 550 560 570 580 590 600 620
Wavelength, nm
(b) (a)
FIGURE 2- (a) Absorption spectra of DEC-iodide complex () [20 µg mL-1 DEC] and blank (-); (b) Absorption spectra of
of intermediate precision (intra-day and inter-day) (ICH guidelines, 1996).Three different concentration of DEC were analyzed in seven replicates during the same day
(intra-day precision) and ive consecutive days (inter-day
precision). The RSD (%) values of intra-day and inter-day studies showed that the precision was good (Table II).
Accuracy
The accuracy of an analytical method expresses the closeness between the reference value and the found
value. Accuracy was evaluated as percentage relative error between the measured concentrations and taken concentrations for DEC. The results obtained are compiled in Table II and show that the accuracy is satisfactory for all the methods.
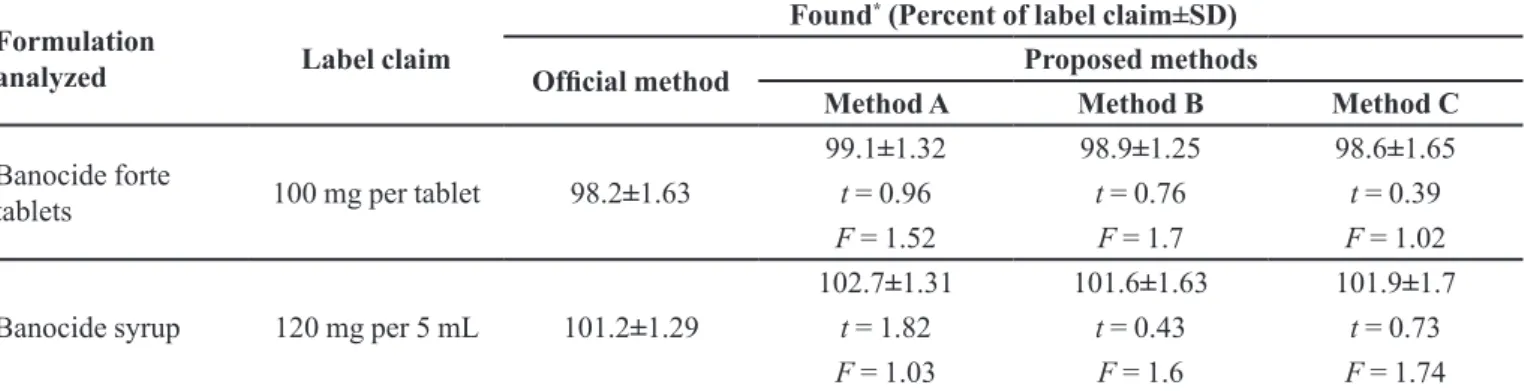
Application to analysis of tablets and syrup
The proposed methods were applied to determine DEC in one brand each of tablets and syrup. The results
were statically compared with those obtained by the oficial
TABLE I - Sensitivity and regression parameters of spectrophotometric methods
Parameter Method B Method C
λ
max, nm 370 570
Color stability, min. ≥ 20 ≥ 60
Linear range, µg mL-1 2.5–50 2.5–30
Molar absorptivity (ε), L mol-1 cm-1 6.48×10³ 9.96×10³
Sandell sensitivity*, µg cm-2 0.0604 0.0393
Limit of detection (LOD), µg mL-1 0.25 0.11
Limit of quantiication (LOQ), µg mL-1 0.75 0.33
Regression equation, Y**
Intercept (a) 0.0126 0.0786
Slope (b) 0.0169 0.0337
Standard deviation of a (Sa) 9.98×10⁻² 9.98×10⁻²
Standard deviation of b (Sb) 2.24×10⁻³ 3.98×10⁻³
Regression coeficient (r) 0.9974 0.9939
*Limit of determination as the weight in µg mL-1 of solution, which corresponds to an absorbance of A = 0.001 measured in a
cuvette of cross-sectional area 1 cm2 and l = 1 cm. **Y=a+bX, Where Y is the absorbance, X is concentration in µg mL-1, a is
intercept and b is slope.
TABLE II - Evaluation of Intra-day and inter-day accuracy and precision
Method *DEC
Taken
Intra-day accuracy and precision (n=7) Inter-day accuracy and precision (n=7)
*DEC
Founda
RSDb
%
REc
%
*DEC found
RSDb
%
REc
%
A
3.0 2.95 1.02 1.67 2.93 1.54 2.33
6.0 5.89 1.76 1.73 5.81 2.58 3.26
9.0 8.89 0.95 1.11 9.11 1.29 1.22
B
10 9.83 1.69 1.73 9.78 2.46 2.76
20 19.71 1.44 0.95 19.65 1.74 3.54
30 29.43 1.88 1.54 29.14 2.85 3.26
C
15 14.79 1.54 1.40 14.71 1.49 1.94
20 19.69 0.97 1.55 19.63 2.13 1.85
25 24.72 1.29 1.12 24.69 1.81 1.24
DEC-diethylcarbamazine citrate. *mg in method A and µg mL-1 in methods B and C; a Mean value of 7 determinations; b Relative
TABLE III - Results of analysis of formulations by the proposed methods
Formulation
analyzed Label claim
Found* (Percent of label claim±SD)
Oficial method Proposed methods
Method A Method B Method C
Banocide forte
tablets 100 mg per tablet 98.2±1.63
99.1±1.32 98.9±1.25 98.6±1.65
t = 0.96 t = 0.76 t = 0.39
F = 1.52 F = 1.7 F = 1.02
Banocide syrup 120 mg per 5 mL 101.2±1.29
102.7±1.31 101.6±1.63 101.9±1.7
t = 1.82 t = 0.43 t = 0.73
F = 1.03 F = 1.6 F = 1.74
*Mean value of ive determinations. Tabulated t-value at the 95% conidence level is 2.77. Tabulated F-value at the 95% conidence
level is 6.39.
TABLE IV - Results of recovery study via standard addition technique
Method Formulation
studied *DEC in tablet *Pure DEC added Total found
*Pure DEC
recovereda
Percent±SD
A
Banocide forte tablets
2.97 2.97 2.97
1.5 3.0 4.5
4.17 5.73 7.30
99.2±1.34 100.6±1.29 101.4±1.18
Banocide syrup
3.08 3.08 3.08
1.5 3.0 4.5
4.63 6.23 7.70
101.2±1.27 102.5±0.93 101.6±1.17
B
Banocide forte tablets
9.89 9.89 9.89
5.0 10.0 15.0
15.15 19.67 24.79
101.8±1.36 98.9±1.63 99.6±1.54
Banocide syrup
10.16 10.16 10.16
5.0 10.0 15.0
15.48 20.54 25.46
102.1±1.81 101.9±0.99 101.2±1.36
C
Banocide forte tablets
9.86 9.86 9.86
5.0 10.0 15.0
15.06 19.78 24.96
101.4±1.45 99.6±1.29 100.4±1.54
Banocide syrup
10.19 10.19 10.19
5.0 10.0 15.0
15.60 20.57 25.52
102.7±1.82 101.9±0.79 101.3±1.59 *mg in method A and µg mL-1 in methods B and C; aMean value of three determinations.
British Pharmacopoeia (1988) method, which describes a non-aqueous titration method for its determination for accuracy and precision by applying the Student’s t-test and variance ratio F-test. Statistical analysis of the results using Student’s t-test for accuracy and F-test for precision
revealed no signiicant difference between the proposed methods and the oficial method at the 95% conidence
level with respect to accuracy and precision (Table III). The accuracy and validity of the proposed methods
CONCLUSIONS
T h r e e m e t h o d s h a v e b e e n d e v e l o p e d f o r determination of DEC in bulk drug and in its dosage forms and validated as per the current ICH guidelines. The methods use cheap and readily available chemicals,
compared to the lone titrimetric method [oficial method],
the presented methods are rather simple and sensitive. The reported methods suffer from such draw backs as high cost, and several clean-up steps. They are time-consuming and often poorly reproducible, some require toxic organic
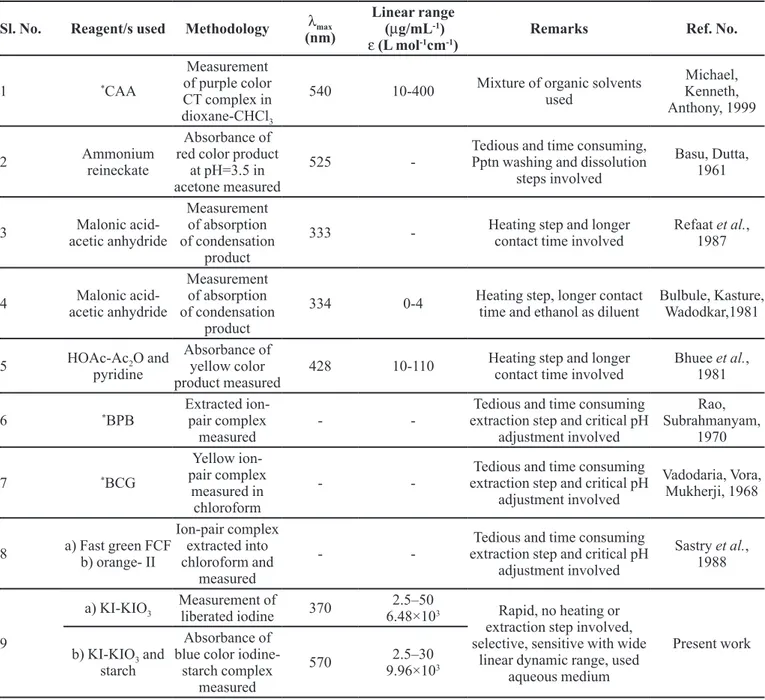
solvents. Any method chosen for routine analysis should be reasonably simple, used materials should be readily available in the laboratory or readily obtainable, and require a minimum amount of equipment. The methods are selective as none of the common tablet excipients contain acidic groups to interfere with the present proposed methods. The proposed spectrophotometric methods are free from rigid experimental variables such as pH control, heating or extraction step and/or use of organic solvents. They are characterized by high selectivity and comparable sensitivity with respect to the existing methods (Table V).
TABLE V -Comparison of performance characteristics of the present methods with the existing methods
Sl. No. Reagent/s used Methodology λmax
(nm)
Linear range (µg/mL-1) ε (L mol-1cm-1)
Remarks Ref. No.
1 *CAA
Measurement of purple color CT complex in dioxane-CHCl3
540 10-400 Mixture of organic solvents used Michael, Kenneth, Anthony, 1999 2 Ammonium reineckate Absorbance of red color product
at pH=3.5 in acetone measured
525
-Tedious and time consuming, Pptn washing and dissolution
steps involved
Basu, Dutta, 1961
3 Malonic
acid-acetic anhydride
Measurement of absorption of condensation
product
333 - Heating step and longer
contact time involved
Refaat et al., 1987
4 Malonic
acid-acetic anhydride
Measurement of absorption of condensation
product
334 0-4 Heating step, longer contact time and ethanol as diluent
Bulbule, Kasture, Wadodkar,1981
5 HOAc-Ac2O and
pyridine
Absorbance of yellow color product measured
428 10-110 Heating step and longer contact time involved
Bhuee et al., 1981
6 *BPB
Extracted ion-pair complex measured
-
-Tedious and time consuming extraction step and critical pH
adjustment involved
Rao, Subrahmanyam,
1970
7 *BCG
Yellow ion-pair complex
measured in chloroform
-
-Tedious and time consuming extraction step and critical pH
adjustment involved
Vadodaria, Vora, Mukherji, 1968
8 a) Fast green FCF b) orange- II
Ion-pair complex extracted into chloroform and
measured
-
-Tedious and time consuming extraction step and critical pH
adjustment involved
Sastry et al., 1988
9
a) KI-KIO3
Measurement of
liberated iodine 370
2.5–50
6.48×10³ Rapid, no heating or
extraction step involved, selective, sensitive with wide
linear dynamic range, used aqueous medium
Present work b) KI-KIO3 and
starch
Absorbance of blue color
iodine-starch complex measured
570 2.5–30
9.96×10³
ACKNOWLEDGEMENTS
Authors are grateful to the quality control manager, Inga Laboratories Pvt. Ltd., Mumbai, India, for gift sample of pure diethylcarbamazine citrate and the authorities of the University of Mysore, Mysore, for permission and facilities. Prof. K. Basavaiah is indepted to the University Grants Commission, New Delhi, India, for the award of BSR faculty fellowship.
REFERENCES
ABIGAIL, W.; PATRICK, B.; SHANNON, H.; MARCO, M.; BRENNAN, E.B.; DOMINIQUE, M.; THOMAS, G.S.; MARYA, L. A low-tech analytical method for diethylcarbamazine citrate in medicated salt. PLoS Negl. Trop. Dis., v.5, p.e1005, 2011.
ADKIWU, M. U.; OFOKANSI, K. C.; ATTAMA, A. A. Spectrophotometric and thermodynamic studies of the charge-transfer interaction between Diethylcarbamazine Citrate and Chloranilic Acid. Chem. Pharm. Bull., v.47, p.463-466.
BASU, K.; DUTTA, B.N. A rapid colorimetric method of estimation of diethyl-carbamazine citrate in pharmaceutical preparations. Ind. J. Pharm., v.23, p.326-329, 1961.
BHANUMATHI, L.; WADODKAR, S.G.; KASTURE, A.V. Methods for analysis of diethylcarbamazine citrate. Indian Drugs, v.8, p.204-206, 1981.
BHUEE, G.S.; RASTOGI, S.N.; JETLEY, U.K.; JAI SINGH. Colorimetric determination of diethylcarbamazine citrate. East. Pharm., v.24, p.197-198, 1981.
BULBULE, M.V.; KASTURE, A.V.; WADODKAR, S.G. A note on spectrophotometric determination of diethylcarbamazine citrate. Indian Drugs, v.19, p.27-28, 1981.
CAMPBELL, M.J.M.; DEMETRIOU, B.; JONES, R. Assay of procyclidine hydrochloride, cyclizine hydrochloride, and diethylcarbamazine citrate in tablets using ion-responsive electrodes. Analyst, v.105, p.605-611, 1980.
EL-OBEID, A.H. Determination of diethylcarbamazine citrate in tablets by proton magnetic resonance. Spectr. Lett., v.17, p.361-367, 1984.
INTERNATIONAL CONFERENCE ON HARMONIZATION. I C H . Te c h n i c a l r e q u i r e m e n t s f o r r e g i s t r a t i o n o f pharmaceuticals for human use harmonised tripartite guideline. Validation of Analytical Procedures: Text and Methodology Q2(R1). London 2005.
JEZZY, W.; JAROSZEWSKI, D.B.; FRANK, A.; SIMONSEN, S . P. E . ; M E T T E , K . ; A G G E R . D e t e r m i n a t i o n o f diethylcarbamazine, an antiilarial drug, in human urine by 1H-NMR spectroscopy. J. Pharm. Biomed. Anal., v.14, p.543-549, 1996.
JOSEPH, R.M.; LAWRENCE, F. Gas chromatographic assay of diethylcarbamazine in human plasma for application to clinical pharmacokinetic studies. J. Pharm. Biomed. Anal., v.26, p.665-674, 2001.
KRISHNA VAMSI, M.; JAYALAKSHMI, B.; VIJAY, R.A.; SANDEEP, C. A sensitive RP-HPLC method for simultaneous estimation of diethylcarbamazine citrate and levoceterizine in bulk and pharmaceutical dosage form. Int. J. Pharm. Sci. Res., v.3, p.3347-3353, 2012.
M AT H E W, N . ; K A LYA N A S U N D A R A M , M . A h i g h performance liquid chromatographic method for the estimation of diethylcarbamazine content in medicated salt samples. Acta. Trop., v.80, p.97-102, 2001.
MICHAEL, U.A.; KENNETH, C.O.; ANTHONY, A.A. Spectrophotometric and thermodynamic studies of the charge-transfer interaction between diethylcarbamazine citrate and chloranilic acid. Chem. Pharm. Bull., v.47, p.463-466, 1999.
NENE, S.; ANJANEYULU, B.; RAJAGOPALAN, T.G. Determination of diethylcarbamazine in blood using gas chromatography with alkali lame ionization detection. J. Chrom. Biomed. Appl., v.308, p.334-340, 1984.
PFAFF, M.C.; GAYRAL, P.; MAHUZIER, G. A method for the gas chromatographic determination of diethylcarbamazine (Hetrazan) in serum of laboratory rodents. J. Chromatogr., v.150, p.155-160, 1978.
R A O , K . N . ; S U B R A H M A N YA M , D . E s t i m a t i o n o f diethylcarbamazine (hetrazan). Ind. J. Med. Res., v.58, p.746-752, 1970.
REDDY, J.M.; JEYAPRAKASH, M.R.;MADHURI, K.; MEYYANATHAN, S.N.; ELANGO, K. A sensitive RP-HPLC method for simultaneous estimation of diethylcarbamazine and levocetirizine in tablet formulation. Ind. J. Pharm. Sci., v.73, p.320-323, 2011.
REFAAT, I.H.; KOMMOS, M.E.; FARAG, H.H.; EL-RABAT, N.A. Spectroluorometric and spectrophotometric determination of some tertiary amine drugs. Bull. Pharm. Sci, Assiut Univ., v.10, p.85-102, 1987.
RIZK, M.; WALASH, M.I.; IBRAHIM, F. Spectrophotometric determination of piperazine, piperazine salts and diethylcarbamazine citrate with chloranilic acid. Spectr. Lett., v.17, p.423-440, 1984.
SASTRY, C.S.P.; ARUNA, M.; REDDY, M.N.; SANKAR, D.G. Extractive spectrophotometric determination of some anthelmintics using Fast green FCF or Orange II. Ind. J. Pharm. Sci., v.50, p.140-142, 1988.
SWINYARD, E.A. Remington’s Pharmaceutical Sciences. Easton: Mack Publishing Company, 1990. p.1242-1248.
THE BRITISH PHARMACOPOEIA. London: Her Majesty’s Stationery Ofice, 1988. p. 190.
UNITED STATES PHARMACOPOEIA. Monographs. (USP30-NF25 p.1929), Pharmacopoeial forum, v.28, p.1098.
VADODARIA, D.J.; VORA, M.N.; MUKHERJI, P.S. Colorimetric estimation of diethylcarbamazine citrate in pharmaceutical preparations. Ind. J. Pharm., v. 30, p.41-43, 1968.
VOGEL A.I. A text book of quantitative inorganic analysis, 3.ed. London: Longman, 1961. p.354.
WAHBI, A.M.; EL-OBEID, A.H.; GAD-KARIEM, E.A. Spectrophotometric determination of diethylcarbamazine citrate via charge-transfer complex. Farmaco Prat., v.41, p.210-214, 1986.
WALASH, M.I.; RIZK, M.S.; IBRAHIM, F.A. DC polarographic assay of piperazines. J. Assoc. Ofic. Anal. Chem., v.68, p.532-534, 1985.
Received for publication on 20th January 2014