www.ache.org.rs/CICEQ
Chemical Industry & Chemical Engineering Quarterly 15 (2) 69−76 (2009) CI&CEQ
S. M. AL-GHANNAM A. M. AL-OLYAN
Girls College of Science, Department of Chemistry, P.O. Box 838, Dammam-31113, Saudi Arabia
SCIENTIFIC PAPER
UDC 543.42:661.12:615.22.012
SPECTROPHOTOMETRIC DETERMINATION
OF NICRADIPINE AND ISRADIPINE IN
PHARMACEUTICAL FORMULATIONS
A sensitive spectrophotometric method was developed for the determination of some 1,4-dihydropyridine compounds namely, nicardipine and isradipine either in pure form or in pharmaceutical preparations. The method is based on the reduction of nicardipine and isradipine with zinc powder and calcium chloride followed by further reduction with sodium pentacyanoaminoferrate (II) to give violet and red products having the absorbance maximum at 546 and 539 nm with nicardipine and isradipine, respectively. Beer’s law was obeyed over the concentration range 8.0–180 µg/ml with the detection limit of 1.67 µg/ml for nicardipine and 8.0–110 µg/ml with the detection limit of 1.748 µg/ml for isradi-pine. The analytical parameters and their effects on the reported methods were investigated. The molar absorptivity, quantization limit, standard deviation of intercept (Sa), standard deviation of slope (Sb) and standard deviation of the re-siduals (Sy/x) were calculated. The composition of the result compounds were found 1:1 for nicardipine and 1:2 for isradipine by Job’s method and the con-ditional stability constant (Kf) and the free energy changes (ΔG) were calcula-ted for compounds formed. The proposed method was applied successfully for the determination of nicardipine and isradipine in their dosage forms. The re-sults obtained were in good agreement with those obtained using the reference or official methods. A proposal of the reaction pathway was presented.
Key words: spectrophotometer; nicardipine; isradipine; pharmaceutical preparations.
Calcium antagonists block the influx of calcium ions through voltage-operated calcium channels loca-ted in the cell membrane. Among the different groups, dihydropyridines is the most numerous and includes the largest number of novel compound. They act upon the L-type channel, which has a specific dihydropyri-dine site in its extra cellular surface and bind more selectively to vascular calcium channels than to those in the myocardium. Newer dihydropyridines exhibit greater selectivity, with evidence for a specific vascu-lar vessel bed binding. Each of these agents is effecti-ve in the treatment of hypertension and angina pec-toris [1-3].
The therapeutic importance of dihydropyridines initiated several methods on its determination, both in formulations and in biological fluids. These methods
Corresponding author: S. M. Al-Ghannam, Girls College of Sci-ence, Department of Chemistry, P.O. Box 838, Dammam-31113, Saudi Arabia.
E-mail: [email protected] Paper received: 22.10.2008 Paper revised: 21.01.2009 Paper accepted: 05.02.2009
determi-nation of amlodipine besylate with ρ-chloranilic acid in 1,4-dioxan-chloroform medium[22].
Sodium pentacyanoaminoferrate (II) (SCAF) has been used to detect aromatic nitro compounds [23].
The compounds studied were: nicardipine (NIC), 1,4-dihydro-2,6-dimethyl-4-(3-nitrophenyl)methyl-2-[me-thyl(phenyl methyl)amino]-3,5-pyridinedicarboxylic acid ethyl ester, and isradipine (ISRA), 4-(4-benzofuraza-nyl)-1,4-dihydro-2,6-dimethyl-3,5-pyridinecarboxylic acid methyl 1-methylethyl ester.
Nicardipine
Isradipine
The aim of this work is the development of a simple and sensitive method for the determination of NIC and ISRA in the pure and pharmaceutical prepa-rations. The proposed method is based on the re-duction of nicardipine and isradipine with zinc powder and calcium chloride followed by further reduction with sodium pentacyanoaminoferrate (II) to give color products. The results obtained were promising.
EXPERIMENTAL
Apparatus
All Absorption spectra were made M501 using UV-Visible spectrophotometer (Cambridge, UK) with a scanning speed of 200 nm/min, wavelength range 190-1100 nm and a band width of 2.0 nm, equipped with 1 cm quartz cells.
Materials and reagents
All chemicals and reagents used were of analy-tical grade and used without further purification.
Double distilled de-ionized water was used to prepare all solutions.
Materials
Nicardipine hydrochloride was obtained from Sigma chemical co. (St. Louis, MO, USA). Isradipine was gratefully gifted by Novartis Pharma (Basle, Swi-tzerland).
Pharmaceutical formulations
Tablets contained isradipine (Lomir tablets), la-beled to contain 2.5 mg of isradipine per tablet (No-vartis Pharma, AG, Basle, Switzerland). Capsules contained nicardipine (Pelcard capsules), labeled to contain 50 mg of nicardipine per capsule (Global Napi Pharmaceuticals, Egypt).
Standard solutions
Stock solutions of pure NIC and ISRA were pre– pared separately by dissolving 0.1 g of NIC and ISRA in methanol then completed to 100 ml with the same solvent. Working solutions of lower concentrations were prepared by the appropriate dilution with methanol.
Reagents
Sodium pentacyanoaminoferrate (II) Na3[Fe(CN)5NH3] (SCAF) was prepared according to Vogel [24], and used as a 0.1% solution, made fresh daily.
Calcium chloride solution, 10% (w/v), was ob-tained from (BDH, Poole, England).
Zinc powder was obtained from (BDH, Poole, England).
General recommended procedures
Procedure for calibration graphs
the absorbance versus the final concentration ( g/ml) of the drugs. Alternatively, the regression equations were derived.
Procedure for pharmaceutical formulations
The contents of twenty tablets (Lomir tablets la-beled to contain 2.5 mg of isradipine per tablet) or contents of ten capsules (Pelcard capsules labeled to contain 50 mg of nicardipine per capsule) were crush-ed, powdered or emptied. An accurate weight equiva-lent to 25 mg NIC or ISRA was dissolved in 20 ml of methanol with shaking for 5.0 min and filtered. The fil-trate was diluted in a 25 ml measuring flask with me-thanol. An aliquot of the diluted drug solution was treat-ed as describtreat-ed. The found content of the tablets or capsules were calculated either from the calibration graph or the regression equation.
RESULTS AND DISCUSSION
Optimization of experimental parameters
The reduction of NIC or ISRA with the zinc and calcium chloride solution and subsequently reacted with SCAF in aqueous ethanol, produces a violet or red product, respectively, having a broad absorption peak with its maximum at 546 nm for NIC and 539 nm for ISRA (Figure 1). The various experimental factors affecting the development and stability of the reaction product were studied and optimized. Such factors were changed individually, while others remained constant, which include the amount of zinc powder, the concen-tration of the calcium chloride solution, the concentra-tion of SCAF soluconcentra-tion, time of reacconcentra-tion, the effect of the reaction temperature, stability of the product and the effect of interferences.
Table 1. Analytical parameters for the determination of nicardipine and isradipine using the proposed method
Parameter
Compound
Nicardipine Isradipine
c / µg ml-1
8-180 8-110
Wavelength max, nm 546.0 539.0
Molar absorption coefficient, 103 l mol-1 cm-1 2.41 2.73
Linear regression equation A = 0.005c + 0.002 A = 0.006c + 0.032
Correlation coefficient, r 0.9960 0.9970
Detection limit, g/ml 1.67 1.74
Quantiation limit, g/ml 5.58 5.27
Sy/x×103 6.01 5.62
Sa×103 2.79 3.16
Sb×105 10.2 5.1
Kf×10-3 104.12 0.3725
ΔG, kJ/mol -6.27 -3.51
Effect of the amount of zinc powder
The influence of the amount of zinc powder was studied using different amounts of zinc 0.05-0.6 g. It was found that the reaction took place starting from 0.2 g upwards for NIC and hence, 0.3 g was selected as the optimum amount. The absorbance remains constant by using 0.05-0.1 g of zinc powder for ISRA, then the absorbance decreases by increasing the amount of zinc and hence, 0.1 g was selected as the optimum amount.
Effect of calcium chloride solution concentration
The reduction between the studied drugs and zinc powder takes place in the presence of calcium chloride. Different volumes of CaCl2 solution ranging from 1.0-8.0 ml (10% w/v) were tested along with the amount of zinc chosen. It was noticed that 1-3 ml of 10% CaCl2 was necessary without altering the com-pleteness of reduction of NIC or ISRA.
Effect of SCAF concentration
The effect of SCAF was studied by using in-creasing concentrations of SCAF. It was found that 100 or 280 µg/ml of SCAF is appropriate for maxi-mum absorbance intensity for NIC or ISRA, respectti-vely. Excess concentrations of SCAF (300-400 µg/ml) had little effect on the absorbance of ISRA.
Effect of reaction time
The reaction of NIC or ISRA and SCAF depends on time. Maximum absorbance intensity was obser-ved after 8.0 min for NIC and 3.0-6.0 min for ISRA, at room temperature.
Effect of reaction temperature
The reduction of NIC or ISRA was studied at dif-ferent temperatures (25–100 °C). The values of maxi-mum absorbance of the reduction product were al-most constant from 25 to 65 °C for NIC, further tem-perature decreases the absorbance. For ISRA, it was observed that raising the temperature up to 30 °C has no effect on the absorbance of the product, whereas above 30 °C, the absorbance starts to decay. There-fore, working at room temperature of about 25 °C was recommended in the procedure.
Stability of the product
The stability of the reduction product was evalu-ated and constant absorbance readings were obtain-ed after more than 5 h of standing at room tempera-ture without any change in color intensity.
Stoichiometric relationship
Job’s method of continuous variation [25] of equi-molar solutions was employed: 2.7×10⁻³ M standard solution of drugs and 2.7×10⁻³ M solution of SCAF was used. A series solution was prepared in which the total volume of drug and reagent was kept at 10 ml. The absorbance was measured at the optimum wavelength. The molar ratio of the reagent (drug: SCAF) in the product was determined by the method con-tinuous variations (Job’s method).The results indicate that (1:1) for (NIC:SCAF) and (1:2) for (ISRA:SCAF) are formed. The suggested mechanism for the reac-tion products are given in (Scheme 1).
Conditional stability constants (Kf)
The conditional stability constants (Kf) of the re-duction products were calculated from continuous va-riation data using Mollard method [26]. Using this equation, the stability constants were found to be as shown in Table 1. These values obtained indicate very stable reaction products. The standard free ener-gy changes of production (ΔG) were calculated from the association constants (Table 1) by the following equation [27]:
ΔG = - 2.303RTlog Kf
Where ΔG is the free energy change of the product (kJ mol-1), R the gas constant (1.987 cal mol-1 K-1), T the temperature in Kelvin (273 + t (°C)), and Kf is the association constant of drug-reagent reduction products (l mol-1). The negative values of ΔG point out to the spontaneous nature of the reactions.
Effect of interferences
In order to evaluate the selectivity of the pro-posed method for the analysis of pharmaceutical for-mulations, the effects of the presence of excipients and additives which can occur in real samples were investigated. It was found that the presence of com-mon excipients of tablets and capsules such as talc, starch, gelatin, glucose, sulfate, acetate, phosphate and magnesium stearate did not interfere with the de-termination of the studied drugs at the levels normally found in dosage forms.
Method validation
Linearity
Standard calibration curves were constructed by plotting absorbance versus concentration (µg/ml) as follows:
For NIC concentration range (8.0-180 µg/ml):
A = 0.005c + 0.002, r = 0.9960
For ISRA concentration range (8.0-110 µg/ml):
A = 0.006c + 0.032, r = 0.9970
The statistical parameters were given in the reg-ression equation calculated from the calibration graphs, along with the standard deviations of the slope (Sb) and the intercept (Sa) on the ordinate and the stan-dard deviation residuals (Sy/x).
The linearity of calibration graphs was proved by high values of the correlation coefficient (r) and the small values of the y-intercepts of the regression equations. The apparent molar absorptivities of the resulting colored reduction products and relative stan-dard deviation of response factors for each proposed
spectrophotometric method were also calculated and recorded in Table 1.
Sensitivity
The detection limits (LOD) for the proposed me-thods were calculated using the following equation [28]:
k s
LOD =3
where s is the standard deviation of replicate deter-mination values under the same conditions as for the sample analysis in the absence of the analyte, and k is the sensitivity, namely the slope of the calibration graph. In accordance with the formula, the detection limits were found to be 1.67 µg/ml for NIC and 1.74 µg/ml for ISRA.
The limits of quantization, LOQ, are defined as [28]:
k s LOQ=10
According to this equation, the limits of quan-tization were found to be 5.58 µg/ml for NIC and 5.27 µg/ml for ISRA (Table 1).
Specificity, precision, and accuracy
The specificity of the reduction reaction and se-lective determination of NIC and ISRA could be pos-sible. Percentage relative standard deviation (RSD, %) as precision and percentage relative error (Er, %) as accuracy of the suggested method was calculated. The precision was carried out by three determinations at 13 different concentrations in this spectrophotomet-ric method. The percentage relative error was calcu-lated using the following equation:
Added Added Found
Er =100 −
The precision and accuracy results are shown in Table 2. These results of accuracy and precision show that the proposed method has good repeatability and reproducibility.
Analysis of pharmaceutical formulations
ace-tic acid, the flow rate was 1.5 ml/min. The chromato-graphic procedure official method [30] for the determi-nation of isradipine was carried out using a stainless steel column (10 cm×4.6 mm) packed withthe statio-nary phase C (5 µm) (Brownlee Spheri ODS 5µ is suitable), and the mobile phase consisting of a mix-ture of 125 volumes of acetonitrile, 270 volumes of tetrahydrofuran and 625 volumes ofwater with a flow rate of 1.2 ml per min and a detection wavelength of 230 nm.
Statistical analysis [28] of the results obtained from both the methods revealed no significant
differ-rence between the performance of the two methods regarding accuracy and precision as revealed by Stu-dent’s t-test and variance ratio, F-test, (Table 2).
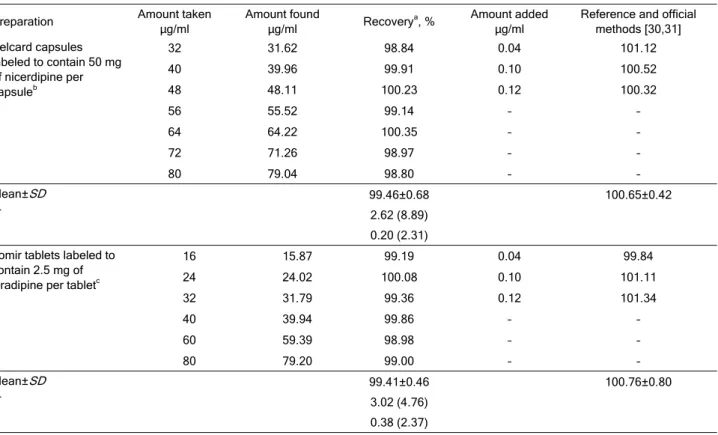
The proposed method was further applied to commercial tablets and capsules containing NIC or ISRA. The results obtained are shown in Table 3. The average percent recoveries were quantitative, indica-ting good accuracy of the method and the value of t-test and F-value revealed no significant difference between the performances of the two methods.
The accuracy and precision (intra-day precision or repeatability and inter-day or intermediate
preci-Table 2. Application of the proposed spectrophotometric method for the determination of nicardipine and isradipine in pure forms
Compound Amount added
g/ml
Amount found
g/ml Recovery
a
, % RSD, % Er, % Amount added
g/ml
Reference and official
methods[29,30]
Nicardipine 8 7.97 99.59 0.88 -0.41 0.02 101.60
12 12.07 100.55 0.73 0.55 0.04 99.75
16 15.84 98.98 0.33 -1.02 0.08 100.93
24 24.03 100.14 0.45 0.14 0.10 101.62
32 31.25 97.64 1.12 -2.36 0.12 99.28
36 36.33 100.91 0.64 0.91 – –
60 60.68 101.14 0.40 1.14 – –
80 79.63 99.54 0.77 -0.46 – –
100 100.16 100.16 1.35 0.16 – –
120 121.21 101.01 0.98 1.01 – –
140 140.68 100.49 0.76 0.49 – –
160 158.58 99.11 0.81 -0.89 – –
180 181.74 100.96 0.95 0.96 – –
Mean±SD 100.02±1.02 – 100.64±1.08 (n = 5)
RSD, % 1.1979 – –
F 1.12 (5.14) – –
t 1.14 (2.31) – –
Isradipine 8 8.08 101.03 0.55 1.03 0.02 97.53
12 12.00 100.00 0.78 0.00 0.04 101.45
16 16.12 100.77 1.02 0.77 0.06 102.85
20 19.94 99.69 0.99 -0.31 0.08 96.53
28 28.39 101.40 0.32 1.40 0.10 98.38
36 35.92 99.77 0.65 -0.23 0.12 102.55
50 49.82 99.64 0.44 -0.4 – –
60 58.82 98.03 0.71 -2.0 – –
70 68.82 98.31 0.39 -1.7 – –
80 80.62 100.78 0.86 0.8 – –
90 88.62 98.47 1.22 -1.5 – –
100 100.42 100.42 0.89 0.4 – –
110 108.02 98.20 0.40 -1.8 – –
Mean±SD 99.73±1.16 – 99.88±2.74 (n = 6)
RSD, % 1.1631 – –
Fb 5.60 (5.79) – –
tb
0.31 (2.37) – –
a
The average of three trials; b
sion) of this method, evaluated by assaying three dif-ferent concentrations of NIC and ISRA, are summa-rized in Table 4. The differences of the mean value measured from the concentration prepared, expres-sed in percentages, were only -0.21, 0.13 and –3.88% at 40, 60 and 80 µg/ml of NIC and 0.34, 1.23 and –3.41 µg/ml at 40, 60 and 80 µg/ml of ISRA, which confirmed the accuracy of the method. The range of per-centage of relative standard deviation (RSD) was 1.9– -3.6% and 2.7–3.7% for NIC and 1.6–5.1% and 1.6–4.6% for ISRA for within-day and between-day analyses, respectively. The RSD values obtained allow us to con-clude that the method has an acceptable precision.
A systematic study of the effects of excipients was performed by adding a known amount of the ex-cipient to 80 µg/ml NIC or ISRA, filtering off the
inso-luble excipient, washing the residue, diluting in a volu-metric flask and analyzing following the recommend-ed procrecommend-edure. The results revealrecommend-ed that no significant interference was observed from excipients, such as starch, talc, gelatin, glucose and magnesium stearate.
CONCLUSION
The present method has the advantages of high sensitivity (detection limit = 1.67 for NIC and 1.74 µg/ml for ISRA). On the other hand, the proposed me-thod is low cost, selective, accurate and precise (in-tra-day and inter-day precision) as indicated by the good results of the drugs. Furthermore, the proposed method does not require the elaboration of the proce-dures which is usually associated with
chromatogra-Table 3. Application of the proposed spectrophotometric method for the determination of nicardipine and isradipine in their pharma-ceutical formulations
Preparation Amount taken
g/ml
Amount found
g/ml Recovery
a, % Amount added
g/ml
Reference and official methods [30,31] Pelcard capsules
labeled to contain 50 mg of nicerdipine per capsuleb
32 31.62 98.84 0.04 101.12
40 39.96 99.91 0.10 100.52
48 48.11 100.23 0.12 100.32
56 55.52 99.14 – –
64 64.22 100.35 – –
72 71.26 98.97 – –
80 79.04 98.80 – –
Mean±SD 99.46±0.68 100.65±0.42
F 2.62 (8.89)
t 0.20 (2.31)
Lomir tablets labeled to contain 2.5 mg of isradipine per tabletc
16 15.87 99.19 0.04 99.84
24 24.02 100.08 0.10 101.11
32 31.79 99.36 0.12 101.34
40 39.94 99.86 – –
60 59.39 98.98 – –
80 79.20 99.00 – –
Mean±SD 99.41±0.46 100.76±0.80
F 3.02 (4.76)
t 0.38 (2.37)
a
The average of three trials; b
Global Napi Pharmaceuticals, Egypt; c
Novartis Pharma, AG, Basle, Switzerland
Table 4. Precision of the method for the determination of NIC and ISRA in pharmaceutical formulations, expressed as relative standard deviation (RSD)
Compound Concentration, µg/mL Accuracy, % Intra-day precision RSD, % Inter-day precision RSD, %
Nicardipine 40 -0.21 3.6 2.7
60 0.13 1.9 3.7
80 -3.88 2.7 3.5
Isradipine 40 0.34 1.6 1.9
60 1.23 3.5 4.6
phic methods. The disadvantage of this method is the tediousness of filtration. The proposed method could be applied successfully for the determination of nicer-dipine and isranicer-dipine in pure forms, as well as dosage forms, with no interferences from tablets or capsules excipients.
REFERENCES
[1] F.E. Silvestry, M.G.S. Sutton, Eur. Heart J. 19 (Suppl. I)
(1998) I8-I14
[2] A. Goodman, T.W. Rall, A.S. Nies, P. Taylor, The
Phar-macological Basis of Therapeutics, 8th edition, McGraw-Hill, New York, 1992
[3] T. Godfraind, S. Salomone, J. Cardiovasc. Pharmacol. 30
(1997) 51-55
[4] F. Belal, A.A. Al-Majed, S. Julkhuf, N.Y. Khalil,
Pharma-zie 58 (2003) 874-876
[5] M.M. Ghoneim, A. Tawfi, P.Y. Khashaba, Anal. Bioanal.
Chem. 375 (2003) 369-375
[6] F. Belal, A. Al-Majed, S. Julkhuf, J. Pharm. Biomed. Anal.
31 (2003) 989-998
[7] S.A. Ozkan, Pharmazie 57 (2002) 503-505
[8] G. Altiokka, D. Dougrukol-Ak, M. Tuncel, H.Y.
Aboul-En-ein, Arch. Pharm. (Weinheim) 335 (2002) 104-107
[9] A. Alvarez-Lueje, S. Pujol, L.J. Naranjo, L.J.
Núñez-Ver-gara, J. AOAC Int. 85 (2002) 1247-1252
[10] A.B. Baranda, R.M. Jiménez, R.M. Alonso, J.
Chroma-togr. A 1031 (2004) 275-280
[11] V.B. Patravale, V.B. Nai, S.P. Gore, J. Pharm. Biomed.
Anal. 23 (2000) 623-627
[12] A.F. El Walily, J. Pharm. Biomed. Anal. 16 (1997) 21-30
[13] D. Zendelovska, S. Simeska, O. Sibinovska, E. Kostova,
K. Miloševska, J. Jakovski, E. Jovanovska, I. Kikerkov, J.
Trojačanec, D. Zafirov, J. Chromatgr. B 839 (2006) 85-88
[14] W. Kang, H. Yun, K. Liu, K. Kwon, J. Shin, J. Chromatgr.
B 805 (2004) 311-314
[15] K. Javidnia, R. Miri, A. Jamalian, J. Pharm. Biomed. Anal.
40 (2006) 438-442
[16] K. Sridhar, C. S. P. Sastry, M. N. Reddy, D. G. Sankar, K.
R. Srinivas, Anal. Lett. 30 (1997) 121-133
[17] N. Rahman, M.N. Hoda, IL Farmaco 57 (2002) 435-441
[18] M. N. Reddy, G. T. Rani, K. V. S. P. Rao, D. G. Sankar,
K. Sreedhar, Indian J. Pharm. Sci. 59 (1997) 188-189
[19] I. Singhvi, S. C. Chaturvedi, Indian J. Pharm. Sci. 60
(1998) 309-310
[20] I. Singhvi, S. C. Chaturvedi, Indian J. Pharm. Sci. 61
(1999) 190-191
[21] N. Rahman, N. Khan, S. Azmi, IL Farmaco 59 (2004) 47-54
[22] N. Rahman, S. Azmi, Anal. Sci. 16 (2000) 1353-1356
[23] F. Feigl, Spot Tests in Organic Analysis, 7th Ed., Elsevier, Amsterdam, 1966, pp. 290, 297-299
[24] A.I. Vogel, A text Book of Quantitative Inorganic Analysis,
3rd Ed., Longman, London, 1975, p. 727
[25] J.H. Yoe, A.L. Jones, Ind. Eng. Chem. Anal. Ed. 6 (1944)
111-115
[26] J.D. Ingle, S.R. Crouch, Spectrochemical Analysis,
Pren-tice-Hall, Inc., New Jersey, 1988, p. 387
[27] A.N. Martin, J. Swarbrick, A. Cammarata, Physical
Phar-macy, 3rd Ed., Lee & Febiger, Philadelphia, 1969, p. 344
[28] J.C. Miller, J.N. Miller, Statistics for Analytical Chemistry, 4th Ed., John Wiley & Sons, New York, 2000
[29] A.A. Mustafa, K.A. Al-Rashood, M.E.M. Hagga, E.A.
Gad--Kariem, M.E. Al-Awady, Pak. J. Sci. Ind. Res. 37 (1994) 1-4
[30] The British Pharmacopoeia, HMSO, The Pharmaceutical