Artigo
*e-mail: [email protected]
PRECONCENTRATION, DETERMINATION AND SPECIATION OF IRON BY SOLID-PHASE EXTRACTION USING DIMETHYL (E)-2-[(Z)-1-ACETYL)-2-HYDROXY-1-PROPENYL]-2-BUTENEDIOATE
Gholamreza Khayatian*, Shahed Hassanpoor, Farough Nasiri and Amin Zolali
Chemistry Department, Faculty of Science, University of Kurdistan, Sanandaj, Iran
Recebido em 2/6/11; aceito em 24/9/11; publicado na web em 6/12/11
A new sensitive and selective procedure for speciation of trace dissolved Fe(III) and Fe(II), using modified octadecyl silica membrane disks and determination by flame atomic absorption spectrometry was developed. A ML3 complex is formed between the ligand and Fe(III) responsible for extraction of metal ion on the disk. Various factors influencing the separation of iron were investigated and the optimized operation conditions were established.Under optimum conditions, an enrichment factor of 166was obtained for Fe3+ ions. The calibration graph using the preconcentration system for Fe3+ was linear between 40.0 and 1000.0 µg L-1.
Keywords: speciation; iron; solid-phase extraction.
INTRODUCTION
Iron is the fourth most abundant element (after O, Si, and Al) and second most abundant metal on the earth’s crust. It plays aa prominent role in chemical reactions, such as in geological processes, environmental and atmospheric chemistry, and in biochemistry.1 The
environmental and biological effectiveness of iron depends, to a large extent, on its chemical properties, such as valence, solubility and the degree of complex formation. Iron plays an important role in plant metabolism where it is essential for photosynthetic and respiratory electron transport, nitrate reduction, chlorophyll synthesis and detoxi-fication of reactive oxygen species.2-5 Owing to the presence of iron
in environmental and biological materials, and the lack of sufficient understanding of the role of the two oxidation states of this element, determination of both Fe(II) and Fe(III) is of great importance.6-8
The speciation of iron(III) and iron(II) has been studied by different techniques such as electrothermal vaporization inductively coupled plasma optical emission spectrometry (ETV-ICP-OES), polarography,9,10 flow injection analysis,11 voltammetry,12 atomic
absorption spectroscopy (AAS),13 and capillary electrophoresis.14 The
lower concentration of this element relative to the detection limits of the instruments used, together with sources of interfering effects from the matrix of the real samples, are two main difficulties involved in these determinations.15 In order to overcome these difficulties,
enrichment/separation methods including solvent extraction, cloud point extraction and solid-phase extraction have been commonly used for sample pre-treatment.16
Solid phase extraction (SPE) is an attractive technique that reduces solvent usage and exposure, disposal cost and extraction time for sample preparation.4,13,15-21 Various solid-phase extraction
materials including Duolite XAD 761,19 Dowex optipore V-493,15
microcrystalline naphthalene.20 Sepiolite21 and Al
2O3 nanoparticles4
have been used for the extraction and determination of iron species. In the present study, a solid phase extraction method was de-veloped for the speciation and determination of iron in different water samples using the new ligand dimethyl (E)-2-[(Z)-1-acetyl)-2-hydroxy-1-propenyl]-2-butenedioate (DAHPB) to retain the iron prior to detection by flame atomic absorption spectrometry (FAAS).
EXPERIMENTAL
Reagents
Extra pure methanol, acetonitrile (AN), nitric acid, trimethyla-mine (solution 50% w/w in water), dimethyl acetylenedicarboxylate, acetylacetone, and hydrochloric acid were used as received from Merck. The standard solution of iron(III) (1000 mg L-1) was from
Merck, and iron(II) stock solution (1000 mg L-1) was prepared by
dissolving of Fe(NH4)(SO4)2.6H2O in water and adjusting the pH to 1.0 by adding HCl accordingly.
Synthesis of ligand
Trimethylamine solution (2.36 × 10⁻² g, 50% w/w in water,
0.20 mmol) in 1 mL CH2Cl2 at 0.0 °C , was added, drop wise to a stirred solution of dimethyl acetylenedicarboxylate (0.28 g, 2 mmol) in 2 mL CH2Cl2, for 5 min. Acetylacetone (0.20 g, 2 mmol) in 1 mL CH2Cl2 was then added drop wise to the solution at 0.0 oC for 5 min. The reaction
mixture was then allowed to warm up to room temperature and was stirred for 2 h. The solvent was removed under reduced pressure and the product was obtained as a brown oil. IR (KBr, υ/cm-1): 3435, 1719,
and 1631; 1H NMR (250.1 MHz, CDCl
3): δ = 1.84 (s,6 H, 2 CH3), 3.64
and 3.73 (2 s, 6 H, 2 OCH3), 6.99 (s, CH), 16.45 (s, OH); 13C NMR
(62.9 MHz, CDCl3): δ = 23.3 (2 CH3), 52.0 and 52.8 (2 OCH3), 106.8,
131.8, and 139.7 (3 C), 164.9 and 166.5 (2 CO, ester), 189.8 (2 CO).
Instrumentation
The determination of iron and other cations were performed on a Shimadzu AA-670 atomic absorption spectrometer (Kyoto, Japan) un-der the recommended conditions for each metal ion. The wavelength used to detect iron was 248.3 nm and bandwidth was 0.2 nm. All pH measurements were performed using an Metrohm E-691 digital pH meter with a combined glass electrode. Spectrophotometric measure-ments were take using a Carry 1E dual beam spectrophotometer with a 1 cm glass cell. A mol ratio measurement was done with a Metrohm 662 photometer at 482 nm. Conductance measurements were carried out using a Metrohm 712 conductometer. A dip-type conductivity cell made of platinum black, with a cell constant of 0.832 cm-1 was used.
General extraction procedure
Extraction was performed using Empore membrane disks (3 M Co., St. Paul, MN, USA); 47 mm diameter, 0.5 mm thick with 90% octadecyl-bonded silica (8 µm particle, 60 Å pore size) and 10% PTFE fiber. The disk was used in conjunction with a standard Millipore 47 mm filtration apparatus connected to a vacuum pump. In order to remove potential interferences and to ensure optimal extraction of the analyte of interest, the recommended disk cleaning and conditioning were performed before use. After placing the membrane disk in the filtration apparatus, 10 mL methanol was poured onto the disk and immediately drawn through it by applying a slight vacuum. After all the solvent had passed through the disk, it was dried by passing air through it for a few minutes. The disk conditioning was then begun by pouring 10 mL methanol onto the disk, applying a low vacuum, and letting the solvent surface almost reach the surface of the disk, without allowing the disk to soak without vacuum, nor allowing air to come into contact with the disk surface. A DAHPB solution (9 mg in 5 mL acetonitrile) was then introduced onto the disk and drawn slowly through the disk using a vacuum. Finally, the disk was washed with 25 mL of water and dried by passing air through it.
The general procedure for the speciation of iron on the membrane disk was as follows. The modified disk was first washed in 0.5 mL methanol followed by 25 mL buffer solution with the same pH as the sample solution. The appropriate volume of iron(III) and iron(II) sam-ple solution (adjusted to pH 2.5 with HCOOH, NaCOOH) was passed through the membrane. After the extraction, the disk was fully dried by passing air through it for a few minutes. The extracted iron(III) was stripped from the membrane disk using 9 mL of 0.1 mol L-1 EDTA.
The eluted solution was collected in a test tube and then measured by flame atomic absorption spectroscopy.
RESULTS AND DISCUSSION
Absorbance spectra
To investigate the possibility of DAHPB as a suitable ligand for speciation of Fe(III) and Fe(II), interaction of this ligand with diffe-rent metal cations was studied spectrophotometrically at aqueous solutions. The results of the experiments are shown in Figure 1.
As can be seen from Figure 1 iron(III) formed a red complex with DAHPB that absorbed at λmax = 482 nm, while iron(II) and the other
tested cations did not form any color complexes. These results indicate that DAHPB may be a selective complexing agent for determination
and speciation of iron in the presence of other metal ions. The stoichio-metry of the Fe(III)-DAHPB complex was determined by absorbance measurements at λmax = 482 nm. The stoichiometry was determined
to be 1:3 (ML3) using both the mole ratio method (Figure 2a) and continuous variation (or job’s) method (Figure 2b).
Conductimetric titration
Complex formation of the DAHPB with Fe(III) and Fe(II) ions in AN was also investigated using conductance measurements at 25 °C. The resulting molar conductance vs. DAHPB to Fe(III) or Fe(II) mole ratio plots, are shown in Figure 3.
In the cases studied, addition of ligand to the Fe(III) ion solution caused a continuous increase in molar conductance of the solution, indicating a higher mobility of complexed Fe(III) ion in comparison to the solvated cation. It is clear from Figure 3 that the slope of the corresponding mole ratio plot changes sharply at the point where the ligand-to-cation mole ratio = 3, indicating the formation of a 1:3 complex (ML3). However, in the case of Fe(II) ion, addition of the
ligand to the solution does not cause any considerable change in slope, even at a ligand Fe(II) ion mole ratio of 4. This behavior probably indicates that complexes cannot form between them. Thus, based on the results discussed above, the following reaction mechanism is suggested as that responsible for the extraction and speciation of Fe3+
ions. The structure of the complex is shown in Figure 4. Fe3+(aq) + 3 DAHPB (solid phase) D Fe (DAHPB)
3(solidphase) + 3H+(aq)
Figure 1. UV-visible absorption spectra of different metal cations with DAHPB in aqueous solution pH 2.5 adjusted with HCOOH – NaCOOH
Figure 2. Mole ratio method (a), and (b) Job’s method for stoichiometry determination of complex at 482 nm, XL is mole fraction of ligand the
condi-tion: (a) [Fe3+] = 1 × 10⁻³ mol L-1, [DAHPB] = 1 × 10⁻⁴ mol L-1, pH = 2.5,
(b) condition: [Fe3+] = [DAHPB] = 1×10⁻³ mol L-1; pH = 2.5: λ
Effect of amount of DAHPB
The amount of ligand is an important parameter to obtain quanti-tative recovery. For this reason, the amount of ligand was tested in the range of 0-12 mg. As shown in Figure 5, quantitative recoveries were obtained when the ligand amount was higher than 8 mg. Accordingly a 9 mg of the ligand was used in all experiments.
Effect of pH on speciation of Fe (III) and Fe (II) ions
pH is another important parameter for extraction studies. Much of the selectivity achieved in this extraction depends on adequate control of pH.26,27 The effect of pH of aqueous phase on extraction recovery
was studied by applying the proposed procedure to the sample solution. The pH of each solution was adjusted to values ranging from 1 to 7 with HNO3 and/or NaOH solutions. The results are given in Figure 6,
showing the recoveries of Fe(III) were quantitative (> 95%) in the pH range of 2.4-7.0, while Fe(II) was not quantitatively recovered at all pH levels. These results show that iron(II)’s complex cannot form between ligand and Fe(II) ions. However, some adsorption of Fe(II) ion at higher pH values (> 2.7) is due to silanol groups (Si – OH) on the surface of the disk, which tend to retain iron(II) ions from the solution. Thus in all subsequent studies for the separation/preconcentration of Fe(III), a pH 2.5 was used where pH adjustment in each sample was carried out by sodium formate/formic acid buffer solution.
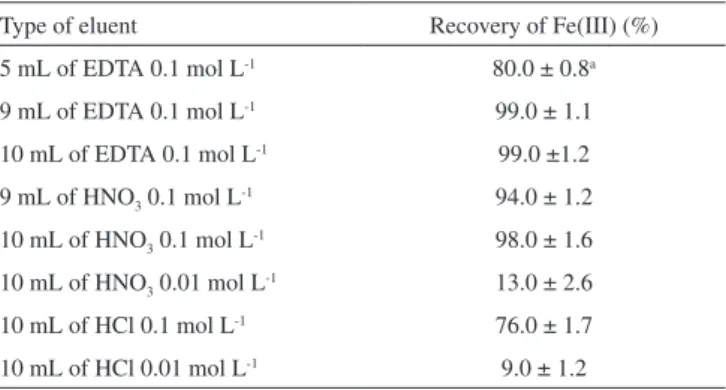
Effect of type and concentration of eluent
Various inorganic acids and EDTA were used to identify the best eluent for adsorbed Fe (III) ions on the modified disk. The results are shown in Table 1. Among the different eluents used, 9 mL of 0.1 mol L-1 EDTA provided the highest recovery. Therefore, this
solution was chosen as an eluent for further study.
Effect of flow rate of sample solution and eluent
The effect of flow rates of the sample solution on the reco-very of Fe (III) and Fe (II) were also investigated in the range of 2-14 mL min-1. The results showed iron(III) was quantitatively
reco-vered in range of 2-8 mL min-1, while Fe(II) was not retained on the
disk for the whole range of flow rates tested. Therefore, a flow rate of 7 mL min-1 was applied for analytes.
The flow rate of eluent solution was also examined in the range of 0.5-5.5 mL min-1 and the results showed maximum recovery for
Fe(III) was obtained in the range of 0.5-2.5 mL min-1. Consequently,
a flow rate of 2 mL min-1 was chosen as the optimum value.
Figure 3. Molar conductance vs [L]/[M] for DAHPB - Fe3+and DAHPB - Fe2+
systems in AN solution. XL is mole fraction of the ligand
Figure 4. Structure of the complex
Figure 5. Effect of the amount of ligand on the percent of recovery of Fe(III), sample volume: 100.0 mL, amount of Fe3+ is 50.0 µg, pH = 2.5
Figure 6. Effect of pH on percent of recovery of Fe2+ and Fe3+, sample volume:
100.0 mL containing 50.0 µg of Fe3+and Fe2+ ions
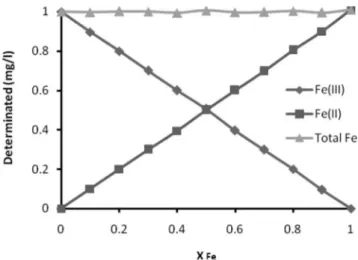
Effect of Fe(II)/Fe(III) ratios
In order to study the range of applicability of the proposed me-thod it was necessary to investigate the effect of Fe(II)/Fe(III) ratios from 0:10 to 10:0. Results of this investigation are given in Figure 7. As seen in Figure 7, the recoveries of Fe(III), Fe(II) and total Fe were not affected even when the mole ratio of Fe(II)/Fe(III) changed from 0:10 to 10:0, and all recoveries were in the range of 95-100%.
Interference study
The influence of foreign ions which interfere with determination of analyte ions by the presented method in various environmental samples was examined. In this experiment, solutions of 50.0 µg L-1 of
Fe(III) and Fe(II) and added interfering ions were treated according to the recommended procedure. Results are given in Table 2. The recoveries of analytes were grater than 95%. Tolerable limit was defined as the highest amount of foreign ions that produced an error not exceeding 5%. As shown in Table 2, the presence of major cations and anions had no obvious influence on the determination of Fe(II) and Fe(III) under selected conditions.
Breakthrough volume and enrichment factor
In order to investigate the breakthrough volume, sample solutions of 25, 50, 100, 500, 1000 and 1500 mL containing 50.0 µg Fe(III) were passed through the column, and then treated according to the recom-mended procedure. It was found that Fe(III) could be quantitatively retained in all cases. Thus, the breakthrough volume of the method must be greater than 1500 mL. As described in the previous section, the elution volume for Fe(III) was 9 mL, therefore an enrichment factor of 166 for Fe(III) could be obtained in this work.
Precision, limit of detection and maximum capacity
Precision was measured for a series of 10 independent determi-nations containing 0.5 mg L-1 of Fe(III) in 100 mL of sample. The
Figure 7. Effect of different ratios of Fe3+/Fe2+ on the recovery of Fe2+, Fe3+
and total Fe, sample volume: 100.0 mL, pH = 2.5. XFe : mole fraction of Fe
Table 2. Influence of some foreign ions on the percent of recovery of the analytes (N = 3)
Interfering ion Amount of interfering (mg L-1) Added as Recovery of Fe(III)(%) Recovery of Fe(II)(%)
Na + 15000 NaNO
3 99 ± 1a 99 ± 1
K + 5000 KNO
3 100 ± 1 97 ± 2
Mg 2+ 4000 MgCl
2.6H2O 98 ± 2 99 ± 1
Ba 2+ 1000 Ba(NO
3)2 98 ± 1 98 ± 3
Ca 2+ 2000 Ca(NO
3)2.4H2O 98 ± 1 100 ± 1
Cd 2+ 500 Cd(NO
3)2.6H2O 100 ± 2 99 ± 2
Sr 2+ 1000 SrBr
2.6H2O 97 ± 2 101 ± 1
Cu 2+ 350 Cu(NO
3)2.3H2O 97 ± 2 96 ± 1
Co 2+ 500 Co(NO
3)2.6H2O 99 ± 1 98 ± 2
Zn 2+ 500 Zn(NO
3)2.6H2O 98 ± 2 99 ± 2
Pb 2+ 500 Pb(NO
3)2 101± 1 100 ± 2
Sn2+ 300 SnCl
2.2H2O 98 ± 1 97 ± 2
Ni 2+ 500 NiCl
2.6H2O 99 ± 2 96 ± 1
Mn 2+ 500 Mn(NO
3)2.4H2O 99 ± 1 100 ± 1
As3+ 100 Na
2AsO2 97± 2 97± 1
Al3+ 250 Al(NO
3)3.9H2O 98± 3 99± 2
PO4 3 - 400 Na
3PO4.12H2O 98 ± 1 101± 1
SO4 2 - 500 Na
2SO4 98 ± 1 97 ± 2
ClO4 - 500 NaClO
4 100 ± 1 98 ± 3
SCN - 150 NaSCN 99 ± 1 100 ± 1
Br - 2000 KBr 98 ± 3 98 ± 2
Cl - 8000 NaCl 99 ± 2 99 ± 1
I - 500 KI 97 ± 2 101 ± 1
NO3 - 40000 NaNO
3 100 ± 1 98 ± 1
NO2- 30000 NaNO
2 97 ± 1 98 ± 1
relative standard deviation (RSD) was 2.1%.
The limit of detection LOD of the proposed method for the determination of iron(III) was studied under optimal experimental conditions. The detection limits were expressed as the amount of analyte in µg L-1 giving a signal-to-noise ratio of 3. The LOD obtained
from C = KbSb m-1 for a numerical factor of K
b = 3, was 2.8 µg L-1.
The maximum capacity of the disk obtained from three replicate measurements was 100 ± 3 µg of Fe (III) on the disk. In addition, the disk was stable for 3 runs using 100 mL of sample solution.
Analysis of the natural water samples
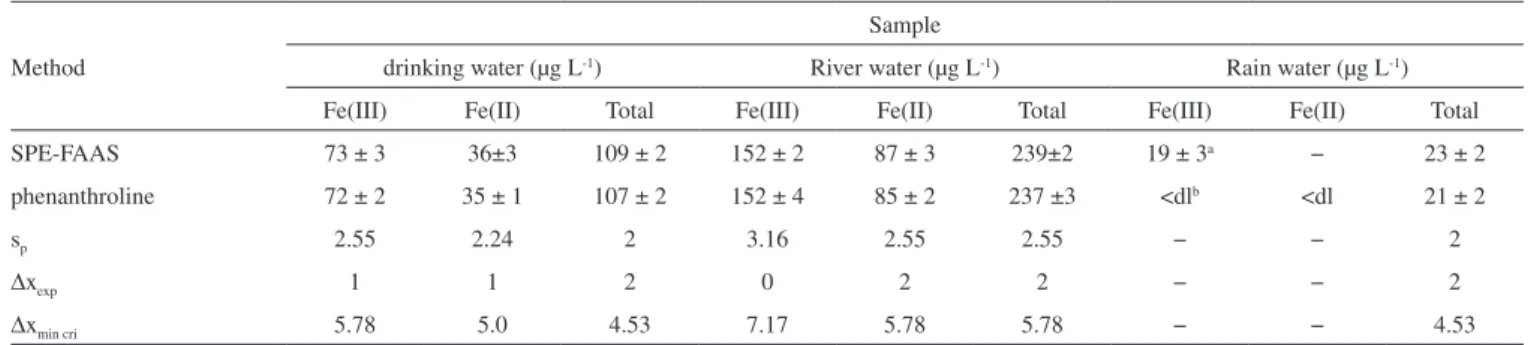
The proposed method was applied to the speciation and determi-nation of Fe(III) and Fe(II) from 100 mL water samples from white river water (Lahijan, Iran), rain water (Iran) and drinking water (Sanandaj, Iran). The results obtained are shown in Table 3 and compared with those obtained by the standard spectrophotometric method.28 As shown in Table 3, the results obtained by solid-phase
extraction are in satisfactory agreement with those obtained by the spectrophotometric standard method.
Analysis of powdered milk
A 5.00 g amount of powdered milk was weighed in a platinum crucible, and placed into a muffle furnace at a temperature of 300 oC
for an hour. When charring was complete, the temperature was gra-dually raised to 500-550 oC and the sample ashed over night until
becoming a grayish white color. The ashed samples were removed from the furnace and allowed to cool, and then 5 mL of HCl (1+1) was added. The sample was then covered with a watch glass and gently boiled for 5 min. When the crucible and watch glass had cooled, the watch glass was removed, and any droplets formed on it were washed into the crucible with redistilled water.29 After adjusting the
pH, analysis was done as outlined previously, the results of which are shown in Table 4. The data in Table 4 demonstrates good agreement
between the results obtained for the proposed method and the standard spectrophotometric method.
Comparison of method with other systems
The comparative information from some recent studies on pre-concentration of Fe3+ is given in Table 5. As can be seen, in
compa-rison with the other reported methods, the present method showed a comparatively high linear dynamic range (40.0-1000.0 µg L-1)
and a higher enrichment factor (166) with a good limit of detection (2.8 µg L-1) for iron speciation in a short time frame.
CONCLUSION
The results of the present investigation demonstrate the utility of octadecyl silica membrane disk modified with new synthetic ligand for the separation and speciation of Fe(III) and Fe(II). The separated Fe(III) was subsequently measured by FAAS. Iron (II) was determined by difference in measurements after oxidation of iron(II) to iron(III) by HNO3.13 The method described allows the determination and
speciation of iron in water samples, compared with the standard method – that directly determines iron(II) concentration which can be at low concentrations in water samples. Fe(III) concentration is determined by subtraction of the Fe(II) from total iron. In the present work, the Fe(III) was measured directly and Fe(II) calculated by the difference. The two methods (standard and present) are therefore,
Table 3. The application of the presented and reference method in real samples (N=3)
Method
Sample
drinking water (µg L-1) River water (µg L-1) Rain water (µg L-1) Fe(III) Fe(II) Total Fe(III) Fe(II) Total Fe(III) Fe(II) Total
SPE-FAAS 73 ± 3 36±3 109 ± 2 152 ± 2 87 ± 3 239±2 19 ± 3a − 23 ± 2
phenanthroline 72 ± 2 35 ± 1 107 ± 2 152 ± 4 85 ± 2 237 ±3 <dlb <dl 21 ± 2
sp 2.55 2.24 2 3.16 2.55 2.55 − − 2
∆xexp 1 1 2 0 2 2 − − 2
∆xmin cri 5.78 5.0 4.53 7.17 5.78 5.78 − − 4.53
a Mean ± standard deviation, bBelow detection limit, At 95% confidence level, Degree of freedom = 6 – 2, ∆x
min cri = ±tsp(n1+n2 / n1×n2)1/2 , ∆xexp= x1 – x2.
Table 4. Analytical results of total iron in powder milk
Sample Fe determined (mg in 100 g) ∆xexp ∆xmin cri SPE-FAAS 1,10 phenanthroline
Powdered milk 5.69 ± 0.04 5.76 ± 0.07 0.07 0.14 At 95% confidence level, N = 3, Degree of freedom = 6 – 2,
∆xmin cri = ±tsp(n1+n2 / n1×n2)1/2, ∆xexp= x1 – x2.
Table 5. Characteristic performance data obtained by using the proposed and other reported methods for iron determination
Method LDR (µg L-1) R2 RSD% Concentration factor LOD (µg L-1) Ref.
Present Method 40- 1000 0.999 2.1 166 2.8 This work
SPEa-FAAS 20-1000 0.997 - 71 19 13
CPEb-FAAS 10-250 0.999 2.1 75 1.7 30
SPE-FAAS - - < 10 60 11 31
SPE-FAAS 20-350 - 2.3 24 2.3 19
SPE-FAAS - - 1.7 166 0.63 32
SPE-FAAS 250-5000 0.999 3.7 62 0.82 33
complimentary.13 The advantages of the proposed method, based
on the results presented in this study, can be summarized by the following points:
- the DAHPB reagent was found to be a powerful extractant for the selective extraction of Fe(III) ions;
- the method is simple, reproducible, selective and rapid; - the method determines concentrations of iron(III) directly, usually
present at a higher concentration in water samples;
- the separation of Fe(III) from potential interferences is possible at pH 2.5, such as strong oxidizing agent, nitrite, phosphates, zinc, cobalt, copper, nickel, bismuth, cadmium, mercury and silver so that these ions do not cause any interference. Therefore, the presented procedure seems less prone to interferences than the standard method and may be used as an alternative for those samples in which the standard method is not applicable; - the presented method is applicable to samples with a mole ratio
of Fe(III) / Fe(II) varying across a wide range (from 0:10 to 10:0).
REFERENCES
1. Cornelis, R.; Caruso, J.; Crews, H.; Hramann, K; Handbook of Elemental Speciation II, Species in the Environment, Food, Medicine and Occupational Health, John Wiley & Sons, 2005.
2. Martin, J. H.; Fitzwater, S. E.; Nature1988,331, 341.
3. Martin, J. H.; Gordon, R. M.; Broenkow, S. E.; Fitzwater. W.W.; Deep Sea Res. Part A1989, 36, 649.
4. Pu, X.; Hu, B.; Jiang, Z.; Huang, C.; Analyst2005, 130, 1175. 5. Achterberg, E. P.; Holland, T. W.; Bowie, A. E.; Fauzi, R.; Mantroura,
C.; Worsfold, P. J.; Anal. Chim. Acta2001, 442, 1. 6. Aki, M. A.; Microchem. J. 2003, 75, 199. 7. Kara, D.; Alkan, M.; Talanta2001, 55, 415.
8. Yaman, M.; Kaya. G.; Anal. Chim. Acta 2005, 540, 77. 9. Xiong, C.; Jiang, Z.; Hu, B.; Anal. Chim. Acta2006, 559, 113. 10. Pournghi-Azar, M. H.; Fatemi, B. M.; Microchem. J. 2000, 65,199.
11. Ensafi, A. A.; Chamjangali, M. A.; Mansur, H. R.; Anal. Sci. 2004, 20, 645.
12. Croot, R. L.; Johansson, M.; Electroanalysis2000, 8, 565. 13. Pehlivan, E.; Kara, D.; Microchim. Acta2007, 158, 137.
14. Ashdown, R. P.; Marriot, P. J.; J.HighResolut.Chromatogr. 2000, 23, 430.
15. Tuzen. M.; Melek. E.; Soylak. M.; J. Hazard. Mater. 2008, 159, 335. 16. Samaci, S.; Kartal, S.; Anal. Chim. Acta2008, 623, 46.
17. Sussulini, A.; Arruda, M. A. Z.; Eclet. Quim. 2006, 31,73.
18. Khayatian, G.; Ahmadzadeh Vosta Kolaie, H.; Nasiri, F.; Atashkar, B.; Hassanpoor, S.; J. Chin. Chem. Soc. 2010, 57, 118.
19. Marahel, F.; Ghaedi, M.; Montazerozohori, M.; Nejati Biyareh, M.; Nasiri Kokhdan, S.; Soylak, M.; Food. Chem. Toxicol. 2011,49, 208. 20. Puri, B. K.; Wasey, A.; Katyal. M.; Microchim. Acta 1989, 99, 17. 21. Bag, H.; Turker, A. R.; Tunceli, A.; Lale, M.; Anal. Sci. 2001, 17, 901. 22. Khayatian. G.; Karoonian, F. S.; Vaziri, S; Polish. J. Chem.2008, 82,
537.
23. Khayatian, G.; Shariati, S.; Shamsipur. M.; J. Incl. Phenom. 2003, 45, 117.
24. Hasani, M.; Shamsipur, M.; J. Incl. Phenom. 1993, 16, 123.
25. Jabbari, A.; Hasani, M.; Shamsipur, M.; J. Incl. Phenom. 1993, 15, 329. 26. Zoltov, Y. A.; Extraction of Chelate Compounds, Ann Arbon-Humphery:
London, 1970.
27. Morrison, G. H.; Freiser, H.; Solvent Extraction in Analytical Chemistry, John Wiley: London, 1966.
28. Franson, M. A. H.; Standard Method for Examination of Water and Waste Water, American Publication Health Association, 1995. 29. Pyenson, H.; Tracy, P. H.; J. Dairy. Sci. 1945, 28, 401.
30. Shakerian, F.; Dadfarnia, S.; Haji Shabani, A. M.; J. Iran. Chem. Soc.
2009,6, 594.
31. Saracoglu, S.; Elci,L.; Anal.Chim. Acta2002, 452, 77. 32. Khayatian, G.; Pouzesh, S.; J. Iran. Chem. Soc. 2007, 4, 490. 33. Yıldız, O.; Citak, D.; Tuzen, M.; Soylak, M.; Food. Chem. Toxicol. 2011,
![Figure 2. Mole ratio method (a), and (b) Job’s method for stoichiometry determination of complex at 482 nm, X L is mole fraction of ligand the condi-tion: (a) [Fe 3+ ] = 1 × 10 -3 mol L -1 , [DAHPB] = 1 × 10 -4 mol L -1 , pH = 2.5, (b) condition: [Fe](https://thumb-eu.123doks.com/thumbv2/123dok_br/18985808.458814/2.892.451.796.188.693/figure-method-method-stoichiometry-determination-complex-fraction-condition.webp)