Original Article
Braz J Oral Sci.July | September 2013 - Volume 12, Number 3
Effects of masticatory hypofunction on
mandibular morphology, mineral density and
basal bone area
Fernanda da Silva Guerreiro
1, Péricles Diniz
2, Paulo Eduardo Guedes Carvalho
1, Eduardo Cargnin Ferreira
3,
Sandra Regina Paulon Avancini
4, Rívea Inês Ferreira-Santos
11 Department of Pediatric Dentistry and Orthodontics, University of São Paulo City (UNICID), São Paulo, SP, Brazil 2 Department of Morphology, Federal University of Santa Catarina (UFSC), Florianópolis, SC, Brazil 3 Department of Genetics, Federal University of Santa Catarina (UFSC), Florianópolis, SC, Brazil 4 Department of Nutrition, Federal University of Santa Catarina (UFSC), Florianópolis, SC, Brazil
Correspondence to:
Rívea Inês Ferreira-Santos Universidade Cidade de São Paulo (UNICID) Pós-Graduação (Mestrado em Ortodontia) Rua Cesário Galeno, 448/Bloco A, CEP: 03071-000 - Tatuapé, SP, Brasil Phone: +55 11 21781310 Fax: +55 11 21781355 E-mail: [email protected]
Abstract
Aim: This experimental study investigated the association between masticatory hypofunction and mandibular morphological dimensions and internal bone characteristics. Methods: Twenty-four 21-day-old male Wistar rats were randomly divided into two groups, according to the diet consistency. The control group (CG) was fed a solid diet (pellets) and the experimental group (EG) received a powdered diet during 50 days. All animals were euthanized and their mandibles removed and processed for histomorphometric analysis. A calibrated examiner performed linear and angular measurements (mandibular body length and height, mandibular lengths, ramus depth and height, mandibular base depth, mandibular head and gonial angle) on photographs, estimated bone density in the mandibular ramus region on digital radiographs and assessed the area of cortical and trabecular bone tissue in the second molar region, in 5-µm-thick serial cuts stained with Cason’s Trichrome. Measurements for the study groups were compared using Mann-Whitney test (α=0.05). Results: some of the macroscopic dimensions evaluated on
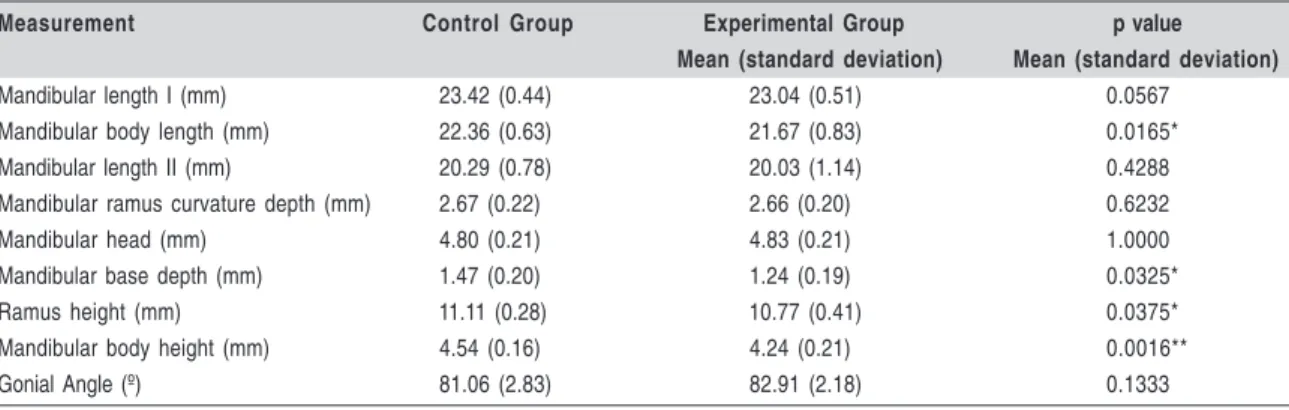
photographs were significantly smaller in EG compared to CG, specifically mandibular ramus height (10.77 mm vs. 11.11 mm, p=0.0375), mandibular body length (21.67 mm vs. 22.36 mm, p=0.0165) and height (4.24 mm vs. 4.54 mm, p=0.0016), as well as mandibular base depth (1.24 mm vs. 1.47 mm, p=0.0325). The relative mineral bone density was significantly decreased in EG (1.04) compared to CG (1.25), p<0.001. Rats in the EG also presented smaller trabecular and cortical bone area (2.36 mm²) than those in CG (3.16 mm²), p<0.001. Conclusions:
Based on the above-mentioned measurements, it may be concluded that masticatory hypofunction induced by a powdered diet affected mandibular morphology and was associated with significantly reduced bone content.
Keywords: mastication, diet, mandible, bone development.
Introduction
The adoption of a soft diet is related to histological, morphological and biochemical alterations in muscle fibers, which in turn impair the normal development of masticatory muscles1-2 and mandibular growth1,3-4. Similarly,
experimental studies using botulinum neurotoxin type A to induce masticatory Received for publication: July 03, 2013
Accepted: September 11, 2013
muscle atrophy reported decreased craniofacial growth and development5-6.
When bone is subjected to mechanical load, areas of tension and compression are generated in different regions, resulting in bone deposition and resorption as part of the remodeling process7-8. The mandibular ramus exhibits a
posterior concave and anterior straight border, which favors the development of compression and tension loads during mastication. Therefore, it was hypothesized that mechanical load arising in the mandibular ramus during mastication would generate the physiologic stimulus for bone remodeling and mandibular growth. Some evidence indicates that bone natural curvatures may restrict tissue deformation during mechanical load, so the bone tissue becomes more adapted and resistant to a normal pattern of strain distribution8.
Furthermore, bone curvatures tend to amplify the functional stimulus produced by mechanical loads9-10.
Considering that the mandible receives intense mechanical load during mastication, it may also be hypothesized that myofunctional alterations due to soft diet consistency would affect mandibular overall remodeling process with consequences on bone curvatures. Thus, to avoid biased assumptions, this study assessed the relationship between masticatory muscles hypofunction, induced by a prolonged powdered diet, and mandibular morphological measurements (i.e. assessment of bone curvatures, sagittal and vertical dimensions), estimation of mineral bone density
and quantification of basal area. The null hypothesis stated that there are no differences between animals fed powdered or solid diet.
Material and methods
The experimental protocol was approved by an Institutional Review Board on the Use of Animals (#2007-0138).
Experimental design
The sample comprised 24 male Wistar rats (Albinus norvegicus), 21 days old, randomly and equally divided into two groups, according to the diet consistency. The control group received solid diet, i.e. laboratory chow for rats in a hard commercial pellet form without modifications (Nuvilab CR-1®; Nuvital, Colombo, PR, Brazil), while the experimental
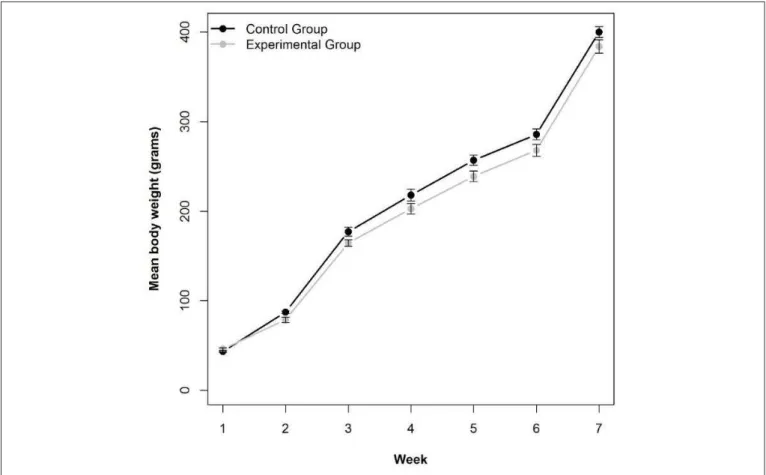
group received a powdered diet, which consisted of ground and sieved commercial pellets. Similar amounts of food and water were offered ad libitum. Apart from the diet, there was no other material or object that could induce masticatory stimulus inside the cages. Body weight was measured on a calibrated precision scale once a week to assure normal development as related to growth and health for the animals (Figure 1). Despite the minor differences between body weight measurements of control and experimental animals, both groups had normal development. Even in the experimental group, there
Fig. 1. Mean (±SE: bars) body weight in control and experimental groups, from the first to the last (seventh) week of experiment.
206
206
206
206
was progressive increase in body weight (Figure 1).
All animals were euthanatized by anoxia in CO2 chamber on the 50th day of the experiment. The mandibles were
removed, separated from the soft tissue, split in two halves and placed in identified recipients containing 4% buffered paraformaldehyde solution (Phosphate Buffered Saline-PBS, pH 7.2; Sigma-Aldrich® Co., Saint Louis, MO, USA) for 48 h.
Macroscopic measurements
Standardized photographs of the hemi-mandibles were taken with a digital camera (E10; Olympus Corp., Kobe, Japan) at a resolution of 300 dpi and stored in TIFF (Tagged Image File Format), 8 bits. A millimeter scale was included in the photographic field. A tripod was used for steadying the camera at right angle to the hemi-mandible.
Macroscopic measurements were carried out on digital photographs using the image analysis software Scion Image® (NIH Image; Scion Corp., Frederick, MD, USA). Some reference landmarks and measurements used in this study were adapted from cephalometric measurements in a previous investigation4.
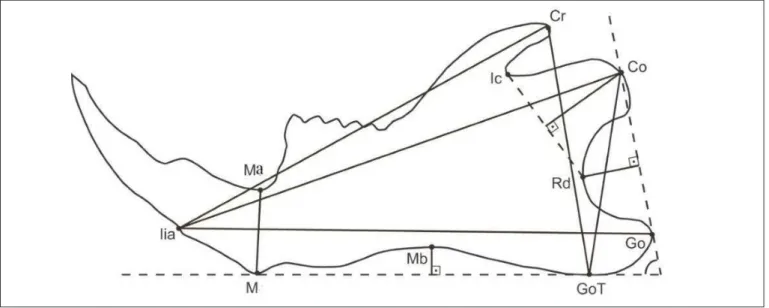
Biometric points (Figure 2)
M (menton): the lowest point on the mental symphysis contour
Iia (alveolar point of the mandibular incisor): the lowest point of the buccal alveolar bone contour of the mandibular incisor
Ma (mandibular alveolar point): the deepest point of the upper part of the alveolar crest between the mandibular incisors and first molar
Co (condylion): the most posterior and superior point of the mandibular head
Go (gonium): the most posterior point of the mandibular angle contour
GoT (gonial tangent): the lowest point of the mandibular
Fig. 2. Biometric points and measurements. Mandibular length I (Co-Iia); Mandibular body length (Go-Iia); Mandibular length II (Cr-Iia); Mandibular ramus curvature depth (Rd at right angle to Co-Go); Mandibular head (Co at right angle to Rd-Ic); Mandibular base curvature depth (Mb at right angle to GoT-M); Ramus height (Co-GoT); Mandibular body height (M-Ma); Gonial angle (intersection between Co-Go and GoT-M).
angle contour
Cr (coronoid): the most superior and posterior point of the coronoid process
Rd (ramus depth): the deepest point in the concavity of the mandibular ramus
Ic: point located in the notch between the coronoid process and the mandibular head
Mb (mandibular base): the deepest point of the mandibular base concavity
Sagittal Measurements (Figure 2)
Mandibular length I: distance between points Co and Iia Mandibular body length: distance between points Go and Iia Mandibular length II: distance between points Cr and Iia Mandibular ramus curvature depth: distance from point Rd at right angle to the Co-Go line
Mandibular head: distance from point Co at right angle to the Rd-Ic line
Vertical measurements (Figure 2)
Mandibular base depth: distance from point Mb at right angle to the GoT-M line
Ramus height: distance between points Co and GoT. Ramus height could also be measured as the distance between points Cr and GoT. However, the anatomical region where point Cr would be located consists of a very thin bone structure, which is often fractured during dissection. Therefore, measurements were carried out using the distance Co-GoT.
Mandibular body height: distance between points M and Ma
Angular Measurement (Figure 2)
Gonial Angle: intersection of lines passing through points Co-Go and GoT-M.
207
207
207
207
207
Mineral bone density assessment
Standardized digital radiographs of the hemi-mandibles were obtained using the DenOptix® system (Dentisply
International/Gendex® Dental X-ray Division, Des Plaines,
IL, USA), with an occlusal size (57 mm X 76 mm) storage phosphor plate. The X-ray unit GE 1000® (General Electric
Co., Milwaukee, WI, USA) operated in a constant regime at 70 kVp and 10 mA, 2.5 mm total aluminum filtration, and a 50 cm focus–receptor distance. An aluminum step wedge was positioned on the storage phosphor plate during the exposures. An acrylic device was manufactured to hold the storage phosphor plate, hemi-mandibles, aluminum step wedge and the X-ray beam indicator device in a reproducible relationship.
The images were acquired using the standard commands of the digital radiographic system. The DenOptix® storage
phosphor plate scanning was performed at a resolution of 300 dpi. By this procedure, the pixel size is estimated at 85 µm2 and image resolution is equivalent to 6 line pairs per millimeter. The digital radiographs were stored in compact disc-recordable media as 8-bit TIFF images. Subsequently, mineral bone density was assessed using the image analysis software Scion Image®, which compared the gray levels of
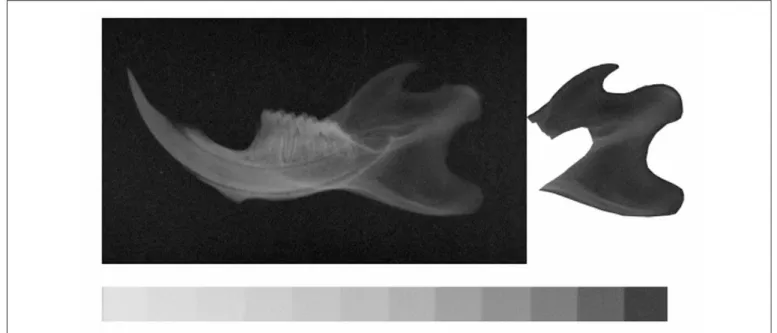
the region of interest in the hemi-mandibles with those of the aluminum step wedge. The mean mineral bone density was calculated in the mandibular ramus area, except for the mandibular incisors’ roots (Figure 3). The results were expressed in values equivalent to those of the aluminum step wedge.
Histomorphometry
The hemi-mandibles were then immersed in 5% nitric acid solution for removing all mineral content. Thereafter, the specimens were embedded in paraffin according to the histological protocols. Longitudinal sections (5 µm-thick) were obtained along the second molar region. A total of 5
Fig. 3. Radiographic image of the mandibular ramus, selected to perform measurements of mineral bone density.
sections stained with Cason’s trichrome were randomly selected for analysis. Photomicrographs of the cut sections were acquired using a 3.3 megapixels cooled color digital camera (QColor 3C; QImaging, Surrey, BC, Canada) connected to an optic microscope (Olympus BX41, Center Valley, PA, USA) by the QCapture Pro 5.1 software (QImaging). A 2 mm-long micrometric scale was positioned in the image field. The images were captured at a resolution of 640 X 512 pixels through a 4X magnification objective and stored as 8-bit TIFF. All photomicrographs corresponding to the multiple parts of one cut section were assembled into one image using the PTGui Pro 7.1 software (New House Internet Services B.V., Rotterdam, The Netherlands). The final image was rotated until the most prominent upper and lower points in the lingual surface were vertically aligned. Other image processing software (Photoshop® CS, Adobe®, San Jose, CA,
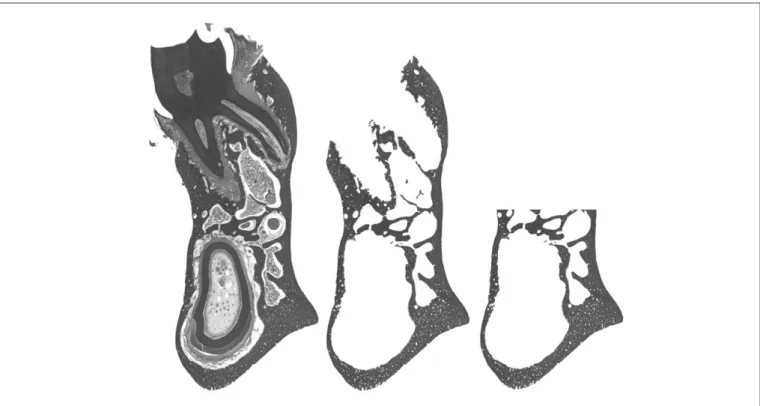
USA) was used to erase structures other than bone from the image. Subsequently, the image corresponding to the second molar and its alveolar process was erased by drawing a horizontal line passing on the roof of the mandibular canal. The remaining images of the mandibular basal bone were converted to gray scale (Figure 4), stored as TIFF and analyzed using the Scion Image® software, which provided the area measurements in mm2.
Method error
To estimate reproducibility, macroscopic, bone density and histomorphometric measurements were performed twice. The images were renamed by a second operator in order to prevent the examiner to identify the groups during measurements. A 15-day interval was allowed to elapse between the first and second assessments. Wilcoxon test and Dahlberg’s formula were used for analyses of systematic and casual errors, respectively. Systematic errors were not statistically significant (p>0.05). The casual errors for macroscopic (0.01 – 0.25 mm; 0.01º), bone density (0.0065)
208
208
208
Fig. 4. Cut section vertically aligned. Soft tissue, alveolar process and tooth were removed from the image to measure the area of mandibular basal bone.
and histomorphometric (0.0414 mm2) measurements were
considered acceptable.
Statistical analysis
All measurements obtained for the study groups were compared using Mann-Whitney test, which is an alternative to the Student’s t-test and can be useful for small samples. Given two independent samples, it tests whether one feature tends to have values higher than the other.11 Spearman
coefficients were calculated to test any possible correlation between body weight after 50 days of experiment and morphological measurements, bone density and basal area. This kind of analysis can provide evidences that insufficient food intake is actually associated with decreased mandibular development, and not hypofunctional load. The significance level was set at 0.05. Statistical analyses were carried out using the Stata 8.0 package (StataCorp. LP, College Station, TX, USA).
Results
The Spearman coefficients obtained for all measurements were lower than 0.70, evidencing weak correlations between body weight and mandibular development features.
In general, the experimental group presented smaller morphological measurements compared to the control group. Concerning the sagittal measurements, mandibular body was significantly shorter in experimental animals compared to the controls. All vertical measurements were decreased in the experimental group (Table 1). No significant difference was found between groups for the gonial angle.
Both radiographic bone density and mandibular basal bone area in the second molar region were significantly reduced in the experimental group compared to the control group (Table 2). Not only the amount of bone structure, but also the mineral composition was decreased in animals fed a powdered diet.
Discussion
Masticatory hypofunction may affect facial bone physiology12 and morphology4-6,13-14. The effects of soft diet
on the mandibular bone development have already been studied by X-ray-based imaging4,13,15 or histological16
methods. However, the present study used different methodologies, which not only complement each other, but also give distinct results to prove the rationale of this investigation. As shown in Tables 1 and 2, the mandibular body length and height, the ramus height, as well as the mandibular basal bone area and the radiographic density in the mandibular ramus were significantly decreased in the experimental group, compared to the control group. This study was able to demonstrate that low masticatory demands were associated with remarkable changes in the mandibular morphology and alveolar process. These results corroborate those registered in other experimental studies4,13,15-16.
Powdered diet affected all three vertical linear dimensions of the mandible (Table 1). Reduced ramus and mandibular body heights in the experimental group might be resulting from inhibition or delay in basal bone and alveolar process growth. In Agreement with these findings, a previous study reported that masticatory hypofunction was associated with reduced cortical bone deposition, particularly
209
209
209
209
209
Measurement Control Group Experimental Group p value Mean (standard deviation) Mean (standard deviation)
Mandibular length I (mm) 23.42 (0.44) 23.04 (0.51) 0.0567
Mandibular body length (mm) 22.36 (0.63) 21.67 (0.83) 0.0165*
Mandibular length II (mm) 20.29 (0.78) 20.03 (1.14) 0.4288
Mandibular ramus curvature depth (mm) 2.67 (0.22) 2.66 (0.20) 0.6232
Mandibular head (mm) 4.80 (0.21) 4.83 (0.21) 1.0000
Mandibular base depth (mm) 1.47 (0.20) 1.24 (0.19) 0.0325*
Ramus height (mm) 11.11 (0.28) 10.77 (0.41) 0.0375*
Mandibular body height (mm) 4.54 (0.16) 4.24 (0.21) 0.0016**
Gonial Angle (º) 81.06 (2.83) 82.91 (2.18) 0.1333
Table 1. Comparative analysis of the mean values for sagittal, vertical and angular measurements,
obtained on photographs, between control and experimental groups.
*p < 0.05, ** p < 0.01
in the mandibular basal region17 and inhibition of the alveolar
process development2-3. Several parameters of mechanical
load influence bone shape, but bone adapts its structure more readily in response to the peak of strain induced by mechanical load than to the load frequency or duration of the stimulus18. Therefore, the lack of vigorous masticatory
stimulus caused by a powdered diet might have reduced the intensity of mechanical load applied to the mandible and compromised the ramus cortical sliding, leading to a decrease in mandibular size as observed in the experimental animals. According to the mechanostat theory18, bone tissue tends
to increase in volume whenever it is exposed to mechanical loads over 1,500 microstrains. Nevertheless, bone has a trend to maintain or decrease its volume when exposed to mechanical loads below 1,500 microstrains18. Strain is a
measure of deformation. Cortical bone deposition on the periosteal surface, stimulated by mechanical load, increases bone resistance to reduce the peak strain to a level that does not compromise tissue integrity9-10. Differently from other
parts of the human body subjected to high intensity mechanical load resulting from impact activities, the mandibular bone has a distinct feature associated with a noticeably great resistance to quasi-static loads imposed by the masticatory function. The mandibular body resistance to flexural deformation is proportional to the cross-sectional area where a perpendicular load is applied, divided by the depth of curvature caused by tissue deformation10. The higher
the intensity of the applied load, the greater must be the cross-sectional area of bone tissue to resist the deformation. Although the level of strain in the mandible was not measured in the present study, it is possible that animals fed a powdered
Measurement Control Group Experimental Group p value Mean (standard deviation) Mean (standard deviation)
Radiographic bone density 1.25 (0.07) 1.04 (0.04) < 0.0001
(aluminum equivalent)
Basal bone area (mm2) 3.16 (0.21) 2.36 (0.16) < 0.0001
Table 2. Comparative analysis of the mean values for radiographic bone density of the mandibular ramus
and mandibular basal bone area in the second molar region measurements, between control and experimental groups.
diet experienced lower level of strains in the mandibular basal bone due to the lack of vigorous masticatory stimulus, while mastication of hard pieces of pellets by the control rats might have induced sufficient strains to stimulate cortical bone deposition on the mandibular periosteal surface. Therefore, it may be assumed that masticatory hypofunction due to a powdered diet could be associated with reduction in the cross-sectional area of the mandibular basal bone by inhibiting or postponing cortical bone deposition. This supposition is in agreement with previous findings17, in
which inhibition of periosteal bone deposition on the mandible was observed after posterior teeth disocclusion. However, after reestablishment of normal occlusion or masticatory function, bone qualitative and quantitative characteristics can be improved, denoting the so-called catch-up effect of functional adaptation2,17.
The mandibular base depth, measured in an area of mandibular body curvature, was significantly reduced in the experimental group in comparison to the control group (Table 1). It has been suggested that the shape of the cross-sectional area and the bone curvatures could act jointly to react to high levels of strain during deformation of the tissue subjected to mechanical load. However, bone architecture would restrict and coordinate the direction of load to avoid potentially dangerous overloads on the unusual axes10. Moreover, an
axis for mechanical load application provided by bone architecture would enable less tissue accumulation without jeopardizing resistance, since it would not be necessary to increase bone mass to resist the strain generated by mechanical loads in several directions. Accordingly, it is reasonable to assume that the mandibular bone mass adapted its structure
210
210
210
in the experimental group, not only by reducing its cross-sectional area, but also by attenuating the mandibular base curvature in response to a decreased mechanical load.
Although the mandibular base curvature has been attenuated due to the reduced muscular stimulus, the mandibular ramus curvature depth was not significantly affected (Table 1). This feature might not have been affected because the strain on the posterior ramus border was not high enough to promote changes in the curvature depth or presumably because ramus structure in the sagittal plane was sufficiently thicker to avoid flexure when masticatory load is applied18. It may be suggested that the lack of vigorous
masticatory stimulus may affect ramus thickness to a greater extent in relation to the mandibular ramus curvature depth. The significant decrease in radiographic bone density of the mandibular ramus in the experimental group, as shown in Table 2, corroborates this assumption. Even though significantly decreased cortical bone deposition has been observed in the mandibular basal region of interest, it is important to take into account that this decrease in radiographic bone density in the experimental group may also have resulted from bone hypomineralization. Other authors mentioned the negative influence of muscular hypofunction induced by the alteration of diet consistency on the mandibular cortical bone deposition17 as well as on
bone density in different regions of the mandible, such as the alveolar process4,16, coronoid process and mandibular
angle4. The present study registered a decrease in radiographic
bone density encompassing a large area of the mandibular ramus, instead of isolated spot measurements.
Unlike previous reports13, in this study hypofunctional
masticatory load was not related to a significant decrease in the mandibular head (Table 1). In another study19, altered
functional temporomandibular joint (TMJ) load in mice for 2-6 weeks was associated with loss of condylar cartilage and transient decrease in density of the mandibular subchondral bone. However, masticatory hypofunction did not change the mandibular head length. In fact, long-term alteration in masticatory function due to liquid diet feeding may impair jaw-opening reflex maturation12, but it appears that genetic
and adaptive remodeling changes have greater influence on the mandibular head growth.
Despite the valid contribution of this study to understand the interplay between diet consistency and mandibular development, like most related scientific investigations, it was carried out under experimental conditions. Nevertheless, the ontogenetic changes in mandibular morphology are supported by the role of the functional mechanical load due to diet consistency during growth20. On the basis of these
study findings, it may be concluded that masticatory hypofunction induced by a powdered diet promoted significant changes in mandibular development in rats. The affected mandibles showed significant decrease in ramus and mandibular body heights, mandibular body length, and mandibular base curvature depth. In addition, radiographic bone density in the ramus and mandibular basal bone area in the second molar region were also significantly reduced.
References
1. Shimizu Y, Ishida T, Hosomichi J, Kaneko S, Hatano K, Ono T. Soft diet causes greater alveolar osteopenia in the mandible than in the maxilla. Arch Oral Biol. 2013; 58: 907-11.
2. Mavropoulos A, Odman A, Ammann P, Kiliaridis S. Rehabilitation of masticatory function improves the alveolar bone architecture of the mandible in adult rats. Bone. 2010; 47: 687-92.
3. Kiliaridis S. Masticatory muscle function and craniofacial morphology. An experimental study in the growing rat fed a soft diet. Swed Dent J Suppl. 1986; 36: 1-55.
4. Maki K, Nishioka T, Shioiri E, Takahashi T, Kimura M. Effects of dietary consistency on the mandible of rats at the growth stage: computed X-ray densitometric and cephalometric analysis. Angle Orthod. 2002; 72: 468-75. 5. Tsai CY, Yang LY, Chen KT, Chiu WC. The influence of masticatory hypofunction on developing rat craniofacial structure. Int J Oral Maxillofac Surg. 2010; 39: 593-8.
6. Tsai CY, Shyr YM, Chiu WC, Lee CM. Bone changes in the mandible following botulinum neurotoxin injections. Eur J Orthod. 2011; 33: 132-8. 7. Lanyon LE. Functional strain as a determinant for bone remodeling. Calcif
Tissue Int. 1984; 36(Suppl 1): S56-61.
8. Turner CH, Pavalko FM. Mechanotransduction and functional response of the skeleton to physical stress: the mechanisms and mechanics of bone adaptation. J Orthop Sci. 1998; 3: 346-55.
9. Currey JD. Effects of differences in mineralization on the mechanical properties of bone. Philos Trans R Soc Lond B Biol Sci. 1984; 304: 509-18. 10. Rubin CT. Skeletal strain and the functional significance of bone architecture.
Calcif Tissue Int. 1984; 36(Suppl 1): S11-8.
11. Hart A. Mann-Whitney test is not just a test of medians: differences in spread can be important. BMJ. 2001; 323: 391-3.
12. Changsiripun C, Yabushita T, Soma K. Masticatory function and maturation of the jaw-opening reflex. Angle Orthod. 2009; 79: 299-305.
13. Enomoto A, Watahiki J, Yamaguchi T, Irie T, Tachikawa T, Maki K. Effects of mastication on mandibular growth evaluated by microcomputed tomography. Eur J Orthod. 2010; 32: 66-70.
14. Patullo IM, Takayama L, Patullo RF, Jorgetti V, Pereira RM. Influence of ovariectomy and masticatory hypofunction on mandibular bone remodeling. Oral Dis. 2009; 15: 580-6.
15. Mavropoulos A, Kiliaridis S, Bresin A, Ammann P. Effect of different masticatory functional and mechanical demands on the structural adaptation of the mandibular alveolar bone in young growing rats. Bone. 2004; 35: 191-7.
16. Kingsmill VJ, Boyde A, Davis GR, Howell PG, Rawlinson SC. Changes in bone mineral and matrix in response to a soft diet. J Dent Res. 2010; 89: 510-4. 17. Shimomoto Y, Chung CJ, Iwasaki-Hayashi Y, Muramoto T, Soma K. Effects of occlusal stimuli on alveolar/jaw bone formation. J Dent Res. 2007; 86: 47-51.
18. Frost HM. Wolff’s Law and bone’s structural adaptation to mechanical usage: an overview for clinicians. Angle Orthod. 1994; 64: 175-88. 19. Chen J, Sorensen KP, Gupta T, Kilts T, Young M, Wadhwa S. Altered
functional loading causes differential effects in the subchondral bone and condylar cartilage in the temporomandibular joint from young mice. Osteoarthritis Cartilage. 2009; 17: 354-61.
20. Holmes MA, Ruff CB. Dietary effects on development of the human mandibular corpus. Am J Phys Anthropol. 2011; 145: 615-28.